Author(s): Mashasha Maxwell* and Chigidi Esther
Cancer is an age related autoimmune disease initiated by genetic mutations leading to increased proliferation rate and tumor formation. Accumulation of various genetic and epigenetic changes, in normal cells gives cancer cells a selective advantage over healthy cells, and lead to cancer initiation and progression. Interactions of tumor cells with other cells within their reach, the microenvironment, is an important component in carcinogenesis. Its treatment is based on our level of understanding of its biology. Breast cancer is a collection of complex and heterogeneous diseases with distinct histopathological features. It arises due to abnormal growths of the cells lining the breast lobules hence men and women can develop it, although very rare in men (less than ). There are different types of breast cancer, and the most common are the invasive and non-invasive cancers. Usually, it is common to study breast cancer tumors as isolated entities, but its biological and molecular structure are indicative of an unstable heterogeneous disease with multiple subtypes coexisting within a tumor. Many studies with different methodologies have been carried out to understand cancer development and progression, however, another approach of mathematical oncology has emerged. This approach uses mathematical and computational techniques to unpack generation, growth and evolution of cancer cells. With this work we would like to review what has been done by others so as to improve our understanding of cancer dynamics.
Cancer is a global health concern in the modern society and is the second driving cause of death worldwide after cardiovascular diseases. In 2015 the number of new cases and deaths were 14.9 million and 8.8 million respectively up from 12.7 million and 7.6 million in 2012 [1-3]. A lot of factors that are involved in solid tumor development, points that cancer is a generic term used to describe the selfish and uncontrolled growth of cells leading to tumor formation. Cancer is also defined as a multistage dynamic autoimmune disease that develops through accumulation of genetic alterations initiated by interactions between genetic and external factors [4]. Tumors can be mainly classified into two categories that is tumors of the epithelial tissues (carcinomas) and those of conjonctive tissues (sarcomas). All cancers begin in the local (primary) stage, which is called, in situ carcinoma when in the epithelial tissue. Most of them are benign (non-threatening) tumors that can be eliminated by the immune system. Some tumors can become invasive and spread to other body organs (metastasis) forming secondary tumors [5].
Environment and other nongenetic factors have roles in cancer development but it is widely acknowledged that cancer arises due to mutations in cancer-susceptible genes. Its progression is viewed as an evolutionary process driven by genetic variations and natural selection. Normal cells ensure tissue homeostasis through self-regulation through two principal ways: extracellular pathways and intracellular pathways. Through deregulating these two mechanisms, cancer cells can maintain the cell division cycle activated hence escape, proliferate and grow pathologically and these regulations can only be disrupted by cell mutation [6,7].
Oncogenes and tumor suppressor genes (TSGs) are most relevant in regulating cell proliferation, differentiation and apoptosis. Oncogenes (modified genes that promote tumor growth) create growth signals and promote cell cycle progression while TSGs delay cell cycle, to ensure proper DNA repair, and may trigger apoptosis. These genes regulate and maintain a balance between normal cell birth, growth and programmed cell death (genetic stability) hence we can define genetic instability as the rate at which cells acquire genetic abnormalities [8]. Cancer initiation starts with the malfunction or mutation of at least one of TSGs or oncogenes leading to accumulation of mutations in gatekeeper genes (genes that control growth). Gene mutation causes overactivity in oncogenes and neutralise the functionality of TSGs. Gene expression is important to maintain a balanced cell function as over expression and under expression of genes, instead of outright genetic damage, can be a potential contributor to proliferation. Viral infections like the human papilloma virus (HPV) and microenvironmental signals such as hypoxia (oxygen deprivation) also induce changes in gene expression. In addition to aging, exposure to external factors that include chemical radiation and environmental features urge deregulation and lead to tumor evolution [8]. Cancer development can be viewed as a plan for uncontrolled growth between the environment and tumor cells with approximately 30% of most cancer deaths due to behavioral and dietary risks. Chronic and viral infections such as HIV, Hepatitis B, and C virus are also risk factors for cancer causing up to 70% of cancer deaths in 2008. Cancer, in general, remains a health problem due to its complexity and is classified based on the tissue of origin. Uncontrolled growth occurs in any part of the body, hence there are over 200 different types of cancers. Different molecular mechanisms and pathological stages controlling cell migration and proliferation are defined from a biological perspective, but there are multiscale linkages that affect tumor behaviour in the molecular micro scale. Mathematical and computational models have been widely used to quantify and model intra tumor molecular linkages connecting them with tumor behaviours such as growth and invasiveness [9]. The interactions between cellular proliferation and adhesion are influenced by cellular genetics and by microenvironmental conditions such as hypoxia. Competition between heterogeneous cell proliferation, driving shape instability, and invasive tumor morphologies, and other stabilizing mechanical forces like cell to cell and cell to matrix adhesion determine the overall tumor morphology. The most damaging aspect of advanced cancer is metastasis, which is a complex phenomenon defining the invasion or spread of tumor cells to form secondary tumors in distant body parts. The most common metastatic destinations include breasts, prostate, bones, and lungs and clinically it is estimated that at least 90% of all cancer deaths are end results of a metastatic process [4,7,9]. There is competition within the tumor cell due to intrinsic and extrinsic selective pressures like limited nutrients hence leading to genetic instability within the heterogeneous tumor cell populations.
Globally breast cancer is the most common invasive cancer and the second leading cause of cancer-related mortality among women after lung cancer [9]. It arises due to abnormal growths of the cells lining the breast lobules. Both women and men can develop it, although it is rare in men only accounting for less than 1%. There are several types of breast cancer as they are classified according to their stage, but the most common is the premalignant stage known as the atypical ductal hyperplasia (ADH), which progresses to the preinvasive stage of ductal carcinoma in situ (DCIS), and finally culminating in metastatic invasive carcinoma. The invasive cancers can be categorized as either invasive ductal carcinoma (IDC) or Invasive Lobular Carcinoma (ILC) [10-12]. DCIS develops inside the normal milk ducts and is non-invasive, while IDC and ILC are invasive breast cancers that can metastasise [13,14]. Breast cancer development is a multi-step linear process that begins in the premalignant stage (ADH) to the preinvasive stage (DCIS) to the invasive stage (IDC and ILC). IDC and ILC have some identical features like tumour site, size, stage and grade, but have different metastatic and histology characteristics. IDC begins from the ducts and spreads to the fatty tissue of the breast, and ILC is mainly confined to the milk producing lobules. Breast cancer can spread to other body parts like lung, liver, bone, and brain and will be known as metastatic breast cancer or advanced breast cancer. It is estimated that if left untreated at most 75% of DCIS tumors progress to IDC. Tumor stages of the preinvasive and the invasive stages are heterogeneous, to characterise them tumor-grading systems have been developed to subtype the stages of DCIS and IDC. Yumei et al, identified three main tumor grades I, II, and III corresponding respectively to low, medium, and highly differentiated breast tumors. In grade I cancer cells are small and similar to normal cells in structure, when in grade II the cancer cells slightly bigger than normal cells, change shape and grow faster than normal cells while in grade III cancer cells are growing at a faster rate and are completely different from normal cells [15].
Usually, it is common to study breast cancer tumors as isolated entities, but its biological and molecular structure are indicative of an unstable heterogeneous disease with multiple subtypes coexisting within a tumor. These subtypes can be distinguished using phenotype or genotype characteristics of the tumor, like tumor stage, grade, and genetic profile. The main controversial question in cancer biology is whether genetic instability can be considered as a significant driver of cancer progression. In order to understand cellular physiology and predict their invasive behaviour, cell observable properties like morphology are used. Understanding the progression is key to developing future treatments to improve patient survival and major progress has been made to understand breast cancer development, however, the precise molecular dynamics underlying progression process are poorly understood due to the difficulty in obtaining longitudinal tissue samples at all tumor stages. They highlighted that in order to explore the molecular differences between distinct breast cancer stages there is need to separate pure populations of abnormal epithelial from different stages of tumor progression [16-18].
The main challenge in cancer research is the characterization of molecular events associated with progression. To understand the dynamic process we must identify the significant molecular events that are driving stepwise disease progression. Understanding early breast cancer molecular dynamics especially in non-invasive DCIS must provide new prospects to delay its progression and predict possible responses to treatment. Predicting the DCIS dynamics is key to understanding and delaying progression. Driver mutations confer clone growth advantage and initiate cancer progression while passenger mutations are assumed to be neutral, only cells with genetic and epigenetic alterations that favour tumor progression are selected [19,20].
Previous studies suggest that cancer progression is more complex than portrayed by traditional models through activation of oncogenes and deactivation tumor suppressor genes. Rapid developments in molecular profiles and genomic technologies have enabled the study of cancer genomes using excised tumor tissue samples. However, currently there are limited established progression models derived from human tumor tissue after the conceptual models. Yumei et al, pointed out that since cancer cells are derived from normal cells, it is unethical to delay treatment after diagnosis. We have to use static data from excised tissue samples though it is regarded as a snapshot of the dynamic process. Some researchers posed the question: Can we develop cancer progression models using static data? Sun et al, highlighted the possibility only when using advanced computational techniques [21-23].
Genomic instabilities accelerate tumorigenesis. Many genes governing important functions in the development of cancers have been identified, though the biological insight from the list of genes is still limited hence the underlying tumorigenesis mechanisms are not well established. Genes are classified as either oncogenes or tumor suppressor genes (TSGs) which gain or lose their function respectively. Oncogenes stimulate the programmed cell division in the presence of the relevant growth signals. TSGs stop growth in normal cells through apoptosis, when a cell is genetically damaged or when cell death is necessary for tissue homeostasis. Over expressed oncogenes and under expressed or inactivated TSGs can disrupt epithelial cell proliferation and apoptosis (tissue homeostasis), leading to cell over proliferation and tumorigenesis. Other genes can negatively regulate cell growth and proliferation and the retinoblastoma-associated protein (RB) and TP53 are key growth inhibitors. RB transduces extracellular growth inhibitory signals determining if the cell should continue proliferating. TP53 protein (the most mutated gene in human cancer), receives inputs from intracellular signals on genome damages, growth-promoting signals, glucose, or oxygenation levels. When these levels are suboptimal, TP53 stop the cell division cycle and initiate programmed cell death. Cells can die differently but the most common are apoptosis (programmed cell death) and necrosis (cell exploding). Common characteristic for cancer cells is their ability to escape from apoptosis through loss of TP53 tumor suppressor function hence most of them die through the genetic program necrosis [24,25].
To deeply understand breast cancer heterogeneity at molecular level gene expression profiling was done and it identified six intrinsic subtypes which are: luminal A, luminal B, HER2, triplenegative, claudin-low and normal-like with each molecular subtype exhibiting significant molecular heterogeneity. The first two subtypes, luminal A and luminal B are common, representing low to intermediate grade tumors. At most 25% of breast cancer cases are associated with mutations in the BRCA1 (BReast CAncer gene one), BRCA2 (BReast CAncer gene two) and TP53 genes. Everyone has BRCA1 and BRCA2 genes and they are responsible for repairing damaged cells and also help breast, ovarian, and other cells to continue growing normally. The transition from DCIS to IDC is associated with quantitative relationship mainly found in high-grade lesions regardless of tumor stage [26-28].
A risk factor is anything that affects an individual’s chance of getting a disease. Cancer arises from one single cell that transforms into a tumor cell through a multistage process due to interactions between genetic factors and the external agents. Some of the risk factors are beyond human control like being a woman is a significant risk factor for breast cancer since women are 100 times more likely to develop the disease than men. In addition to aging, external factors that include exposure to high radiations, and environmental features urge deregulation in the dynamics of the biological system, leading to tumor evolution. Approximately 30% of most cancer deaths are due to behavioral and dietary risks such as the use of tobacco, alcohol, obesity and decreased physical activities are some of the major cancer risk factors in today’s world. Chronic and viral infections such as HIV, Hepatitis B, and C virus are also risk factors for cancer as they had caused up to 70% of cancer deaths recorded in 2008 in low and middleincome countries. Approximately 5- 10 % of breast cancers are linked to inherited genetic mutation caused by the non-modifiable mutation in the BRCA1 or BRCA2 gene [29,30].
There are also other non-modifiable factors to increase breast cancer incidences, such as early menopause, parity, race, hormones, and immune conditions, family breast cancer history. Among the risk factors for breast cancer, family history is the most significant hence women’s risk of breast cancer development significantly increases if she has a first-degree relative with breast cancer. Here genetic factors are assumed to be the major causes of breast cancer [31].
Cancer is a complex biological process hence its research is becoming a multi-disciplinary area involving collaboration from experts in different scientific fields. Previously the dynamics of breast cancer has been difficult to study since most researchers were focussing on qualitative aspects of cancer biology. However the growing interest on dynamical aspects of the biological processes including genetic developments are leading researchers to focus more on integrating maths and biology. The proposed models give insights into the mechanisms of existing treatments and help formulate new therapies. Above helping to understand the mechanistic foundations of dynamical systems, mathematical models simulate complex systems without the massive costs of laboratory experiments [32,33].
Mathematical models for cancer development are constructed from the basics, starting with pieces that describe key aspects of the disease and then continuously add more complex features as additional building blocks. We introduce and review the main types of mathematical models that have been widely used to describe tumor growth. Mathematical theory has contributed a lot to cancer research: firstly in epidemiology, where available incident statistics is used to create cancer models that explain the observations. Armitage and Doll were the pioneers of this theoretical modelling approach, which was then taken to the next level by Moolgavkar and Knudson. Tumor growth was then studied using mechanistic modelling which is different from the first method as this includes multiscale modelling. In this method properties of biological tissues were used to describe tumor growth as highlighted by Cristini and Lowengrub. To understand the collective behaviour of cancer, that is initiation and progression of cancer as an evolution process, methods incorporating population and evolutionary dynamics were developed by Gatenby and Gawlinski and also Gatenby and Vincent. The number of models developed by mathematical theorists in the field of “mathematical oncology has been growing exponentially. Due to cancer complexities and cell heterogeneity it is not possible to develop a single model that can fully describe cancer development, hence models of cancer growth are much diversified. Computational and mathematical modeling techniques have been accepted by the biological community as means to motivate experimentation and as a route to integrate multiple experimental findings and generate testable predictions. The major strength of mathematical modeling in breast cancer progression is its ability to capture the dynamic nature of the disease. Early molecular studies of invasive ductal carcinoma (IDC) looked on the relationship of tumor genomic variations with tumor grade, and this significantly contributed to understanding breast cancer progression [34-36].
Biological experiments are expensive, time consuming and ethically challenging, so mathematical models provide an alternative way through experiment-free check of assumption consistency, before experimental work. The power of quantitative models depends on its ability to integrate experimental data forming comprehensive framework, which can be used to predict the dynamics of a system. Mathematical models are mechanistic, they focus on the core processes driving tumor growth and integrating them to enable holistic predictions. Other models are classified as stochastic as they try to represent unpredictable processes, such as diffusion, that are random in nature [37].
Discrete models can trace individual cell behaviour as they interact with other cells and the microenvironment hence they are most suited for improving our understanding of cancer progression at cell level. Dynamic events like mutations, phenotypic properties are considered under discrete models. This modelling method led to the development “multiscale models”, where intracellular events are modelled using ordinary differential equations. These models have been modified to include the effects of blood flow within the capillaries that includes vascular tumor growth. Discrete models can be classified as lattice-based and lattice-free models. Lattice-based models are in different classes like lattice gas cellular automata (LGCA), cellular automata (CA), and cellular potts models (CPMs) while the lattice free models can be classified as agent based models which can be approximated using stochastic models and finite-difference approximation methods [38,39].
These are models based on a spatial grid, where the dynamics are defined by some local rules (deterministic or stochastic) of interaction among neighbouring nodes. A cellular automaton model of tumor angiogenesis that was designed by Anderson and Chaplain adopted a discrete dynamical system of time and space. The movement rules between states are based directly on a discretized form of the continuous model. They used Euler finite difference approximation to the PDEs in the discretization process. This approach has been widely used to develop models that rely on discrete and hybrid approaches as the cellular potts model proposed by Hallou et al. and cellular automata models Enderling et al [40].
These models are ideal for situations of non-uniformly arranged cells, like in angiogenesis, carcinogenesis, and metastasis. The major objective is to develop a mechanistic model that explain cell behaviour. Agent-based models include components from two or more spatial or temporal scales, ranging from molecular to tissue, and the cellular. These models are most suitable when studying cell interactions and their implications on populationscale development [41].
Continuous models capture through simulation large scale volumetric tumor dynamics with one or more differential equations, which are used to calculate the amount of change. Continuous tumor models are mainly based on partial differential equations such as the reaction diffusion equations that describe tumor cell population density and evolution, the extracellular matrix (ECM), and concentrations changes for nutrients, oxygen, and other growth factors and inhibitors. Differential equations are also used to explore therapeutic antibody distribution in tumors as well as to model tumor dynamics and interactions where growth is modelled as a function of cell oxygen concentration. The continuous models can explain the nutrient diffusion dynamics, tumor evolution and cell apoptosis as well as the effects of chemotherapies [42].
Different interactions with the microenvironment have been studied and these have some limitations on growth. Tumor growth can be divided into three categories that are associated with increasing degree of vascularization: low (diffusion dominated), moderate, and high. If tumor evolution is unstable it leads to invasive fingering and topological transitions hence Cristini and Lowengrub, concluded that instability during growth can allow tumors to grow indefinitely. Mathematical models show that the parameters that control tumor mass and shape, control its invasion ability, therefore tumor morphology may serve as an invasiveness predictor. Non-necrotic tumor evolution could be described by two dimensionless parameters, one describing the rate of mitosis (cell mobility and cell-cell interaction) and the other describing the balance between apoptosis and mitosis. These parameters regulate the growth (invasiveness) and morphology of tumors. The earliest continuum models developed by Greenspan expressed tumor growth as a function of the diffusion of cell substrates (oxygen, nutrients etc.) and this accounted for apoptosis and was further developed to incorporate immune response as discussed by Cristini and Lowengrub [43-45].
These are modern approaches to tumor modeling that are constantly being developed by several groups, through combining different modelling tools and methodologies. The continuum and discrete approaches provide important insights of cancer related processes that occur at particular length and time scales, but the complexity of cancer and the associated cell and tissue interactions need a hybrid approach that uses both continuum and discrete approaches. This modelling approach typically incorporate the continuum model for nutrient concentration evolution and the cellular automata (discrete) model for cell dynamics to explain nutrient uptake and cell proliferation dynamics. Classically hybrid models refers to the connection of discrete description of cells with continuous descriptions of microenvironmental factors. Anderson, Rejniak and Anderson and Sfakianakis et al. developed a hybrid model of solid tumour invasion focussing on how growing tumor geometry is affected by mutation. The model focuses on: tumor cells, extracellular matrix (ECM), matrix-degradative enzymes (MDE), and oxygen as its variables and they discovered that local tumour cell and ECM interactions control tumor geometry not the cell to cell interactions. Jiang et al, developed a hybrid model that inspects tumor at three different stages that is: cell scale dynamics (proliferation, survival, adhesion) and they used the Potts model at this scale taking the tumor microenvironment (nutrients, oxygen, drugs, growth /growth inhibitor hormones) into consideration, the extra cellular level that describes the chemical dynamics of the cell (nutrient, waste, growth promoter, and inhibitor concentrations). was modelled using diffusion equations (PDEs) and the molecular scale (genetic dynamics) described using Boolean networks. Overally many researchers found out that cell-cell interaction and haptotaxis are the major drivers of tumour growth [46,47].
We aim to discuss and review main types of mathematical theories commonly used when describing tumor growth. When we study tumor growth dynamics usually we will be studying the tumor volume dynamics. The earliest mathematical model in medicine was developed by Bernoulli, to investigate immunization effectiveness against smallpox. Kermack and McKendrick developed the most popular Susceptible-Infective-Recovered (S-I-R) model to explain the dynamics of communicable diseases. The S-I-R model lead to the development of other related modeling frameworks including the Susceptible-Exposed- Infected-Recovered (S-E-I-R) and Susceptible-Infected-Recovered-Susceptible (S-I-R-S) modeling frameworks which can be used to model current disease outbreaks. Mathematical modelling has been extremely used in understanding disease dynamics on the sub-cellular, cellular, and tissue levels. Mathematical models mainly focus on general laws that describe tumor growth dynamics [48].
Cancer is viewed as a population of cells that evolve deterministically with growth potential and many researches used ordinary differential equations (ODEs) to describe the growth dynamics. This is mainly used when longitudinal scalar data is used to describe tumor dynamics based on the rate of mass balance. Natural tumor growth is characterized by several basic functions that includes the linear, exponential, logistic, Gompertz, and a combination of exponential and linear models. The linear model has the form:

Where Kg is the tumor regrowth rate. The linear tumor growth has been applied by Stein et al (2012) to describe natural tumor dynamics of renal cell carcinoma using the longest diameters of target lesions. They based their findings on a constant zero-order growth rate. If we incorporate the shrinkage (death) rate, then we have a model with a linear growth and first-order shrinkage.
Yin et al, used this equation to describe tumor growth dynamics for advanced solid malignancies based on SLD measurements. ODEs are not able to describe any form of interaction hence they lack detail in their simplicity. The application of ODEs to large systems with no extinction effects is also limited since they cannot cater for stochastic dynamics. There has been an increased need to consider models that incorporate tumor heterogeneity and mutations and these have been developed for tumor dynamics characterization as described by Yin et al, and Stura et al. Mufudza et al, used delay differential equations to model the interaction of breast cancer cells with the immune system. To predict breast cancer risk in women using age at menarche, age at first live birth, number of first-degree relatives with breast cancer and number of breast biopsies, the Gail model was developed. ODE based models like the Gompertz model have been used to predict tumor volume dynamics and other deterministic models based on ODEs have been developed to explain the secondary tumor development [49].
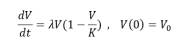
Researchers believed that tumor growth was governed by an exponential process (Laird, 1964), resulting from constant proliferation and growth rate, hence it naturally describes the early stages of cancer growth. This tumor growth model was developed by Malthus (1766-1834) and the tumor cell growth in exponential model is assumed to be proportional to the population of the cancer. Claret et al developed the tumor growth inhibition model for colorectal cancer using the exponential growth modelling approach. The volume dynamics can be explained by the following ODE:
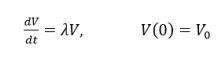
Where λ is the effective growth rate and V0 is the initial tumor volume Yin et al (2019) introduced a shrinkage term to describe necrosis using the combined linear and exponential growth models. If we then consider the Malthus assumption and from a population dynamics point of view the equation becomes:
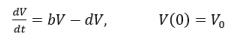
Where b is the number of new cells per unit time and d is the shrinkage rate that is the proportion of dying cells per unit of time. The effective growth rate λ = b - d is positive in a growing population and the greater the growth rate the faster the tumor grows while negative growth rate leads to a monotonic decrease in tumor size. The parameter is used to describe the
relationship between tumor growth rate and the tumor doubling time T. Exponential growth has been observed in vitro for 2D monolayer cell cultures, although other studies show different patterns of growth for pulmonary metastases. The same modelling approach was adopted to describe changes of prostate cancer burden reflected by the level of prostate-specific antigen [50].
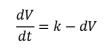
The exponential growth modelling approach is generally used for tumor growth during avascular and early vascular growth where proliferation and apoptosis are assumed constant. As tumor population increases, proliferation decreases hence rendering this approach inadequate over long time periods. The imbalance between proliferation and apoptosis is due to increased competition for limited amounts of oxygen and nutrients available which later causes proliferation rate to decrease as a function of population size while the death rate increases. If there exists a point where these two rates are equal (dynamics equilibrium point) it is called the carrying capacity. However, the exponential growth law cannot explain solid tumor dynamics over a long period of time as it has limited descriptive power in vivo (breast and lung cell lines). Mayneord discovered that the overall growth of tumors slows down in the latter stages of their development. Due to the slowing growth in the late stages of cancer, other researchers proposed a variation on the equation for exponential growth, making the power-law growth, which is the generalization of exponential growth. Other researchers like Benzekry et al, combined the exponential and linear approaches to have the exponential-linear approach which assumes an initial exponential phase followed by a linear growth phase giving the following Cauchy problem for the growth rate:
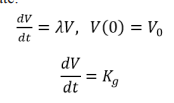
Where λ is the proliferative rate and coefficient Kg drives the linear phase.
Tumor growth is always complemented by new blood vessel growth (angiogenesis). Tumors grow slowly in the late stages of cancer and to grow beyond a diameter of 3 millimeters angiogenesis is required. Angiogenesis enables tumors to form their own vasculature for increased nutrients supply. The power model was introduced by Dethlefsen et al, and it assumes that cells within the vasculature proliferate. The power law describes the tumor volume dynamics using the differential equation:
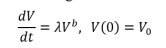
This model shows that the rate of change in tumor volume is proportional to volume to the power of and giving a simple description of the 2 parameters vascular growth [51].
The Gompertz model can reproduce biological growth dynamics that decrease with population size. It was introduced by Benjamin Gompertz in 1825 to describe the human mortality curve, and was further employed to describe the late stage tumour growth data with the assumption that the tumor volume grows with an exponentially decreasing growth rate. Murray and Frenzen created a model to monitor cell populations using the Gompertz equation via cell doubling time and growth patterns correlations. The Gompertzian growth law is able to fully explain growth dynamics for large tumor volumes, but inadequate for small tumor volumes. The model is written as:
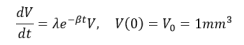
Where λ is the proliferation rate, β is exponential decay rate. The analytical solution for tumor volume from the Gompertz model is then given by:
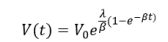
The tumor volume converges to the maximum carrying capacity supported by vascular supply which is given by
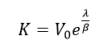
This model can describe tumor growth with good predictive power. The Gompertz model became a widely-accepted representation of tumor growth in particular as it was used by Norton to describe breast cancer dynamics. Michor et al, illustrated the importance of mathematical models in clinical studies by proposing a model describing the dynamics of several cell populations of chronic leukaemia. The main important characteristic of the Gompertz model is that it exhibits exponential decay of the relative growth rate [52].
Logistic equations were initially proposed by Verhulst in 1883, then forgotten until resuscitated by Pearl and Reed, who used this approach to model population growth in ecology and later applied to tumor growth. Systems similar to ecology’s predator- prey systems were also used to study the dynamics of cancerous cells Gatenby and Vincent. To describe the effects of limited resources on tumor growth, Verhulst proposed a competition model where birth rate is decreasing and death rate is increasing as function of tumor volume. This approach is based on competition (for nutrients, oxygen and space) between proliferation and death processes, assuming the rate of reproduction is proportional to current population and the amount of available resources. Solid tumors rapidly grow in their initial stages and then exhibits growth saturation when tumor volume turns to reach the maximum carrying capacity. This can be illustrated by the logistic differential equation:
where the parameter V is the tumor volume (can also be measured in terms of number of cancer cells, density of cells, etc.) , K is a carrying capacity, the parameter λ is the growth rate and λv2/k.
represents some cells competing for resources and space. These equations can be modified to incorporate mutations as introduced by Eigen. Vaidya used the logistic model to describe tumor growth and its analytical solution has been widely used to describe the dynamics of bacteria population in ecology, and now is being employed to describe tumor growth. Since tumors grow according to a monotonous growth model, Westvik et al, used the following generalised logistic growth curve with tumor diameter to estimate breast tumor growth:
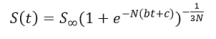
Where S is the expected maximum tumor diameter in this case they assumed it to be 128 mm, b the tumor growth rate approximated from the lognormal distribution N = 1/4 , and is chosen such that the initial tumor size is 2 mm. The tumor carrying capacity determines the maximum tumor size that can be supported by vascular supply as Hahnfeldt et al, derived through diffusion-consumption arguments that vasculature inhibition can be explained using the function (tumor volume)2/s . The changes in maximum carrying capacity can be expressed
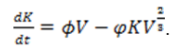
Where ? and φ are constant positive rates of angiogenesis stimulation and inhibition respectively. This was used by Enderling and Chaplain, to show that tumor growth is increased with abundant stimulation and as the tumor grows the inhibitory effects will overshadow the stimulator. Mutations give rise to different cell variants that often compete for resources (space, growth factors, and nutrients). Logistic growth was extended to explain competition dynamics between cell variants that share the same space, with maximum carrying capacity, only differing in their proliferation rates [53].
Mathematical models similar to the Lotka-Volterra competition models were developed to model immune response to tumor growth which explains the interaction between tumor and immune cells. When we compare the growing pattern of the different growth models described above, the logistic and Gompertz growth models accurately estimate the growth rate as the tumor increases though the logistic growth model has carrying capacity as its limitation to growth whereas the Gompertz model assumes that tumor growth rate decreases over time [54].
The tumor is small and self-sufficient during the cancer initial stages, it can acquire nutrients without angiogenesis. Its growth and spread can be estimated using simple models since there is no competition for space and nutrients. Cancer becomes life threatening when primary tumors invade local tissues and metastasise to distant sites forming secondary tumors. Cancer invasion and metastatic spread are two crucial and inherently spatial processes, which can be simulated using partial differential equations (PDEs) which considers change of dependent variable in time and space. PDEs have been described as a tool of choice when studying tumor growth and metastasis. They are more powerful than ODEs, as it allows dynamic description of continuous spatial variations in the system. The first cancer invasion spatial model developed by Gatenby and Gawlinski, considered effects of excess hydrogen ions in degrading the extra cellular matrix hence permitting cancer cells to diffuse and proliferate. The following system of PDEs was used to model the evolution of cancer cells, c, hydrogen ions, m, and extracellular matrix, v:
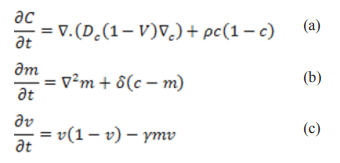
Where Dc , p, δ, γ are constants representing: diffusion, cancer cell proliferation rate, hydrogen ions production rate (similar to the decay rate) and extracellular matrix degradation rate respectively. In equation (a) evolution of cells was explained by nonlinear diffusion plus cell logistic growth. Diffusion and net growth explain the hydrogen ion changes in (b) while the difference between logistic growth and degradation explains extracellular matrix changes in (c).
The first model that considered random motility, haptotaxis and chemotaxis for interactive invasive cancer cells was developed by Perumpanani et al, in 1996. This model incorporated possible interactions with matrix degrading enzymes (MDEs), extracellular matrix proteins (ECM), normal cells and other non-invasive cancer cells to examine the rate at which cancer cells invade the ECM in the presence of haptotaxis and chemotaxis [55,56].
One common application of the PDEs is the proliferation-invasion (reaction-diffusion) model which accurately capture proliferating tumor core, assuming that the net proliferation and invasion contribute to cancer growth and is of the form:
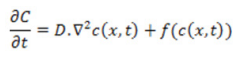
Where C is the quadratic growth term, c(x,t) is the tumor cell concentration or density, ?2 is the Laplace operator and D is the diffusion coefficient. Tumor proliferation can be expressed by exponential, logistic, or Gompertz functions. In this model the velocity of tumor growth is a constant determined by the diffusion coefficient and growth rate constant. Researchers applied the proliferation-invasion model to describe tumor dynamics with interest in estimating the rate constants of net proliferation and invasion, which was described by a logistic function with constant growth rate. Le et al, used this model structure to investigate the personalization of radiotherapy strategy for brain cancer patients. Likewise, Yankeelov, used the same proliferation-invasion model with logistic growth function to describe and predict tumor dynamics in breast cancer. To estimate prostate cancer evolution dynamics and treatment using immunotherapy Jackson formulated a PDE model with cancer cells that are androgen independent and androgen dependent. After Jackson’s paper, many researchers later considered variations on the model to explore further dynamics.Many applications of the proliferation- invasion model can be found in Meghdadi et al. One of the most cited models focussing on haptotaxis is the continuum PDE by Anderson et al., it extended modelling to a 2D setting and later in 2016 Rutter extended to 3D setting while using spheroids to model brain cancer. Armstrong et al., modelled non-local interactions in the PDE model inclusive of cell-cell adhesion in interacting cell populations. Many researchers then based their models on Armstrong et al’s findings by providing computational simulations demonstrating general effects of cell-cell and cell-matrix adhesion on tumor growth and progression. Anderson developed the PDE model of tumor invasion based on a vascularised generic solid tumor growth focussing on four main variables namely: tumour cell density, MDE concentration, macromolecule concentration and oxygen concentration. The complete set of PDEs describing the interactions of the four variables were derived and was used by Enderling et al, when they looked at breast cancer development, treatment and recurrence [57].
Other researchers like Barbolos et al, and Benzekry used the hyperbolic PDE model by Iwata et al, for the metastasis of natural colon tumours. Benzekry used the Iwata model to explain metastasis density and the ODE model by Hahnfeldt et al, accounted for tumour growth. Benzekry et al, used the hyperbolic PDEs by Iwata to relate presurgical primary tumour volume and post-surgical metastatic burden. The dynamics of epithelial and mesenchymal cancer cell density as described by Franssen et al, is governed by the diffusion-haptotaxis equation:
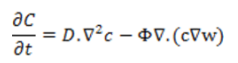
Where the first term on the right side of the PDE is for diffusion and the second term is for haptotaxis. D and Φ are positive coefficients for cancer cell diffusion and haptotactic sensitivity respectively and w is the ECM density. This model was achieved by expanding the modelling approach of Anderson and Chaplain and Anderson et al.
Stochastic modeling arises since many biological characteristics are random with general trends that can be deduced hence we are not able to predict the exact state of the system at any given time. Stochastic processes have been used to understand mutation accumulation in cancer studies so it is central in cancer progression. Stochastic processes has been applied previously to cancer studies in different forms like the branching process, birth and death process and the Moran process. Cell division is viewed as a branching process, where at regular occasions, each cell divides into two identical cells. In the Moran process whenever a cell reproduces, another cell is chosen to die to keep a constant population size. The branching process is commonly used to model cancer evolution while the Moran process models stochastic dynamics in a constant population. Models of metastatic dynamics include: fully stochastic mechanistic models by Bartoszynski et al, and Hanin et al, who based their work on Iwata et al. In other stochastic model by Haeno and Michor (2010); and time branching models by Iwasa et al, and Haeno et al, studied the effects of treatment choice and the dynamics of at most two mutations in suppressor genes to investigate the probability of tumour becoming resistant to therapy. Stochastic modelling have been applied to investigate breast cancer and tumor growth in Mufudza et al.
Stochastic models have been used in studying the metastatic process of cell scale events. Michor et al, used the Moran process of the stochastic models to simulate Darwinian competition between tumor cells. They assumed that one mutation is key to acquiring the metastatic potential which can be of advantage or disadvantage to tumor growth [58].
Multiscale models which uses ODEs to model intracellular events were developed through discrete models. Multiscale modelling generally uses continuous, discrete and hybrid approaches. Continuous approaches use PDEs to describe the tumor dynamics like tumor cell density as a function of space and time and other complex physical phenomena such as pressure gradients and convective transport within the tumor. Some authors concur that traditional growth laws (e.g. exponential, logistic, Gompertz) are mostly fit to describe tumor growth averages, not valid for individual tumors hence they used the multistage carcinogenesis theory to develop multi step models that forecast a multi-step pattern. There is need for models that can use ODEs to describe tumor growth patterns exploring angiogenesis, apoptosis and genetic instability.
Tumor growth models incorporating biological factors and processes like angiogenesis and other immune system components dynamics have been developed. To apply these methods, we need the understanding relating to the biological processes on top of tumor burden measurements. By incorporating angiogenesis biomarkers in tumor growth modeling we improve our understanding and prediction of tumor progression. The exponential model described the natural growth of the tumor and relative change in the biomarker’s amount was predicted to affect necrosis. Tumor growth can be described using the exponential-linear model, and the amount of unbound vascular endothelial growth factor (VEGF) was considered to affect a firstorder tumor shrinkage. The tumor carrying capacity is assumed to be determined by the effective tumor vascular support which in turn is affected by tumor volume, then the Logistic and Gompertz models can be applied as in Ouerdani et al. Other modeling studies mainly focused on the tumor microenvironment dynamics like extracellular matrix (ECM) or nutrients concentration. Anderson et al. investigated the effect of ECM heterogeneity and hypoxia on cancer cells using a hybrid agent-based model and they discovered that strict microenvironmental conditions exert selective pressure on the cancer cells, resulting in more invasive tumors [59].
There are different models for different cancer types that characterize tumor dynamics and require different data input and knowledge. Most models can describe tumor size changes in patients under different treatment options for instance models developed for prostate cancer are mainly proper to describe prostate-specific antigen (PSA) level change. Among the functions of the natural tumor growth, the exponential growth model has been the most frequently selected in clinical studies. To find the best fit natural growth model at least one pretreatment tumor size measurement would be helpful and this will enable a more accurate estimate of the natural tumor growth rate. The proliferation- invasion model displayed by PDE has been applied to examine glioblastoma (breast cancer) using magnetic resonance images (MRI) measurements. Models displayed by ODEs, algebraic equations, and PDEs are mainly used to model change in tumor size and, in case of prostate cancer, PSA amount change. Most complex tumor dynamics models in mathematical oncology are based on the traditional types and assumptions of basic growth laws.