Enhancement of Aqueous Solubility and Dissolution Profile of Atorvastatin Calcium: In vitro Evaluation of Solid Dispersion
© 2021 Pawar AR, Agale KB, Unde O V, Shete NA, Deshmukh VK, et al, et al. This is an open-access article distributed under the terms of the Creative Commons Attribution License, which permits unrestricted use, distribution, and reproduction in any medium, provided the original author and source are credited.
Abstract
Purpose: The objective of the present study was to formulate solid dispersions (SD) of Atorvastatin calcium to improve the aqueous solubility and dissolution rate to facilitate faster onset of action. Atorvastatin calcium is a lipid lowering agent belonging to BCS-II having low solubility and high permeability.
Methods: In the present study, Solid Dispersions of Atorvastatin calcium was prepared by Kneading and Solvent evaporation method with different polymers. SD’s were characterized by % practical yield, drug content, Solubility, FT-IR, DSC (differential scanning calorimetry), PXRD (Powder X- ray diffractometry), SEM (Scanning electron microscopy), in vitro dissolution studies and Stability studies.
Results: The percent drug release of prepared solid dispersion of ATC by kneading method (KMP4 and KMG5) in 1:4 and 1:5 ratios was found 73.00+0.24 and 63.00+0.46 respectively. The percent drug release of solid dispersion of ATC by solvent evaporation method (SEP2 and SEG3) in 1:2 and 1:3 ratios was found 82.80+0.35 and 77.56+0.45 respectively. DSC studies revealed that there was no interaction between drug and carrier where as the PXRD demonstrated that there was a significant decrease in crystallinity of pure drug present in the solid dispersions, which resulted in an increased aqueous solubility and dissolution rate of Atorvastatin calcium.
Conclusion: The significant increase in aqueous solubility and dissolution rate of Atorvastatin was observed in solid dispersion as the crystallinity of the drug decreased after addition of P188 and Guar Gum.
Introduction
One of the challenging tasks in manufacturing process is to improve the bioavailability of poorly water-soluble drugs. This is because in recent years, many new active agents possess weak water solubility. Hence, their oral administration becomes quiet inconceivable. Some other conventional methods used to improve aqueous solubility and bioavailability is use of surfactant, pH modification, co-solvent and hydrotroph formation etc [1].
The Solid Dispersion can be defined as “Dispersion of one or more active ingredients in an inert carrier matrix at solid-state prepared by the melting, solvent or melting-solvent method, suggesting the definition as being a “product formed by converting a fluid drug-carrier combination to the solid state”[2].
Solid dispersions can be prepared by formulating supersaturated systems of the drug employing various types of carriers, ranging widely from water soluble to ampiphillic and lipid soluble ones.
Thus we can have appropriate size reduction in drug particles whilst with the carrier molecules, thus enhancing the dissolution of the drug [3].
Initially, formulation of Solid Dispersions by Fusion Method was discovered by Sekiguchi and Obi in 1961 [4]. Subsequently Levy and Kanig worked on numerous drugs using mannitol, this was followed by Tachibana and Nakamura’s work using dispersed β-carotene in a water soluble polymer (Polyvinylpyrollidone) to formulate a Solid Dispersion System using Solvent Evaporation Method. They then dissolved both the chemicals in common solvent and finally completely evaporated the solvent. To elaborate the intricacies further, in this method the drug & carrier is dissolved in a volatile organic solvent with the help of magnetic stirrer to get a clear solution and solvent is removed at room temperature, obtained mass is dried in desiccators over anhydrous calcium chloride for 1-2 days depending on the removal rate of solvent at room temperature. The product is crushed, pulverized & sieved through a suitable mesh number sieve. The main advantage of the solvent method is thermal decomposition of drugs or carriers can be prevented [5].
The Kneading Method involves the process of mixing accurately weighed drug and the carrier and wetting them with solvent and kneaded thoroughly for some time in glass mortar. Here the kneading was done with Poloxamer-188. It is a non-ionic linear copolymer having average molecular weight of 8400 Daltons. Hence is quiet useful as a surfactant for Kneading Method. It is composed of two hydrophilic side-chains attached to a hydrophobic core [6]. Atorvastatin is a HMG-CoA reductase inhibitor, used as an antihyperlipidaemic. Whilst administration is done via oral route, absolute bioavailability of Atorvastatin (parent drug) is approximately 14% and the systemic availability of HMG-CoA reductase inhibitory activity is approximately 30%. The low systemic availability is attributed to pre-systemic clearance in gastrointestinal mucosa and/or hepatic first-pass metabolism as well as its poor water solubility. Here, the Poloxamer 188 is used as the carrier in Kneading Method for the reasons indicated above. In this present study, the attempt to improve the aqueous solubility and dissolution rate of Atorvastatin calcium was made by solvent evaporation and kneading technique using Poloxamer 188 and Guar Gum as a carrier, in turn improving its bioavailability.
Materials
Atorvastatin calcium was received as gift sample from Atra Pharma Pvt Ltd, Aurangabad. Poloxamer 188, Guar gum, Methanol, Hydrochloric acid were purchased from LobaChem Pvt. Ltd, Mumbai. The disodium hydrogen phosphate and potassium dihydrogen phosphate were obtained from SD Fine Chem limited, Mumbai, India. All other chemicals were used of analytical grades.
Methods
Preparation of Solid Dispersion by Kneading Method Atorvastatin calcium (ATC) and excipients were weighed accurately in various ratios (1:1, 1:2, 1:3, 1:4, 1:5) and mixed using small amount of methanol in a pestle and mortar and sieved through a 100 μm mesh. These solid dispersions were used for further investigations.
Preparation of Solid Dispersion by Solvent Evaporation method
Atorvastatin calcium and excipients were weighed accurately in various ratios (1:1, 1:2, 1:3, 1:4, 1:5) and transferred to china dish containing sufficient quantity of methanol to dissolve. Methanol was evaporated on heating mantle at 400C. The resulting solid dispersions were stored for 24 hrs in desiccators. The mass obtained was crushed, pulverized. Finally, dispersions were sieved through a 100 μm mesh and were used for further investigations.
Table 1: Formulation of solid dispersion
|
Sr. No. |
Polymer |
Ratio |
Method |
Formulation code |
|
1 |
|
1:1 |
|
KMP1 |
|
2 |
P 188 |
1:2 |
Kneading |
KMP2 |
|
3 |
|
1:3 |
Method |
KMP3 |
|
4 |
|
1:4 |
|
KMP4 |
|
5 |
|
1:5 |
|
KMP5 |
|
6 |
|
1:1 |
|
KMG1 |
|
7 |
Guar Gum |
1:2 |
Kneading |
KMG2 |
|
8 |
|
1:3 |
Method |
KMG3 |
|
9 |
|
1:4 |
|
KMG4 |
|
10 |
|
1:5 |
|
KMG5 |
|
11 |
|
1:1 |
|
SEP1 |
|
12 |
P 188 |
1:2 |
Solvent |
SEP2 |
|
13 |
|
1:3 |
Evaporation |
SEP3 |
|
14 |
|
1:4 |
Method |
SEP4 |
|
15 |
|
1:5 |
|
SEP5 |
|
16 |
|
1:1 |
|
SEG1 |
|
17 |
Guar Gum |
1:2 |
Solvent |
SEG2 |
|
18 |
|
1:3 |
Evaporation |
SEG3 |
|
19 |
|
1:4 |
Method |
SEG4 |
|
20 |
|
1:5 |
|
SEG5 |
Evaluation of Solid Dispersions Preformulation studies
In the preformulation study of drug, λ-max of ATC was found at 242 nm. Similarly Partition coefficient of ATC was found to be 5.7 by shake flask method, which indicates that ATC is lipophilic. So it can pass cell membrane easily once it got solubilized.
Percent Practical Yield
Percentage practical yield was calculated to know about percent yield or efficiency of method, thus it helps in selection of appropriate method for production. SDs were separately collected and weighed to determine practical yield from the following equation

Solubility studies
The solubility of drug is a very important physicochemical property because it directly affects the rate of drug release from formulation into the dissolution medium, bioavailability of the drug and consequently the therapeutic efficacy of the pharmaceutical product.
Solubility of drug and solid dispersions
An excess quantity of drug and solid dispersions was added separately to 5 ml distilled water in a volumetric flask with cap. The volumetric flasks were kept in a shaker at 37±0.5°C for 48 hours. The solutions were filtered through 0.45 μm Millipore filter and the filtrate was analyzed spectrophotometrically at 242 nm.
Fourier Transform Infra Red (FTIR) Spectroscopy
Infrared studies was carried out to rule out interaction between drug and carrier used in formulation of solid dispersion by potassium bromide disc method using Infra red spectrophotometer. The scanning range was 500 to 4000cm-1 [7].
Differential Scanning Calorimetry (DSC)
Differential Scanning Calorimetry was performed to obtain suitable thermogram, using METTLER Toledo India Pvt. Ltd. The accurately weighed sample was placed in an aluminium pan and an empty aluminium pan was used as reference. The experiment was performed under Nitrogen flow, at a scanning rate 300C/min. in range of 50-3000C, whilst retaining the inert atmosphere [8].
Powder X-ray diffraction (PXRD)
As a consequence of the importance of solid drug substance characterization, analytical tools such as X-ray diffractometry are usually employed in the pharmaceutical field. The detection of crystalline phases in mixed systems can be analyzed by powder X-ray diffraction. However, too much crystallinity causes brittleness and can decrease the solubility of the drug. The crystallinity parts give sharp narrow diffraction peaks and the amorphous component gives a very broad peak. The ratio between these intensities can be used to calculate the amount of crystallinity in the material [9,10].
Scanning electron microscopy (SEM)
Scanning electron microscopy (SEM) analyzed with 2 mg of pure drug and the solid dispersions were mounted on to the stubs using double sided adhesive tape and then coated with gold palladium alloy using fine coat ion sputter. The samples were subsequently analyzed under the scanning electron microscopy [11].
Dissolution Studies
Dissolution studies are the most significant evaluation parameter for any solid dosage form. Dissolution study was carried out to determine the rate and extent of dissolution. The dissolution study of drug and solid dispersions was performed separately in 900ml Phosphate buffer pH 6.8 at 37ºC+0.5ºC using the USP- I Basket Type apparatus at 50 rpm. Aliquots of 10 ml from the dissolution medium were withdrawn at 5 min time interval and rep7lenished by an equal volume of fresh dissolution medium. The samples were filtered through what man filter paper and analyzed by UV visible Spectrophotometer by measuring absorbance at 242 n [12].
Stability study
The selected solid dispersions were stored in desiccators at 400C for 3 month and observed for the drug content at 1, 2, 3 months interval. The drug content was determined at the end of study.
Results and Discussion Solubility Studies
Solubility data indicated that 188.7 μg/ml of pure ATC was soluble in distilled water; hence they are considered as poorly water soluble drugs. Here the solubility data of kneading method containing ATC and polymers is shown in Table 2. The solubility of ATC in solid dispersion prepared by solvent evaporation method also studied and the data for the same is depicted in Table 2. As compared to pure and kneading method, the solid dispersion prepared by solvent evaporation showed highest solubility 597.3 μg/ml in distilled water. This investigation suggested that, it might be possible due to preparation of solid dispersion using varying concentration of P 188 and Guar Gum which formed eutectic mixture and hence increase aqueous solubility of ATC.
Table 2: % Practical Yield, Solubility and % Drug content of Formulation
|
Sr. No. |
Formulation code |
Ratio |
Method |
% Practical Yield* |
Solubility* (μg/ml) |
% Drug content* |
|
1 |
KMP1 |
1:1 |
P 188 |
93.5±1.3 |
432±1.1 |
87.02±2.6 |
|
2 |
KMP2 |
1:2 |
Kneading |
96±1.5 |
461±1.4 |
90.54±1.5 |
|
3 |
KMP3 |
1:3 |
Method |
94±1.6 |
340±1.8 |
91.55±1.2 |
|
4 |
KMP4 |
1:4 |
|
95±1.8 |
360.2±1.2 |
92.64±1.9 |
|
5 |
KMP5 |
1:5 |
|
97±2.1 |
325±1.5 |
85.73±1.3 |
|
6 |
KMG1 |
1:1 |
GG |
86.5±2.6 |
183±2.3 |
91.77±2.0 |
|
7 |
KMG2 |
1:2 |
Kneading |
88±1.9 |
188±2.5 |
86.47±1.1 |
|
8 |
KMG3 |
1:3 |
Method |
90.5±1.2 |
152±2.1 |
88.93±1.6 |
|
9 |
KMG4 |
1:4 |
|
93±2.5 |
277±1.2 |
90.31±1.8 |
|
10 |
KMG5 |
1:5 |
|
93.6±1.5 |
326±1.7 |
91.01±2.5 |
|
11 |
SEP1 |
1:1 |
P 188 |
88.5±1.3 |
332±1.5 |
91.34±2.3 |
|
12 |
SEP2 |
1:2 |
Solvent |
94.48±1.6 |
597.3±1.1 |
95.04±1.2 |
|
13 |
SEP3 |
1:3 |
Evapo |
96.5±1.9 |
432±2.2 |
101.9±1.9 |
|
14 |
SEP4 |
1:4 |
ration |
92.66±2.3 |
340±2.3 |
83.12±1.7 |
|
15 |
SEP5 |
1:5 |
Method |
94.66±1.4 |
461±1.1 |
82.09±2.1 |
|
16 |
SEG1 |
1:1 |
GG |
89±1.8 |
375±1.9 |
86.9±2.4 |
|
17 |
SEG2 |
1:2 |
Solvent |
88±1.5 |
439±1.8 |
90.06±2.2 |
|
18 |
SEG3 |
1:3 |
Evapo |
93.5±1.3 |
499±2.3 |
94.29±3.0 |
|
19 |
SEG4 |
1:4 |
ration |
94.4±1.2 |
434±1.6 |
85.03±1.7 |
|
20 |
SEG5 |
1:5 |
Method |
90.66±2.1 |
384±2.5 |
105.1±1.5 |
*All values are expressed as mean±SD, n=3.
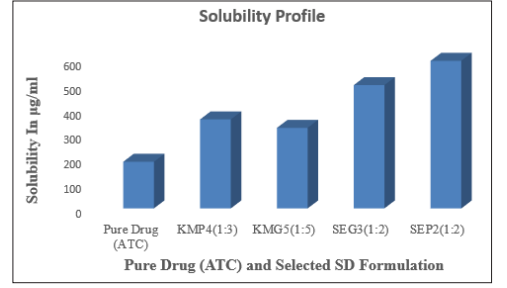
Figure 1: Solubility of pure drug (ATC) and selected SD formulation
Percent Practical Yield
ATC solid dispersion by kneading method with P 188 and Guar Gum had a yield of 95 and 93.6 % for the ATC: P 188 and ATC: Guar Gum combination ratios of 1:4 and 1:5 (KMP4 and KMG5) respectively. The yield recorded for ATC: P 188 and ATC: Guar Gum solid dispersions at ratios of 1:2, and 1:3 were 94.48 and 93.5 % (SEP2 and SEG3) respectively. It has been found that there is no significant drug or polymer loss during the solvent evaporation as well as kneading method.
Fourier Transform Infra Red (FTIR) Spectroscopy
Infra-red spectrum of ATC is shown in Figure 2. The characteristic peaks of functional groups presents in the drugs were checked and depicted in Table 03. The functional groups present in the structure of ATC were identified correctly and hence the drugs was confirmed and considered for further uses.
The FTIR spectra of pure ATC displayed bands at 842,810,746 cm- 1 due to Ar-sub, at 1579, 1551, 1510, 1435 cm-1 due to Ar –C=C stretching, at 1216cm-1 due to C-F stretching. The spectra also showed bands at 1116, 1650 cm-1 due to C=O bending, at 1317 cm-1 due to C-N bonding and 3374 cm-1 due to NH str (Figure 2). The infrared spectrum of physical mixture of ATC and P 188 mixture is shown in Figure 3. From the spectrum it was observed that chemical groups Ar-sub, Ar –C=C, C-F – str, N-H stretch, C=N stretching, C=O bending and C-N bonding were found with the same wave number as that of ATC (Figure 2). The result with the FTIR indicates that there was no significant change in the principle peaks in pure drug.
Table 3: IR interpretation data
|
Sr. No. |
Compound |
Frequency (cm-1) |
Type of vibration |
|
1 |
Atorvastatin calcium |
842,810,746 (s) |
Ar-sub. |
|
1579, 1551, 1510, 1435 (s) |
Ar –C=C |
||
|
1216 (s) |
C-F – str |
||
|
1160 (s) |
C-O str |
||
|
1317 (m) |
C-N str |
||
|
3374 (m) |
NH str |
||
|
1650 (s) |
C=O str |
||
|
691 (s) |
C-H def. |
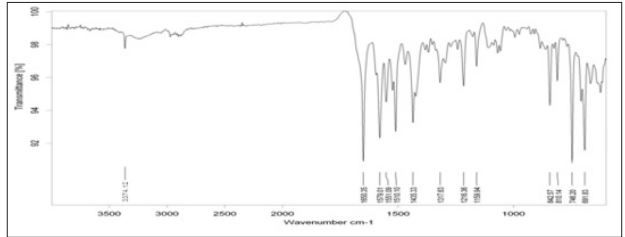
Figure 2: FTIR Spectrum of Atorvastatin calcium
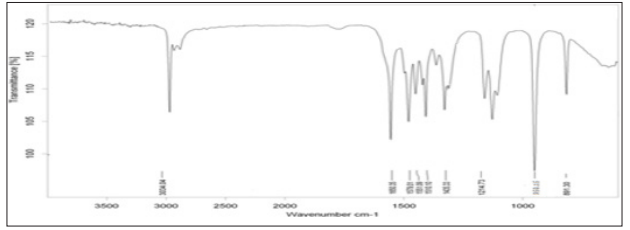
Figure 3: FTIR Spectrum of SEP2
Differential Scanning Calorimetry (DSC)
DSC spectrum of solid dispersion SEP2 (1:2) containing ATC and P 188 as drug carrier is shown in Figure 5. The individual spectrum of pure ATC is shown in Figure 4. The DSC thermogram of ATC pure drug was shown endothermic peak at 159.90°C indicating that the drug is highly crystalline. The absence of drug peak in the solid dispersion formulation (SEP2) indicating the drug was converted into an amorphous form. As the intensity of the endotherm was markedly decreased in the solid dispersion, the faster dissolution rate of the drug from the solid dispersion is attributed due to the reduction in the crystallinity of the drug. Crystallization inhibition is attributed to the entrapment of the drug molecules in the polymer matrix during solvent evaporation.
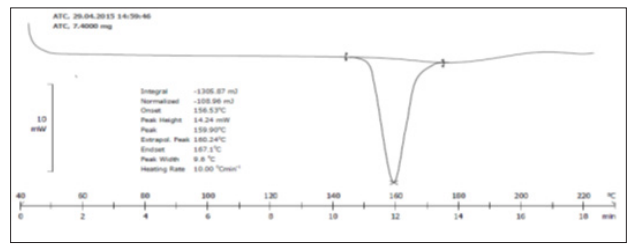
Figure 4: DSC thermogram of Atorvastatin calcium
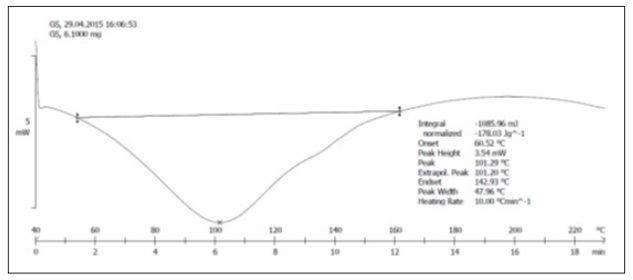
Figure 5: DSC thermogram of SEP2
Powder X-ray diffraction (PXRD)
The XRD diffractogram of ATC and ATC-SDs are presented in figure 6 and figure 7. The XRD spectra of ATC showed various sharp and intense peaks at 16.3°, 18.1°, 23.1°, 26.2°, and 27.1° at a diffraction angle range of 5−50°, suggesting that ATC was present in the crystalline form. The diffraction pattern of ATC-SDs (SEP2) presented the complete disappearance of the characteristic peaks of ATC. The disappearance of the characteristic peaks of ATC suggested that ATC is completely dispersed in the P 188 carrier and converted to the amorphous state. Only the characteristic peaks of the carrier were observed in the ATC-SDs, which suggested the absence of any physical interaction between ATC and P 188.
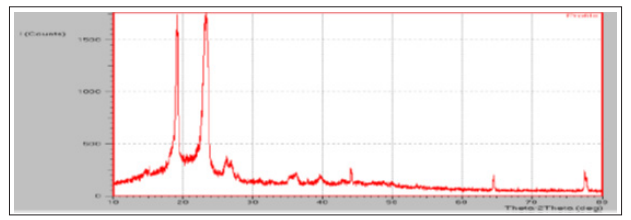
Figure 6: XRD of Atorvastatin calcium
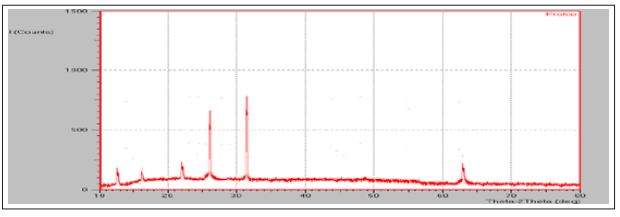
Figure 7: XRD of SEP2
Scanning Electron Microscopy
SEM photographs for pure drug and selected solid dispersion (SEP2) is shown in Figure 8 and Figure 9 respectively. The drug crystals seemed to be smooth-surfaced, irregular in shape and size. In case of Solid dispersions, it was difficult to distinguish the presence of drug crystals. The drug surface in solid dispersion seems to be more porous in nature. Solid dispersions appeared as uniform and homogeneously mixed mass with wrinkled surface. Drug crystals appeared to be incorporated into the particles of the polymers. SEM picture images suggested that the surface properties of Atorvastatin calcium were lost during solvent evaporation and the formation of effective solid dispersion systems. These findings demonstrated that the drug was thoroughly mixed in the carriers with the negligible loss of little crystallinity.
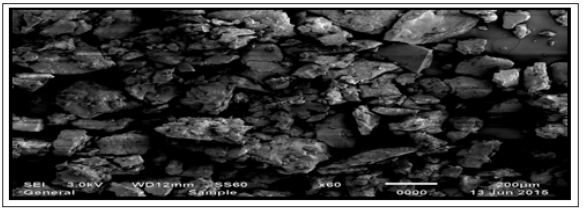
Figure 8: SEM of Atorvastatin calcium
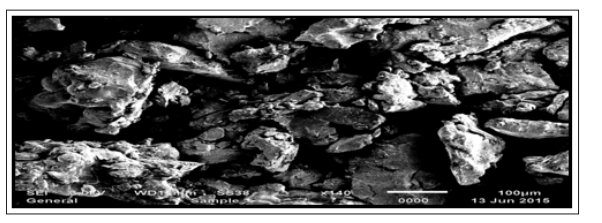
Figure 9: SEM of SEP2
Dissolution Studies
Dissolution studies were performed to compare the drug release from the solid dispersions, to that of the pure drug. The dissolution study was carried out for a period of 60 min in pH 6.8 Phosphate buffer. The drug release data obtained for formulations KMP4, KMG5, SEP2 and SEG3 are tabulated in Table 4. It shows the cumulative percent drug released as a function of time for all formulations. The cumulative percent drug released after 60 min was shown in table 4. In vitro studies reveal that there is marked increase in the dissolution rate of ATC from all the solid dispersions when compared to pure ATC itself. From the in vitro drug release profile, it can be seen that formulation SEP2 containing ATC: P 188 (1:2) showed higher dissolution rate i.e. 82.80+0.35% compared with other formulations. The graphical presentation of dissolution profile of solid dispersion of ATC over the period of 1 hr is shown in Figure 10.
As compared to Kneading method, solvent evaporation method showed highest dissolution rate for ATC. Maximum drug released up to 10min was 32.68+0.24% with drug-carrier ratio (SEP2). While over the period of 60 min, maximum 82.80+0.35% drug was released from selected formulation (SEP2). This was might be due to absence of aggregation and agglomeration with crystalline drug, water soluble carrier increased wetability and good dispersibility and conversion of drug to amorphous state. Less viscosity and good water holding capacity of carrier helps to dissolve the drug rapidly by increasing free kinetic energy. The graphical presentation of % cumulative drug release is shown in Figure 10. The literature reveals that the solvent evaporation method of solid dispersion solubilizes the drug and carrier in molecular level. Hence form eutectic mixture and increased solubility of poorly water soluble drug.
Table 4: Dissolution study data of ATC and selected formulation
|
Sr. No. |
Time (min) |
%Cumulative Drug Release+SD (n =3) |
||||
|
Atorvastatin calcium |
KMP4 |
KMG5 |
SEP2 |
SEG3 |
||
|
1 |
0 |
0 |
0 |
0 |
0 |
0 |
|
2 |
5 |
4.25+0.01 |
10.30+0.23 |
9.67+0.45 |
18.772+0.41 |
12.83+0.61 |
|
3 |
10 |
10.56+0.03 |
20.67+0.33 |
18.78+0.32 |
32.68+0.24 |
18.96+0.21 |
|
4 |
15 |
17.53+0.17 |
31.24+0.12 |
33.63+0.27 |
45.39+0.48 |
36.63+0.82 |
|
5 |
20 |
27.26+0.06 |
47.08+0.63 |
40.17+0.33 |
57.39+0.61 |
54.25+0.35 |
|
6 |
25 |
35.68+0.03 |
62.66+0.93 |
51.49+0.24 |
71.28+0.41 |
62.42+0.35 |
|
7 |
30 |
40.12+0.02 |
68.62+0.16 |
57.25+0.41 |
76.45+0.54 |
71.05+0.27 |
|
8 |
60 |
47.23+0.05 |
73.00+0.24 |
63.00+0.46 |
82.80+0.35 |
77.56+0.45 |
*All values are expressed as mean ±SD, n=3.

Figure 10: In-Vitro Dissolution profiles of Atorvastatin calcium and SDs prepared by Kneading and solvent evaporation method in phosphate buffer pH 6.8 at 37±0.5°C.
Stability studies of the formulation
Solid dispersions showed maximum solubility and drug content were selected for stability studies. Selected formulations were stored at 40°C temperature for a period of 3 months. Formulation was evaluated at periodical intervals of 1 month for drug content. Drug loss was minor as observed after a month study. From the stability studies of the selected batch it was found that the solid dispersions remained stable even after exposing to stress conditions of temperature.
Table 5: Stability study data of Formulation
|
Formulation Code |
Parameters |
Storage at 40°C ± 2°C |
|||
|
0 Month |
1 Month |
2 Month |
3 Month |
||
|
KMP4 |
% Drug content |
92.64 |
91.35 |
90.68 |
90.03 |
|
KMG5 |
% Drug content |
91.01 |
90.39 |
89.68 |
89.07 |
|
SEP2 |
% Drug content |
95.04 |
94.85 |
94.02 |
93.58 |
|
SEG3 |
% Drug content |
94.29 |
93.18 |
92.42 |
91.95 |
Conclusion
In the present study it was demonstrated that ATC solid dispersions can be effectively produced by processing via kneading and solvent evaporation method with enhanced solubility and dissolution rate. P 188 and Guar Gum combinations were selected and stable SD systems were developed successfully. Utilization of P 188 and Guar Gum offers excellent possibilities to develop stable amorphous solid dispersion. Furthermore, this ATC incorporated solid dispersion gave higher dissolution and solubility values compared to the pure ATC drug. In vitro drug release studies of selected formulation (SEP2) exhibited a cumulative release of 82.80+0.35% after 60 min. FTIR spectrum revealed that no chemical interaction occurred between the drug and excipients used in the formulation. Analysis by differential scanning calorimetry showed that ATC existed in the amorphous form within the solid dispersion formulation fabricated using the solvent evaporation process. Additionally, scanning electron microscopy studies suggested the conversion of crystalline ATC to an amorphous form. The dissolution rate and solubility of ATC solid dispersions was improved significantly using P 188 and Guar Gum.
Acknowledgements
The authors would like to thank the Mula Education Society’s College of Pharmacy, Sonai for providing us with the moral support along with the facilities for research along with the other infrastructural facilities. Atra Pharma Pvt Ltd, Aurangabad is gratefully acknowledged for providing Atorvastatin Calcium as a gift sample.
Conflicts of interest
Author declares that there are no conflicts of interest.
References
- Peter L D, Michael D M and Wildfong (2009) Aqueous solubility enhancement through engineering of binary solid composites – Pharmaceutical applications. J. Pharm. Innov 4: 36-49.
- Chiou W L, and Riegelman S (1971) Pharmaceutical Applications of Solid Dispersion J. Pharm. Sci 60: 1281-1302.
- Parvin Zakeri-Milani, Somayeh Hallaj Nezhadi, Mohammad Barzegar-Jalali, Leil Mohammadi, Ali Nokhodchi et al (2011) Studies on Dissolution Enhancement of Prednisolone, a poorly water soluble drug by Solid Dispersion Technique. Advanced Pharmaceutical Bulletin 1: 48-53.
- Fincher J H (1968) Particle size of drugs and its relationship to absorption and activity. J.Pharm. Sci 57: 1825-1835.
- D Praveen Kumar, Arora Vandana (2012) Solid Dispersion A review, JPSI 27-34.
- https://en.m.wikipedia.org/wiki/Poloxamer.
- Ganesh Chaulang, Piyush Patel, Sharwareee Hardikar, Mukul Kelkar, Ashok Bhosale et al (2009) Formulation and Evaluation of Solid Dispersions of Furosemie in Sodium Starch Tropical Journal of Pharmaceutical Research 8: 43-51.
- Parvin Zakeri-Milani, Somayeh Hallaj Nezhadi, Mohammad Barzegar-Jalali, Leil Mohammadi,Ali Nokhodchi et al (2011) Studies on Dissolution Enhancement of Prednisolone, a poorly water soluble drug by Solid Dispersion Technique. Advanced Pharmaceutical Bulletin 1: 48-53.
- Hancock B C, Zografi G (1997) Characteristics and Significance of the Amorphous State in Pharmaceutical Systems. J. Pharm Sci 86: 1-12.
- Matsumoto T, Zografi G (1999) Physical properties of Solid Molecular Dispersions of Indomethacin with poly (vinylpyrrolidone) and poly (vinyl-acetate) in relation to Indomethacin crystallization. Pharm Res 16: 1722-1728.
- K R Bobe, CR Subrahmanya, Sarasija Suresh, DT Gaikwad, MD Patil (2011) Formulation and Evaluation of Solid Dispersion of Atorvastatin with various carriers, International Journal of Comprehensive Pharmacy .
- Shamsuddin, Mohammad Fazil, Shahid Husain Ansari and Javed Ali, (2016) Development and evaluation of solid dispersion of spironolactone using fusion method. International Journal of Pharmaceutical Investigation 6: 63-

