A New Approach for Analytical Method Development and Validation for Quantification of Tolvaptan Using RP-HPLC in Bulk and in its Tablet
© 2023 K Bhavyasri, B Aishwarya, Anushree Hari, M Sumakanth, et al. This is an open-access article distributed under the terms of the Creative Commons Attribution License, which permits unrestricted use, distribution, and reproduction in any medium, provided the original author and source are credited.
Abstract
By Using RP-HPLC it was feasible to construct a Quick, Precise, and Accurate Approach for the measurement of Tolvaptan in Bulk and Pharmaceutical Dosage form. In order to do the chromatography, the stationary phase PhenomenoxC18 100 mm x 4.6 mm, 5µmcolumn system was used for UV detection with a267 nm wavelength. The mobile phase was GAA (60:40) with water (HPLC grade) adjusted topH-3 at a flow rate of 0.6 ml/min. A retention time of 3.4 minutes was observed for tolvaptan. ICH Q2 (R1) guidelines were followed to approve the developed procedure. The approach produces linear responses 25-150. There aren’t many liquid chromatographic methods that have been published to determine tolvaptan. As a result, the current approach, which was created and validated using RP-HPLC, would be a quick, precise, and accurate way to measure tolvaptan in pharmaceutical dosage forms and bulk.
Introduction
Tolvaptan is the first vasopressin receptor 2 antagonist that can be used orally and was licensed by the FDA in 2009 to treat clinically severe hypervolemic and euvolemic hyponatremia that are linked to heart failure and syndrome of sudden death [1-4]. Tolvaptan is a drug that blocks the vasopressin receptor. Both euvolemic and hypervolemic illnesses are treated with it. Hyponatremia (low blood salt levels) is linked to congenital heart failure (CHF), chlorosis, and the syndrome of inappropriate anti-diuretic hormone (SIADH) [5-8]. Vasopressin augmentations may result in fluid retention and decreases in serum blood salt levels. The activity of vasopressin is initiated when tolvaptan binds to vasopressin receptors in the collecting tube of the nephron [9-12].
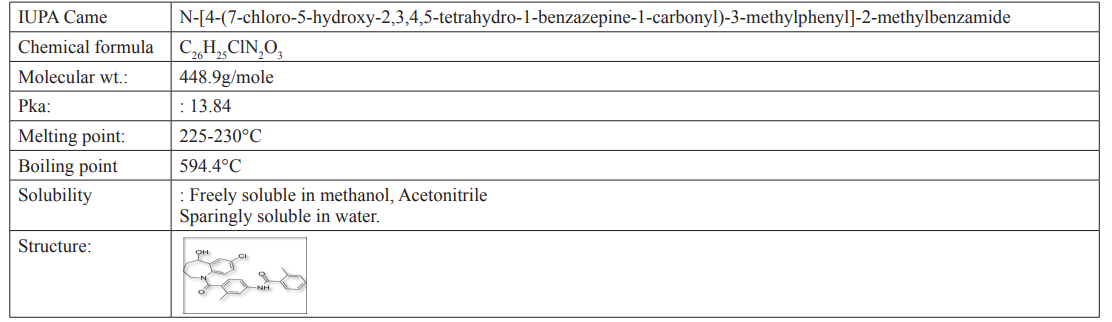
Physical Properties
Table 1: Drug Profile
Instruments and Chemicals Used
Tolvaptan pure drug was obtained as gift sample from pharmaceutical industry, India. Tolvaptan formulation was purchased from local drug store. HPLC grade Methanol and HPLC grade Water was used. Glacial acetic acid used was of Analytical grade. Prior to introduction of the mobile phase into the HPLC system, it was sonicated with all ABOTECH So nicator (LMUC-2, L8486), filtered.
Using vacuum filtration, and adjusted pH was confirmed with an ELI Cop Meter. For the determination of tolvaptan by the chromatographic method, a SHIMADZU brand HPLC system with a binary pump (LC20AD) was used, the columnwasaSUNSILC18, the sample was injected with a Redone injector, followed by a UV detector and dem Equipped with the system is installed with software called LCSOLUTIONS for data interpretation.
Method Development Preparation of Standard Solution
Weigh approximately 5mg of Tolvaptan in 5ml volumetric flask and dissolve upto the mark with acetonitrile to give 1000µg/ ml.from the 1000µg/ml pipette out 1ml into a 10ml volumetric flask dilute upto the mark to give 100µg/ml.
Selection of Diluent
From 100µg/ml.pipette out 1ml into volumetric flask(10ml) and A sequence of trails were done to find out the solvent for dissolving the drug. The solvents such as water, methanol:HPLC water and acetonitrile: HPLC water , the drug was found to be freely soluble in methnaol:HPLC water and scanned in the Uv-visible spectrophotometer from (200-400)nm. Tolvaptan shows maximum absorbance at 267nm.
Optimization Condition
Table 2: Chromatographic Conditions
|
System |
ShimadzuLC-20AD |
|
Column |
WatersC18 100mmx4.6mm,5µ. |
|
Mobile phase |
Methanol: Water (Upgrade)adjusted topH-3 with GAA (60:40) |
|
Injection volume |
20.0μL |
|
Retention time |
3.4 |
|
Detector |
267nm |
|
Flow rate |
0.7ml/min |
|
Runtime |
15min |
Method Validation Parameters
Specificity
Look for conflicts using an optimized method. The blank and placebo retention times for these drugs should be free of any peaks that could interfere. This method was hence termed too as special. Specificity was evaluated by injecting blank.
Linearity
An analytical technique’s strength is its ability to yield test findings that are directly proportional to the analyte concentration in a sample that is shown to be within preset limits.
Preparation of Serial Dilutions from 25 To 150μg/Ml
Serial dilutions of the 100 g/ml working standard solution were prepared in serial dilutions of 2.5, 5.0, 7.5, 1.0, 1.25, and 1.50 g/ml. By dilution using HPLC grade methanol, you can obtain concentrations of 25, 50, 75, 100, 125, and 150g/mL. Tolvaptan standard stock solutions of 25, 50, 75, 100, 125, and 150 g/mL were administered to assess linearity; the response was observed; the calibration cure was calculated by graphing concentration on the x-axis, peak regions on the y-axis, and the standard curve was drawn to get the R2 value.
Precision
When a homogeneous sample sampled repeatedly under specific conditions, the level of consistency between asset of measurements is referential the precision of an analytical method. Tolvaptan was injected into the HPLC system six times with a concentration of 15 g/ml undertone valuate the precision. RSD %was calculated.
Accuracy
A recovery study was used to evaluate the suggested method’s accuracy. Three concentration levels of a tolvaptan standard solution-50%, 100%, and 150%-were spiked into the sample solution.
The HPL System received there plicate so each concentration level, and the system reactionwise recorded. The recovery rate was computed.
Preparation of Standard Solutions
Transfer the 100 µg/ml working standard solution’s0.5, 1.0, and
1.5 µg/ml concentrations to a series of 10 ml volumetric flasks. Get 5, 10, and 15µg/ml by diluting with HPL Grade methanol.
Preparation A 15 µG/ML Stock Sample Solution
Tolvaptan sample solution is prepared by adding 10 mg to Quantitative flask and diluting to 1000 µg/ml with HPLC grade methanol. Pipette 1.5 ml of the 1000 µg/ml solution in a 10 ml volumetric flask, then use HPLC grade methanoltoadjustthecon centrationto15µg/ml.
Spiking Procedure
Mix 2ml Tolvaptan 15 µg/ml sample solution and 5 µg/ml standard solution were combined in 2 ml, then injected into the HPLC system to obtain2 ml of a tolvaptan sample solution having 15 g/ml was mixed with 2 ml ofastandardsolutioncontaining10g/ml and Add 2 mL of 15μg/mL standard solution to 2 mL of 15μg/ml sample solution of tolvaptan, mix, solution and inject in to HPLC system.
Robustness
The reliability of an analytical method in typical use is determined by how well it can’t operate nor but deliberate exchanges inthemethod’sparameters. Under chromatographic settings of
0.5 0.1 ml/min and variable mobile phase concentration ratios, the robustness technique of the involved three replicate injections of a 15 µg/m tolvaptan solution with varying flow rates and mobile phase ratios were established after the %RSD was estimated from chromatogram.
L.O.D&L.O. Q
The lowest level of analyte in a sample that can be detected using a single analytical method is known as the detection limit; however, this level is not always quantified as an exact value where the lowest order quantity (LOQ) is the smallest sample size that can be quantified with rea sonable accuracy and precision.
Assay of Tolvaptan
Preparation of the Tolvaptan Sample Stock Solution (1000g/ml): Tolvaptan was diluted to a concentration of 1000 g/mL by adding 10 mg to a 10 µg/ml volume rifle ask, followed by the addition of HPLC grade methanol.
Preparation of Sample Working Solutions (15μg/ml)
Toobtain15g/m loft tolvaptan, pipette 1.5ml of the a for mentioned sample stock solution intoa10mlvolumetricflaskandfillthe remaining space with diluent.
Assay= (Area of sample / Area of standard) x (Concentration of Standard Concentration of Sample) x Assay of Standard
Results and Discussion
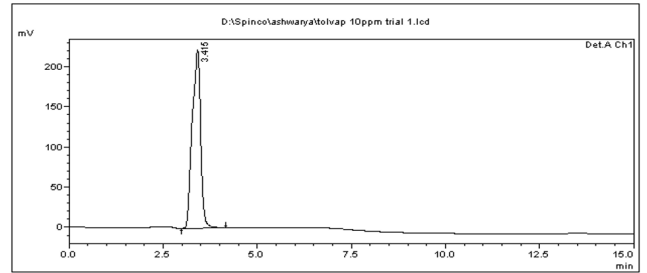
Figure 1: Chromatogram of Tolvaptan with HPLC Grade Methanol: Water (HPLC grade) adjustedtopH-3withGAA (60:40).
Specificity
No peaks were observed at the RT of Enoxaparin sodium when blank was injected.
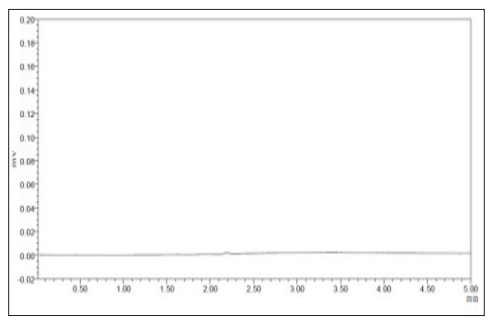
Figure 2: Chromatogram of Blank
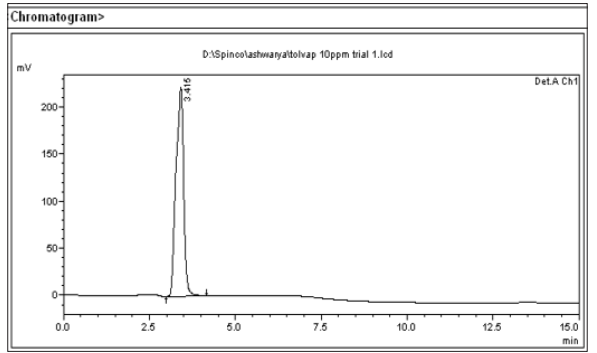
Figure 3: Chromatogram of Standard
Linearity
To demonstrate the linearity of assay method, inject standard solutions with concentration so about 25 pepato 150ppmofTolvaptan.Plota graph to concentration versus peak area.
Table 3: Linearity Data
|
Injection |
Area |
Retention time |
Theoretical Plate count |
Tailing factor |
|
25 |
2076412 |
3.4 |
2010.955 |
0.952 |
|
50 |
4093214 |
3.4 |
2110.955 |
1.003 |
|
75 |
5892690 |
3.4 |
2210.955 |
0.986 |
|
100 |
7702198 |
3.4 |
2010.955 |
1.204 |
|
125 |
9621358 |
3.4 |
2110.955 |
0.932 |
|
150 |
11359843 |
3.4 |
2210.955 |
1.054 |
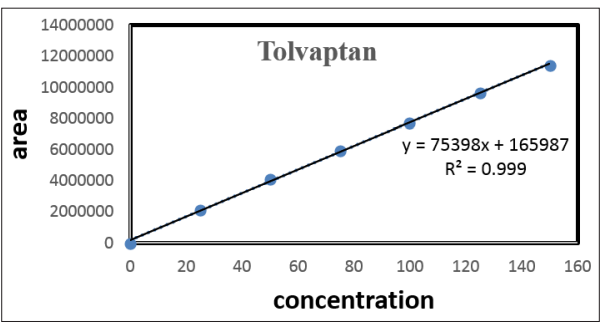
Figure 4: Calibration Plot- Concentration Vs. Peak Area
Precision
Six standard solutions of 15ppm of Tolvaptan were injected and %RSD was found to be 0.00105908 %.
Table 4: Precision Data
|
Injections |
Area |
Retention time |
Theoretical plate count |
Tailing factor |
|
1 |
21226810 |
3.4 |
2039.468 |
1.026 |
|
2 |
21226231 |
3.4 |
2042.298 |
1.043 |
|
3 |
21226230 |
3.4 |
2057.968 |
0.998 |
|
4 |
21226633 |
3.4 |
2056.985 |
0.976 |
|
5 |
21226260 |
3.4 |
2089.836 |
1.032 |
|
6 |
21226328 |
3.4 |
2075.547 |
1.063 |
|
|
21226423.67 |
|
|
|
|
SD |
224.8048536 |
|
|
|
|
%RSD |
0.00105908 % |
|
|
|
Accuracy
Recovery experiments were used to test the method’s accuracy by adding standard solution to sample solution at three different concentrations-50%, 100%, and 150%.
Table 5: Accuracy Data
|
Concentration level (%) |
Standard Conc. (µg/ml) |
Spiked sample amount (µg/ml) |
% recovery |
Mean% Recovery |
|
50% |
5µg/ml |
15µg/ml |
98.4% |
94.1% |
|
5µg/ml |
15µg/ml |
99.6% |
||
|
5µg/ml |
15µg/ml |
99.9% |
||
|
100% |
10µg/ml |
15µg/ml |
99.3% |
96.6% |
|
10µg/ml |
15µg/ml |
99.6% |
||
|
10µg/ml |
15µg/ml |
98.5% |
||
|
150% |
15µg/ml |
15µg/ml |
98.5% |
99.8% |
|
15µg/ml |
15µg/ml |
99.7% |
||
|
15µg/ml |
15µg/ml |
99.0% |
Robustness
Table 6: Robustness Data
|
Concentration level (%) |
Standard Conc. (µg/ml) |
Spiked sample amount (µg/ml) |
% recovery |
Mean% Recovery |
|
50% |
5µg/ml |
15µg/ml |
98.4% |
94.1% |
|
5µg/ml |
15µg/ml |
99.6% |
||
|
5µg/ml |
15µg/ml |
99.9% |
||
|
100% |
10µg/ml |
15µg/ml |
99.3% |
96.6% |
|
10µg/ml |
15µg/ml |
99.6% |
||
|
10µg/ml |
15µg/ml |
98.5% |
||
|
150% |
15µg/ml |
15µg/ml |
98.5% |
99.8% |
|
15µg/ml |
15µg/ml |
99.7% |
||
|
15µg/ml |
15µg/ml |
99.0% |
LOD &LOQ:
LOD = 3.3*SD/ slope.
= 3.3*0.000477/0.0031
= 0.0298157ug/ml
LOQ = 10* SD/slope.
= 10*0.000477/0.0031
=0.09737446ug/ml
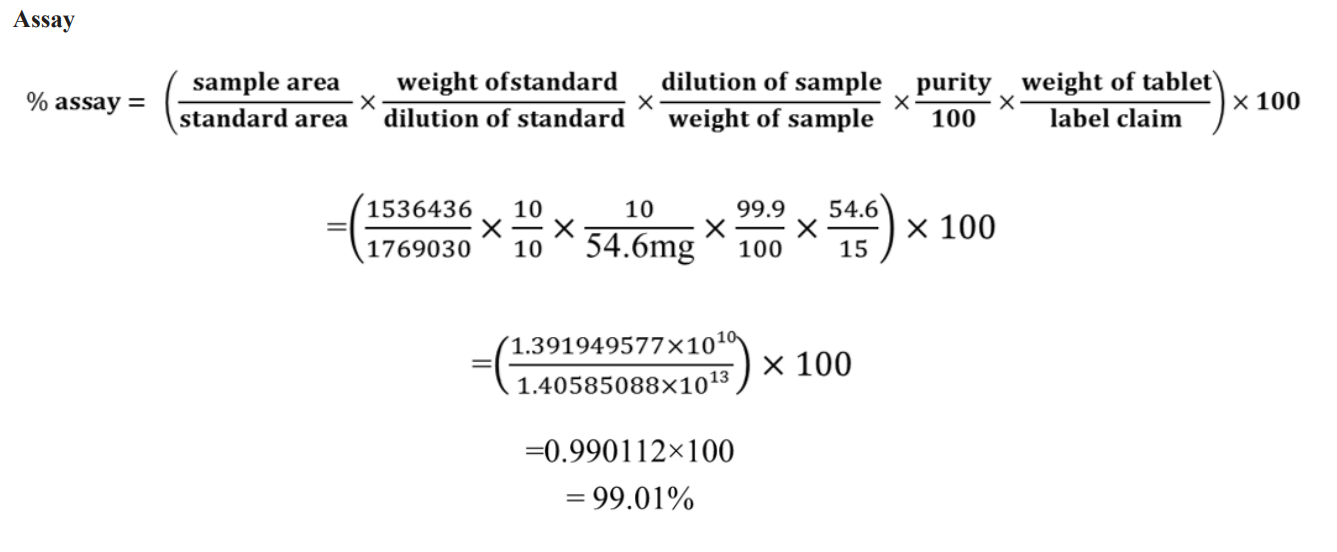
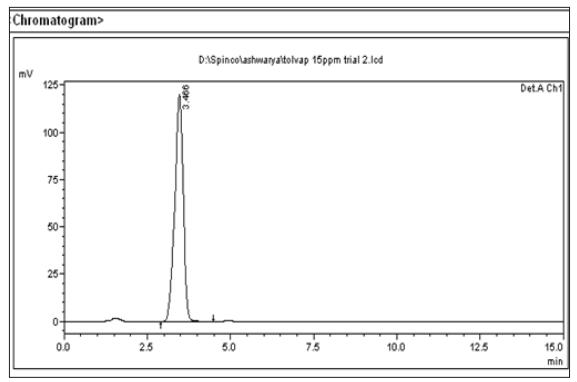
Figure 5: Chromatogram of Tol Standard
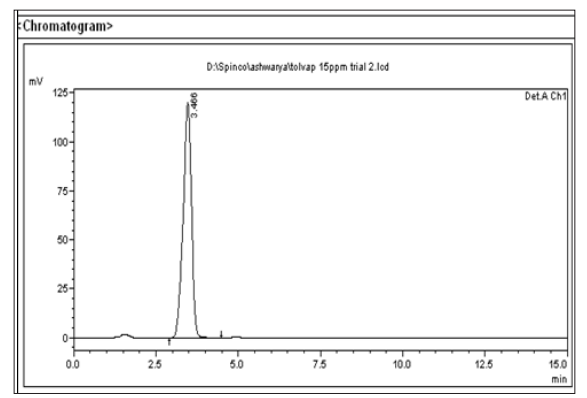
Figure 6: Chromatogram of Tol Sample
Conclusion
The proposed RP-HPLC method was found to be simple, specific, precise, accurate, rapid, and economical for the estimation of Tolvaptan in Marketed products. The developed method was validated statistically according to ICH guidelines. The sample recovery in the formulation was in good agreement with their respective label claims. This method was found to be better than previously reported methods. Hence above method can be used in quality control for routine analysis.
Acknowledgment
I want to acknowledge our beloved Principal Prof. M. Umakanth and the Faculty of the Department of Pharmaceutical Analysis of RBVRR women’s college of pharmacy for allowing me to perform my research work.
References
- Toshiki M, Hiroyuki F, Yoshitaka Y, Shigeki N, Toyoki M Tolvaptan (20007) An OrallyActiveVasopressinV2- ReceptorAntagonist-harmacology and Clinical Trials. Cardiovas. Drugs rev 25: 0-13.
- Budavri S (2006) The Merck An Encyclopedia of Chemicals, Drugs, and Biologicals, Merck &Co, Inc.,Whitehouse Station 1639.
- Hauptman PJ, ZimmerC, Udelson J, Shoaf SE, Mallikaarjun S, et (2005) Comparison of two doses anddosing regimens of tolvaptan in congestiveheartfailure.J CardiovascPharmacol 46: 609-614.
- Sojeong Yi, Heyningen, Sea Hyun Yoon, Joo-youncho, Sang-goo shin, et (2002). Pharmacokinetics and pharma dynamics of Orlova ptanadministered in 15-60 mg single doses to Korean men. J Cardiovasc Pharmocol 59: 315-322.
- Kalyan Chakravarthy, D Gowri Shankar (2011) Development and validation of RP –HPLC method for estimation of tolvaptan in bulk and its pharmaceutical formulation. RasayanJ.Chem 4: 1165-1171.
- Lanka A Ramprasad, JVLNS Rao, SrinivasuPamidi, Vara Prasad J, NagaRaju D (2012) Impurity profiling of tolvaptan tablets using new stability indicating UPL C method. International Research Journal of Pharmacy 3: 21-25.
- Chakravarthy VK, Gourishankar (2011) Development and validation of RP-HPL C method for estimation of tolvaptan in Bollandist Pharmaceutical formulation, Ras Ayan Chem 4: 165-171.
- S Murugan, V Rajasekharreddy, P Sirisha, N Pravallika, K Chandrakala (2013) Method Development and Validation of Tolvaptan in Bulk and Tablet Dosage Form by RP-HPLC Method Int.J.Res. Pharm. Nano 2: 135-139.
- PrathyushaB, ShirishaB, Ramathilagam N, PriyaJ, Sekhar CK (2013) Analytical method development and validation of Tolvaptan in bulk and tablet dosage form byRP-HPLC. WorldJ Pharm Pharm 3: 754-762.
- ChandmalinSk, CH MM Prasad Rao (2016) Analytical Method Development and Validation of Tolvaptan and its Related Substances in Drug Product by RP-HPLC Asian Pharmacal 4: 194-200.
- Gandhi BM, Rao AL, Rao JV (2017) A New Stability- Indicating and Validated RP-HPLC Method for the Estimation of Tolvaptan in Bulk and Pharmaceutical Dosage Forms. Asian Pharmacal 12: 31-44.
- Suryawanshi M (2020) Development and validation of HPLC method for estimation of botulinic World Pharm 8: 1-5.
- KhaleelaN, RahamanbSK (2020) Development and Validation of Novel StabilityI ndicatingRP-HPLCMethodforQuantifi cationofTolvaptaninBulkandPharmaceuticalDosage Form. Abstracted by 57: 62.
- Sri VK, Sruthi S, Srinivas LD UV (2014) Spectrophotometric Method for the Estimation of Tolvaptanin Bulkand Pharmaceutical Formulations.AsianJ.Pharm.Anal 7: 773-776.
- Validation of analytical procedures text andmethodologyQ2(R1). https://www.ema.europa.eu/en/documents/scientific-guideline/ich-q-2-r1-validation-analytical-procedures-text-methodology-step-5_en.pdf