Weight Prediction of Durum Wheat Grains Using Computer Vision and Machine Learning
© 2024 Okan Uyar, Nurettin Kayahan, et al. This is an open-access article distributed under the terms of the Creative Commons Attribution License, which permits unrestricted use, distribution, and reproduction in any medium, provided the original author and source are credited.
Abstract
Weight of the grains is an important feature in the quality assessment and agricultural mechanization processes. This study presents a method for predicting the weight of durum wheat grains by combining image processing techniques with artificial neural networks (ANN). Physical characteristics of wheat grains, such as length, width, thickness, and projection area, were extracted from high-resolution images and used as inputs for the ANN model. The model’s performance was evaluated using several statistical metrics, including Mean Squared Error (MSE), Root Mean Squared Error (RMSE), and R-squared (R²). The ANN achieved an average MSE of 1.216×10-⁵ and RMSE of 3.34×10-³ grams, with an R² value of 0.89, indicating high predictive accuracy. These results demonstrate that the integration of image processing and ANN can effectively estimate wheat grain weight with minimal error, offering a practical solution for applications in agricultural mechanization.
Introduction
Wheat is a strategic grain type that has been widely cultivated globally for many years. It is rich in nutrients and plays a significant role in both human and animal nutrition, as well as in international trade and industry [1-8].
Wheat is an indispensable crop plant in nutrition, trade and crop rotation systems both in our country and in the world. When food consumption throughout Türkiye is examined, consumption of grain and grain products comes [9,10].
Wheat, which is the leading grain, is generally consumed in the form of bread, pasta, bulgur, semolina, noodles, couscous and other flour products. Durum wheat is mostly used in the production of pasta and bulgur in our country, and in small amounts in the production of bread, semolina (except for pasta production), baklava and kadayif [9,11]. When we look at the cultivated areas of our country, it is seen that approximately 50% of these areas consist of grains. Approximately 70% of the cultivated grain areas are wheat. The main use of durum wheat is in pasta varieties, and it is produced for this purpose especially in European and North American countries, and is also used in the production of bulgur, couscous and different types of bread and pasta in other regions, including Turkey, the Middle East and North African countries [3].
In recent years, the consumption of wheat in the form of pasta has increased compared to the consumption of bread in the world. The long-term storage feature of pasta, its variety, ease of preparation, taste and the fact that it is a nutritious and economical foodstuff are effective in increasing its consumption [9].
Harvest and post-harvest mechanization stages are one of the most important stages of mechanization in agricultural production [12]. Many physical and mechanical properties of the seed play an important role in the design, development and operation of the machines and systems used in performing these processes [13-15]. The weight property, which is one of the physical properties of seeds, is an important property used for this purpose and in most studies evaluating product quality [16-23].
Manual measurement of physical properties is a time-consuming and labor-intensive process. Steps such as measuring the dimensions of each grain with a precise caliper and waiting for the balance to stabilize during weight measurement contribute to the delay in the overall procedure. Therefore, machine learning and image processing techniques offer significant potential to expedite and streamline these operations. By automating physical measurements, these techniques not only save time but also enable more accurate and consistent results. Artificial neural networks (ANNs) are increasingly used in the agricultural sector. These methods have proven effective in predicting crop parameters, such as yield and weight.
Artificial neural networks (ANNs) have recently become widely adopted for estimating crop parameters such as yield and weight.
These models, combined with image processing techniques, offer precise and efficient methods for predicting wheat weight based on various visual and morphological features. For instance, studies have applied ANN-based methods to classify wheat grains and estimate yield with high accuracy, using features like shape, color, and texture extracted through image processing techniques [24]. Furthermore, ANN models have been employed to assess wheat grain weight based on multispectral imagery, with notable success in predicting grain weight with a minimal error rate [25]. These techniques not only offer high accuracy but also present a scalable solution for agricultural applications, reducing the time and cost associated with traditional methods of yield estimation.
Image processing techniques are widely employed to accurately measure the physical properties of cereal products, such as width, length, and thickness. These methods involve capturing high-resolution images of cereal grains and analyzing them using specialized software to extract geometrical dimensions. For instance, studies have demonstrated the use of digital image processing systems to measure linear dimensions, such as kernel length, width, area, and thickness, of grains like wheat, oats, and barley, achieving high accuracy and efficiency [26]. Additionally, automated systems using digital image techniques have been developed to measure various geometric features of seeds, such as roundness and sphericity, which are essential for assessing grain quality [27]. Furthermore, the accuracy of image processing in determining physical properties has been confirmed by comparing it with manual methods, showing that it is a reliable and rapid approach for cereal grain analysis [28].
In this study, it was aimed to model the grain weight, which is one of the important properties for harvest and post-harvest mechanization processes and characterization in durum wheat, with ANN using physical properties obtained by image processing techniques.
Materials and Methods
In this study, a combination of image processing techniques and artificial neural networks (ANN) was employed to predict the weight of wheat grains based on their physical dimensions. The process involved several steps, including image acquisition, preprocessing, feature extraction, and ANN modeling. The following subsections describe each stage in detail, outlining the methods used to process the images, extract relevant features, determine physical properties and build the predictive model.
Determination of Physical Properties
Ç1252, a commercial durum wheat variety, was used in the research. The initial moisture level of the seeds was determined using a standard procedure (USDA, 1970) and was found to be 8.2% (d.b.). 105 seeds were randomly selected to determine physical and mechanical properties.
The weight of each seed was measured with a precision balance with a resolution of 0.001 grams.
Image processing technique was used to determine the length, width, thickness and projection area of each seed. The length, width and thickness of each seed were measured using an electronic caliper with a precision of 0.01 mm for verification.
The geometric mean diameter (Dp) and arithmetic mean diameter (Da) of the seeds were calculated using the following formula according to Mohsenin (1986):
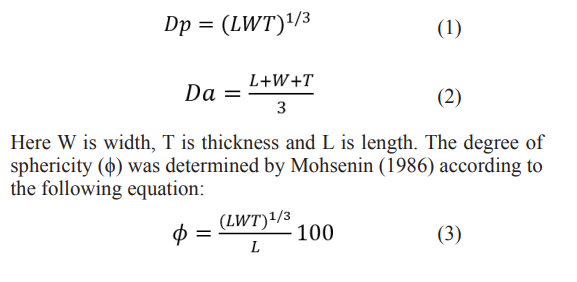
Image Acquisition
To calibrate the images taken for wheat projection, calibration object with a known size was placed within the field of view. This ensured that when the photo capture height changed slightly, the pixel-to-length conversion could be easily calibrated. To ensure successful background removal and segmentation, wheat seeds were aligned on white paper. For future work, it is planned to produce a plate with slots for the seeds to further automate this process.
The images were initially read using the OpenCV library, and as shown in Figure 1, the color channels were converted from BGR to RGB format. This transformation was performed to enhance visualization and ensure accurate processing.
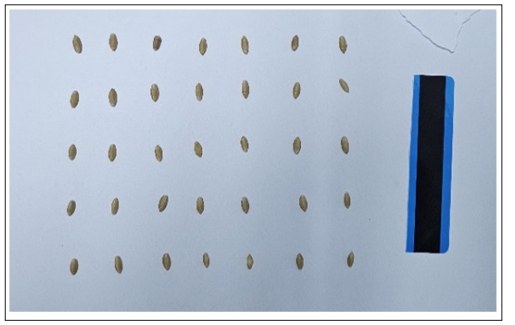
Figure 1: Raw ?mage Loaded into the Software
Image Preprocessing
To reduce computational costs and focus on the relevant parts of the image, the original image was resized to 25% of its original dimensions. This scaling was performed using bilinear interpolation, ensuring minimal loss of detail.
As shown in Figure 2, a Region of Interest (ROI) containing the wheat grains was manually selected by isolating the relevant area. The selected ROI was then rescaled back to the original image dimensions for accurate measurements. A similar process was applied to select the calibration credit card placed in the image.
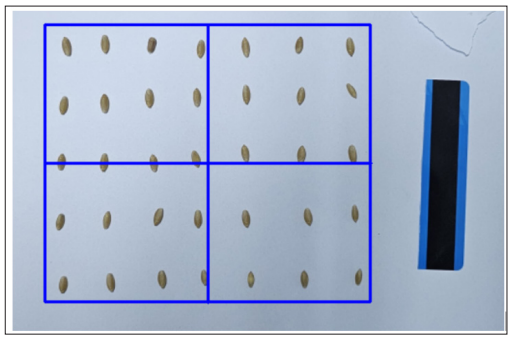
Figure 2: ROI Selection from Raw ?mage
To prepare the image for contour detection, the preprocessing steps shown in Figure 3 were applied to the selected ROI.
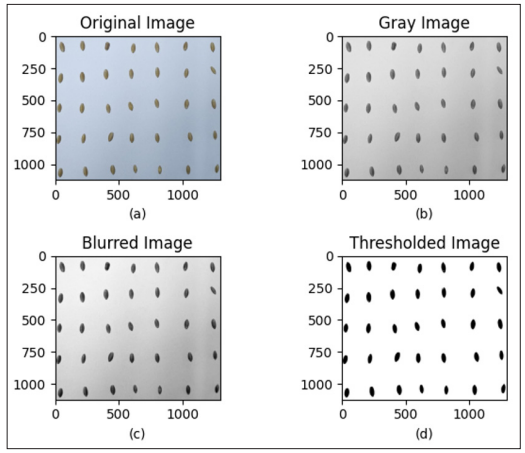
Figure 3: Image Preprocessing Steps
Grayscale Conversion
The color image was converted to grayscale to simplify the analysis by focusing solely on intensity values (Figure 3b).
Gaussian Blurring
A Gaussian blur filter with a 7x7 kernel was applied to reduce noise and smooth the image. This helped enhance the separation of objects from the background (Figure 3c).
Thresholding
A binary thresholding operation was performed with a threshold value of 157, creating a binary image where the wheat grains appeared as black objects against a white background. This step simplified the identification of weed boundaries (Figure 3d).
Morphological Operations
After thresholding, morphological closing was applied to smoothen the object boundaries and fill small gaps within the grains. This operation first dilates the objects, followed by erosion, which helps in closing small holes and making the contours more continuous. A rectangular structuring element of size 5x5 was used for this purpose. The morphological closing step ensured that the wheat grains were properly segmented, making it easier to detect their contours in the following steps.
Edge Detection and Contour Extraction
The Canny edge detection algorithm was used to detect the boundaries of wheat grains. This method identifies areas in the image with sharp intensity gradients, which typically correspond to the edges of objects. The parameters for edge detection were set to 70 and 150 for lower and upper thresholds, respectively, ensuring clear detection of the grain boundaries.
Contours of individual wheat grains were detected using OpenCV’s find Contours function, which traces the boundaries of objects in a binary image. To avoid noise, only contours with an area greater than 5 pixels were considered. For each detected contour, a bounding rectangle was fitted, and its width and height were measured in pixel units. These measurements were printed to the console for further analysis. Each detected wheat grain was labeled, and the bounding rectangles were drawn on the original image for visual verification as shown in Figure 4.
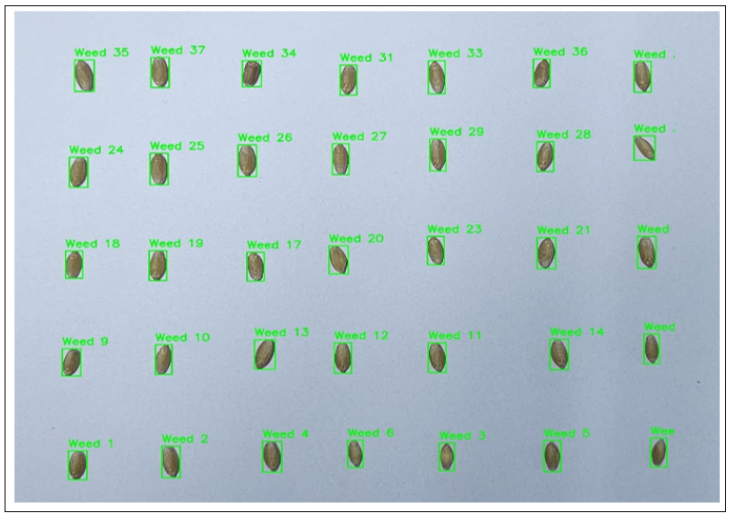
Figure 4: Labeled and Boxed Wheats
Dataset
The Pearson correlation coefficient between each measured and calculated parameter and its corresponding weight value was examined to select the appropriate data for the artificial neural network. Parameters with a coefficient value of 0.4 or higher, including Length, Width, Thickness, GMD, and Projection, were selected as inputs.
A distribution graph of each parameter in the obtained dataset against the weight was plotted. Outliers that significantly deviated from the general distribution were removed from the dataset. As a result of this process, the number of data points decreased from 105 to 100.
When the features of the wheat samples are on different scales, it complicates the model's learning process. To address this issue, the Min-Max scaling method was used. In this method, each feature was normalized to a scale between 0 and 1 by adjusting it between its minimum and maximum values.
The dataset was divided into training and test sets to accurately evaluate the model's performance. In this process, 90% of the data was allocated for training, while 10% was reserved for testing. This allowed for assessing how the model would perform on new data.
Artificial Neural Network Design
One of the most common methods used for regression problems, the Artificial Neural Network (ANN), was employed for weight estimation. This model learns and produces predictions by adjusting weights through successive hidden layers following the input layer.
The input layer included the features (Length, Width, Thickness, GMD, and Projection Area). The ReLU activation function was used to capture nonlinear relationships in the hidden layers. The layers consisted of 64, 32, 16, and 8 neurons, respectively. In the output layer, a single neuron was used to produce the weight value through a linear activation function.
To optimize the neural network’s weights, the Adam (Adaptive Moment Estimation) algorithm was used. Compared to the classic Stochastic Gradient Descent (SGD) method, Adam provides faster and more efficient learning, especially when dealing with complex and large datasets.
The performance of the model was evaluated using Mean Squared Error (MSE). MSE magnifies the errors by squaring them and aims to minimize the average error, leading to more accurate predictions.
Model Training and Evaluation
The model was compiled using the Adam optimizer with a learning rate of 0.001. The loss function used was MSE. The model was trained over 100 epochs with a batch size of 1, and 10% of the training data was reserved for validation to monitor the model’s performance. The training performance for fifth run was depicted in Figure 5.
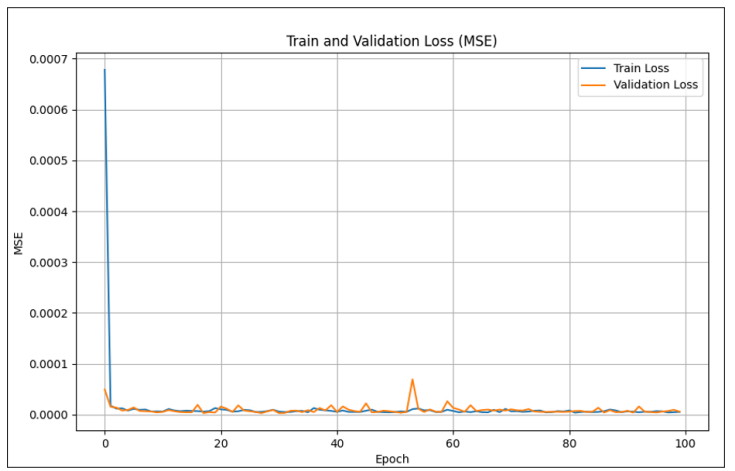
Figure 5: Train and validation loss graph
After training, the model was evaluated using test data, and several metrics were calculated to assess its accuracy: Mean Squared Error (MSE) measured the average squared difference between predicted and actual values, while Root Mean Squared Error (RMSE) provided an interpretable error in grams. Mean Absolute Percentage Error (MAPE) indicated the average relative error as a percentage, and Mean Absolute Error (MAE) captured the average absolute difference between predictions and true values. The R-squared (R²) metric explained the proportion of variance in the target variable accounted for by the features, and the Pearson correlation coefficient was also computed to evaluate the linear relationship between the predicted and actual wheat weights.
Results and Discussion
The performance of the artificial neural network (ANN) model was evaluated using various statistical metrics across ten test iterations. Each test run produced values for Mean Squared Error (MSE), Root Mean Squared Error (RMSE), Mean Absolute Percentage Error (MAPE), Mean Absolute Error (MAE), R-squared (R²), and the Pearson correlation coefficient (R). These metrics help assess the accuracy and generalizability of the model in predicting wheat weights based on input features. The results from each test, along with their averages, are presented in Table 1.
Table 1: Performance Metrics for the Model
|
Test No |
MSE |
RMSE |
MAPE |
MAE |
R^2 |
R |
|
1 |
7,817E-06 |
2,700E-03 |
4,530E-02 |
2,300E-03 |
9,290E-01 |
9,675E-01 |
|
2 |
7,170E-06 |
2,600E-03 |
4,530E-02 |
2,400E-03 |
9,349E-01 |
9,742E-01 |
|
3 |
1,023E-05 |
3,100E-03 |
5,840E-02 |
2,900E-03 |
9,071E-01 |
9,689E-01 |
|
4 |
2,621E-05 |
5,100E-03 |
8,400E-02 |
4,300E-03 |
7,620E-01 |
9,674E-01 |
|
5 |
1,479E-05 |
3,800E-03 |
5,500E-02 |
3,000E-03 |
8,657E-01 |
9,726E-01 |
|
6 |
6,669E-06 |
2,500E-03 |
4,320E-02 |
2,400E-03 |
9,394E-01 |
9,739E-01 |
|
7 |
1,452E-05 |
3,800E-03 |
6,510E-02 |
3,200E-03 |
8,682E-01 |
9,590E-01 |
|
8 |
7,777E-06 |
2,700E-03 |
4,040E-02 |
2,200E-03 |
9,294E-01 |
9,650E-01 |
|
9 |
1,689E-05 |
4,100E-03 |
6,680E-02 |
3,200E-03 |
8,467E-01 |
9,389E-01 |
|
10 |
9,548E-06 |
3,000E-03 |
5,240E-02 |
2,800E-03 |
9,133E-01 |
9,744E-01 |
|
Average |
1,216E-05 |
3,340E-03 |
5,559E-02 |
2,870E-03 |
8,896E-01 |
9,662E-01 |
The results indicate that the ANN model performed consistently well across all tests, with MSE values ranging from 6.669×10⁻⁶ to 2.621×10⁻⁵, showing relatively low prediction error. The average RMSE was 3.34×10⁻³, and the MAPE was 5.56%, suggesting that the model's predictions deviated only slightly from the actual values. The R-squared values indicate that the model explained around 88.96% of the variance in the target variable, demonstrating good predictive power. Pearson correlation coefficients (R) consistently exceeded 0.96, indicating a strong positive linear relationship between the predicted and actual weights. Overall, the model showed a high level of accuracy and robustness across the different tests, with relatively minor deviations.
The Figure 6 illustrates one example of the comparison between actual and predicted wheat weights across a subset of 10 data samples. As seen in the graph, the model's predictions closely follow the actual weight values, with minimal deviations. This result highlights the model's ability to generalize and make accurate predictions. Four such figures, similar to the one provided, will be shared to demonstrate the model's consistency across multiple runs. Each of these graphs further reinforces the reliability and accuracy of the model's predictive capabilities.
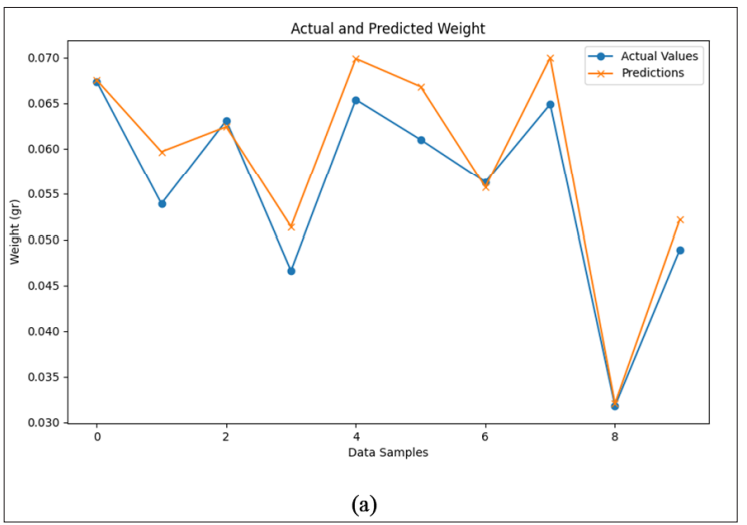
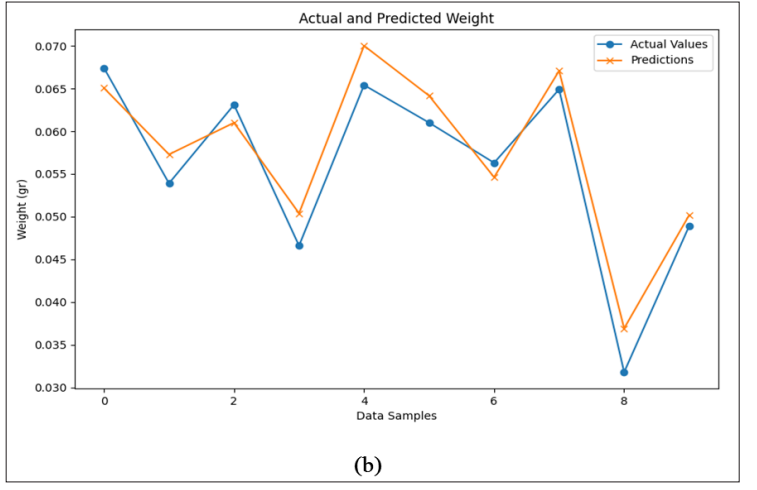
Figure 6: Some comparisons between actual and predicted wheat weights
Conclusion and Recommendations
In this study, an artificial neural network (ANN) model was developed to predict the weight of durum wheat grains using physical properties extracted through image processing techniques. The ANN model, trained using parameters such as length, width, thickness, and projection area, demonstrated high predictive accuracy. Key performance metrics, including an average Mean Squared Error (MSE) of 1.216×10⁻⁵, a Root Mean Squared Error (RMSE) of 3.34×10⁻³ grams, and an R-squared (R²) value of 8.896×10⁻¹, indicate the model’s ability to estimate wheat grain weight with minimal error.
These findings highlight the potential of integrating machine learning models with image processing techniques to streamline agricultural processes, particularly in weight estimation, which plays a critical role in post-harvest handling and mechanization. The ANN-based approach offers a reliable, scalable, and efficient method, reducing the time and cost associated with traditional manual measurements.
While the model achieved promising results, there are several areas for potential improvement and future research:
- Dataset Expansion: Increasing the size and diversity of the dataset, including different wheat varieties and environmental conditions, would enhance the model’s generalizability and robustness.
- Feature Engineering: Additional morphological features such as grain volume and shape irregularities could be incorporated to improve model accuracy further.
- Algorithmic Comparison: Exploring other machine learning algorithms, such as support vector machines (SVM) or deep learning models, might yield better performance in weight prediction tasks.
- Automation in Image Acquisition: Developing an automated image acquisition system for more consistent and standardized image capture could enhance the efficiency of the preprocessing stage.
- Real-World Implementation: Finally, integrating this predictive system into agricultural machinery for real-time weight estimation could be explored, providing immediate practical applications in farming and grain processing industries.
By addressing these areas, future research can refine the model's accuracy and adaptability, further contributing to advancements in agricultural technology and mechanization.
Conflict of Interest
Okan Uyar and Nurettin Kayahan declare that they have no competing interests.
Author Contribution
Authors have equal contributions in the preparation of all sections of the study and writing of the article.
References
- Aydogan S, Sahin M, Akcacik AG, Kaya Y, Kara I, et al. (2012) Determination of Quality Characteristics of Some Durum Wheat Varieties. Journal of Agricultural Sciences Research 82-85.
- Kendal E, Tekdal S, Aktas H, Karaman M (2012) Comparison of Some Durum Wheat Varieties in Diyarbakir and Adiyaman Irrigated Conditions in Terms of Yield and Quality Uludag University Faculty of Agriculture Journal 26: 1-14.
- Gulec TE, Sönmezoglu OA, Yildirim A (2010) Quality and Factors Affecting Quality in Durum Wheat. Journal of Agricultural Faculty of Gaziosmanpa?a University (JAFAG) 2010: 113-120.
- Aydin A (2022) Structure of Wheat Production Sector in Turkey and Production Estimation with Arima Journal of Business Economics and Management Research 5: 1-18.
- Bashimov G (2021) Economic Development Course of Wheat Production in Central Asian Journal of Agricultural Economics Research 7: 66-75.
- Gungor H, Cakir MF, Dumlupinar Z (2022) Evaluation of Advanced Bread Wheat (Triticum aestivum ) Lines in Terms of Yield, Yield Components and Quality Characteristics. European Journal of Science and Technology 123-127.
- Pala F, Mennan H, Cig F, Dilmen H (2018) Determination of Weed Seeds Mixed with Wheat Crops in Diyarbakir. Turkish Journal of Agricultural Research 5: 183-190.
- Kilic H, Hatipoglu A, Sahin M (2021) Human Health Based Bread Wheat Quality Mus Alparslan University Journal of Science 9: 857-870.
- Bilgicli N, Soylu S (2017) Sectoral Evaluation of Wheat and Flour Quality. Bahri Dagdas Herbal Research Journal 5: 58-67.
- Pehlivan A, Unver Ikincikarakaya S (2017) Quality Improvement Studies in Durum Wheat. Journal of Field Crops Central Research Institute 26: 127-151.
- Aydogan S, Sahin M, Akçacik AG, Demir B, Hamzaoglu S, et (2019) Investigation of Quality Characteristics of Some Durum and Bread Wheat Varieties. Journal Of Agriculture and Nature 22: 264-271.
- Altuntas E, Erdogan M (2017) Determination of some physical properties of allspice (Pimenta dioica L.) fruit. Anatolian Journal of Agricultural Sciences 32: 316-320.
- Ozlu RR, Guner M (2016) Determination of Physical Properties of Canola Seeds at Different Moisture Levels. Gaziosmanpa?a University Faculty of Agriculture Journal 33: 10-24.
- Nagyne Polyak I, Csizmazia Z (2016) New methodology for measuring the floating velocity of grain Journal of Agricultural Informatics 7: 49-59.
- Cekim I, Ozarslan C (2020) Determination of Some Physico- Mechanical Properties of Lettuce Seed. COMU Faculty of Agriculture Journal 8: 89-97.
- Vurarak Y, Angin N, Bilgili ME (2012) A Study on Determining Some Effects of Different Harvesting Methods on Seed Maturation in Sesame. Journal of Agricultural Sciences Research 93-96.
- Tepecik M, Barlas NT, Ilker E (2014) Effects of Different Nitrogenous Fertilizers and Application Times on Yield and Yield Components in Wheat. Soil Studies 3: 24-30.
- Akgun I, Ulupinar U (2019) The effect of nitrogen dosage applications on yield and quality in durum wheat (Triticum durum ). Turkish Journal of Agriculture Food Science and Technology 7: 72-81.
- Kurt P, Aydogan Cifci E, Yagdi K (2015) Determination of Relationships Between Grain Yield and Some Yield Components in Bread Wheat (Triticum aestivum L). Journal of Agricultural Sciences 21: 355-362.
- Aydogan Cifci E, Dogan R (2013) The Effects of Nitrogen Doses on Yield and Quality Traits of Gediz–75 and Flamura–85 Wheat Varities. Journal of Agricultural Sciences 19: 1-11.
- Dumanoglu Z (2020) General Characteristics of Flax (Linum usitatissimum L.) Plant Seeds. Journal of Integrative and Anatolian Medicine 2: 3-9.
- Dumanoglu Z, Ozkan SS, Topcu GD (2019) Determination of Some Physical Properties of Seeds of Italian Ryegrass (Lolium multiflorum L.) International Journal of Agricultural and Wildlife Sciences 5: 292-298.
- Sayar M, Han Y (2014) Determination of Seed Yield and Yield Components of Mulberry (Lathyrus sativus ) Lines and Evaluation by GGE Biplot Analysis Method. Journal of Agricultural Sciences 21: 78-92.
- Sabanci K, Kayabasi A, Toktas A (2017) Computer vision- based method for classification of wheat grains using artificial neural Journal of the Science of Food and Agriculture 97: 2588-2593.
- Yao S, Wang B, Liu D, Jin X, Xia H, et (2023) Estimating wheat grain weight using UAV-multispectral imagery and machine learning. MODSIM2023.
- Sapirstein H, Neuman M, Wright E, Shwedyk E, Bushuk W (1987) An instrumental system for cereal grain classification using digital image analysis. Journal of Cereal Science 6: 3-14.
- Wu Y, Pan Y (2010) Cereal grain size measurement based on image processing 2010 International Conference on Intelligent Control and Information Processing 209-212.
- Razavi S, Bostan A, Rezaie M (2010) Image processing and physico-mechanical properties of basil Journal of Food Process Engineering 33: 51-64.