Thermal Performance Characterization of Battery Insulation on ATL- 1 Picosatellite Mission
© 2024 Zoltan Toth, Balazs Nagy, Peter Adam, Katalin Sinko, Otto Temesi, et al., et al. This is an open-access article distributed under the terms of the Creative Commons Attribution License, which permits unrestricted use, distribution, and reproduction in any medium, provided the original author and source are credited.
Abstract
The ATL-1 2PQ format picosatellite was a collaborative experiment involving two private companies, H-ION Research, Development and Innovation Ltd. and ATL cPlc., along with the Budapest University of Technology and Economics and the Eotvos Lorand University. This mission spanned approximately 10 months during which ATL-1 orbited in low Earth orbit. The aim of the project was the development of functional test used for the thin-layer insulation of the batteries. Three different, aluminium oxide-based, specially structured newly developed and manufactured thermal insulation materials were used to insulate the batteries. These three materials were as follows: porous fibre, composite, and cryogel, in addition to the Kapton foil used as reference material. The primary objective of this study was to investigate the thermal behaviour of these experimental materials in relevant space environment and to identify the most effective insulating material. The temperature cycling resulted in by orbiting the Earth were also investigated. Thermal insulating intensity of the materials was also determined from the temperature dataset to identify the most effective thermal insulator. Results show that porous fibre consistently outperformed the other materials on each side of the batteries, in agreement with the results of the pre-flight laboratory tests. The study also includes an analysis of the response time of the temperature to the appearance and disappearance of solar irradiation. Behaviour of this quantity is also correlated strongly with the materials of better thermal characteristics.
Introduction
The ATL-1 2PQ format picosatellite was a collaborative experiment involving two private companies, H-ION Ltd. and ATL cPlc., along with the Budapest University of Technology and Economics and the Eotvos Lorand University. Figure 1 shows the coordinate system of ATL-1. Accordingly, the six sides of the satellite were X+, X−, Y+, Y−, Z+ and Z−. The architecture is shown in Figure 2. The mission spanned approximately 10 months: it was launched on 2nd December 2019 and re-entered the terrestrial atmosphere on 9th October 2020. Orbital period of ATL-1 was 92 minutes (or not more than 1 minute shorter in some periods) which value decreased very slightly for most part of the mission and started to decrease considerably in second half of September only, as it can be seen on Figure 3. For instance, the orbital period was still 90.98 minutes on 1st August, 90.60 on 1st September and 89.65 on 1st October. For the satellite’s last stable orbit, it was 87.27 minutes on 9th October. The inclination was 83.05° to the equatorial plane, and consequently 106.55° to the orbital plane of Earth. The orbital plane has not varied during the 10 months of the mission. ATL-1 orbited at an initial mean altitude of 387 km which value continuously decreased and its last, still stable altitude was around 300km. Variation of the mean altitude, the perigee and the apogee during the mission is shown in Figure 4 Perigee and apogee decreased with a bimodal periodicity as it can be seen in Figure 4. The period was 95 days, maximum apogee was 425 km, and maximum perigee was 366 km. At its last stable orbit, ATL-1’s mean altitude was 157 km, the perigee and apogee was 102 km and 208 km, respectively. Duration of daytime (the interval when the satellite was irradiated by the Sun) and nighttime (the interval when it was in the Earth’s shadow) varied very slightly and slowly during the mission as shown in Figure 3. Maximum and minimum daytime durations were found to be 61.67 and 59.44 minutes, respectively, while the same two value for nighttime were 31.82 and 30.13 minutes, respectively.
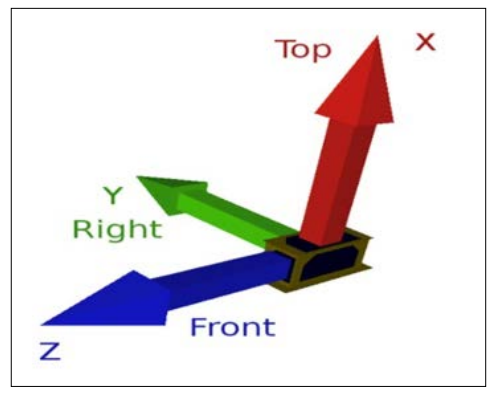
Figure 1: The Coordinate System of ATL-1
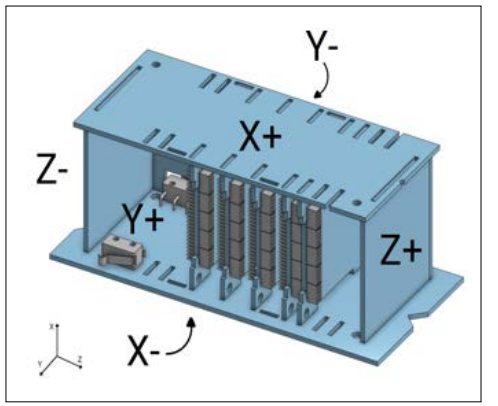
Figure 2: Architecture of ATL-1
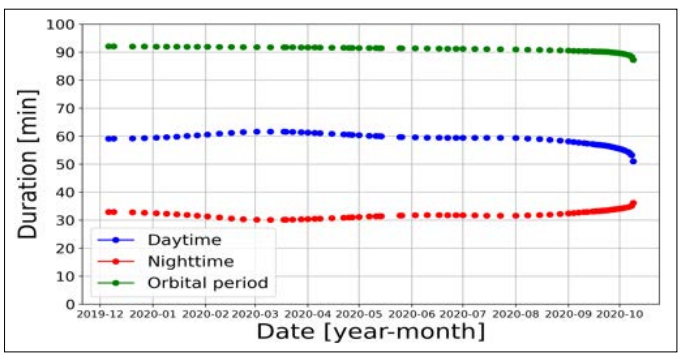
Figure 3: Orbital Period and Duration of Daytime and Night time on ATL-1
Data Availability and Data Used
Because of difficulties in data transfer, the quality of measured data does not meet the highest standards for the whole period of the mission. To provide high reliability data for the data analysis, the interval with the highest reliability was selected by performing a data quality study. Based on it, the period between 18th March 2020 and 14th May 2020 was selected. The most commonly used method for investigating the long-term behaviour of the characteristics of natural environmental process on any physical/ technical-physical system is day-based data processing and data evaluation. Although, there are no days on the satellite in the terrestrial sense, we followed this well-established strategy, but where necessary, we naturally took into account the cyclicity of the satellite’s motion according to the day-night variations of ATL-1.
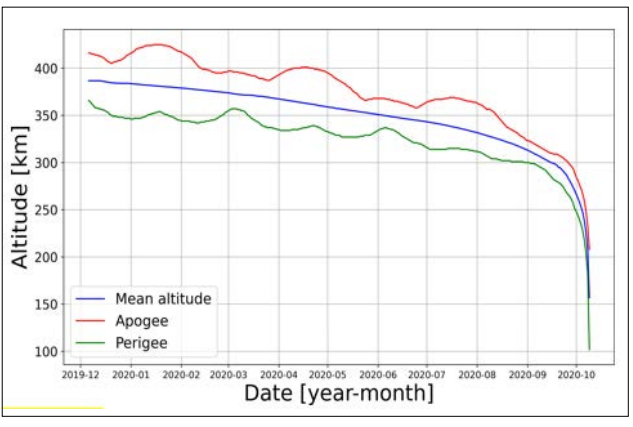
Figure 4: Mean Altitude, Perigee and Apogee of ATL-1
Experimental
In an experimental setup, four batteries were each encased in a custom-made housing constructed from copper. These housings were designed with precise dimensions of 40.0 mm in length, 31.5 mm in width, and 9.3 mm in height, featuring a wall thickness of 0.3 mm. The batteries used were Samsung IA-BP85A types, which after removal of the original plastic covers and electrodes, underwent modifications. New electrodes were attached using spot welding techniques, and Surface-Mount Device (SMD) type PT100 thermal resistors were affixed to four distinct sides of each battery to monitor temperatures. An additional thermal resistor was affixed to each battery board as reference (uninsulated). These resistors were secured in place using UV light-activated glue. To ensure that each battery was perfectly centered within its copper house, custom-made spacers crafted from PEEK (polyether ether ketone) were utilized. The design included four pin-like spacers at the base and two truncated cubes at the top of the housing. This arrangement not only ensured centralization but also enhanced the mechanical stability of the housed battery packs. The space between each battery and its copper housing was filled with different insulating materials, aimed at evaluating their thermal insulation properties. The materials tested included: (i) 100% aluminium oxide (ALOX) fibres containing nano-sized pores , (ii) ALOX cryogelics with an ordered pore structure, (iii) a composite material of ALOX fibres and cryogel, and (iv) a reference material of 10 m thick Kapton tape (polyimide) [1-2]. The dimensions of the batteries are 35.2x27.7x7.0 mm. The dimensions of the battery houses are: 40.0x31.5x9.3 mm the wall thickness was 0.3 mm. The batteries were geometrically centralised in the house, thus the design insulation thicknesses are 2.1 mm, 1.6 mm and 0.85 mm at the different sides.
Evaluation Method
Thermal Insulating Intensity
Since the thermal conductivity factor was not possible to monitor on-board, introduction of a special quantity was needed that would adequately and reliable characterise the thermal insulation properties of the materials. It was the so-called thermal insulating intensity that was determined from the measured temperature data. It is a relative quantity that was determined for all four materials and was normalised for the values obtained for the Kapton foil as reference material. The obtained values were then compared. For a certain test material m, thermal insulating intensity λ is defined as the ratio of the difference of the maximum and minimum temperature for the Kapton foil to the difference of maximum and minimum temperature for the material m, and this ratio is multiplied by 100 as follows:
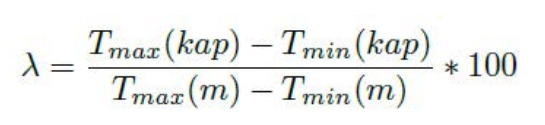
where:
T max (kap) : maximum temperature for the selected period of cycles for Kapton foil
T min (kap) : minimum temperature for the selected period of cycles for Kapton foil
Tmax(m) :maximum temperature for the selected period of cycles for material m
Tmin (m) : minimum temperature for the selected period of cycles for material m
The number of cycles used for the calculation depends on the stability of the cycle amplitude during the studied interval.
Theoretically, a “period” mentioned above would be one single cycle, but obviously the ever-present measurement uncertainty makes it worth considering a larger number of cycles. Since the cycles within any given day in the period used were almost identical, the maxima and minima were taken for a full day. On the other hand, because of the high similarity of the cycles within one day, absolute daily maximum and minimum were considered instead of the daily average of the maxima and minima, which would basically be the theoretically correct quantity.
Cyclicity of the Temperature
As presented in the Section Introduction, completing of one orbit around the Earth took 91-92 minutes for ATL-1, and consequently the measured temperatures changed with the same periodicity as the Sun was the main energy source for the satellite. Study of behaviour of the temperature cycles reveals the phenomena and differences in cyclicity compared to the theoretical case. In a theoretical case, near identical cycles would be obtained in the measured temperature throughout the satellite’s operation, with each cycle equal in duration to the period of the orbit. Since no external effects other than the solar irradiant flux has changed, the measured temperature should follow its periodicity in a regular way. Any deviation from this should be the result of a measurement error or some kind of disorder in operation of energy supply system. Consequently, stability of the temperature cycle amplitude during the mission is an indicator for the reliability and usability of the determined thermal insulating intensity values defined in the Section "Evaluation Method. Thermal Insulating Intensity". Additionally, it gives an explicit information about the variation range of the temperatures based on the temperature cycle amplitude. Differences of temperature cycle amplitude for the different materials characterise the differences in their thermal indulation performance as temperature of the most effective thermal indulator material is the less sensitive to the changes in the received solar irradiation.
Effects of Start and Termination of Solar Irradiation on the Measured Temperature During Orbiting
The solar irradiant flux instantaneously jumps from zero to a significantly high (higher than 1000 W m−2) value on ATL-1 when the satellite emerges from the Earth’s shadow and becomes irradiated, or drops from high value to zero when ATL-1 enters the Earth’s shadow. These effects result in the evolution of the temperatures measured on the batteries. Consequently, the measured temperature responds to this sudden change depending on the intensity of the insulating effect of the given material.
Accordingly, the temperature starts to increase or decrease after the solar irrradiation has appeared or disappeared after different durations for the different materials and sides. This duration after which the temperature variation changes from downward to upward after appearance of solar irradiation, and changes from upward to downward after termination of solar irradiation is defined as the response time. The change from unirradiated to irradiated state is called offsun-onsun transition, while the reverse change is called onsun-offsun transition.
Results and Discussion Thermal Insulating Intensity
Thermal insulating intensitiy for the four materials is shown in Figure 5 for 22 April. It can be clearly seen from the figures that for all days and all sides, the porous fibre has the best insulating properties. This fact is in good agreement with the results of thermal conductivity measurements having been performed in the laboratory prior launch. For three sides X+, Y −, Z−, its thermal insulating intensity is considerably higher than the other three materials, and also better, though to a lesser extent, for the sides Y +. For the former three sides, their thermal insulating intensity proved to be 20% higher than that of the Kapton foil. Cryogel also performed better than Kapton foil, and it was found to the highest extent on the same three sides where the porous fibre did. The composite outperformed the Kapton on X+ and Y −, but has a lower thermal insulation intensity on the other sides, and the difference reaches 10% on Y +. This can be explained that, following fabricating the layers, material continuity defects and inhomogeneity occurred during the ATL-1’s ascent towards its orbit. The reasons for this were found in the layer formation methodology that affected the structure of the material.
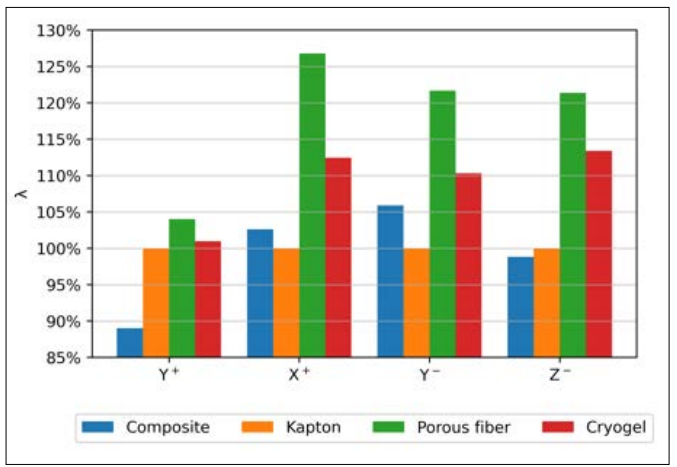
Figure 5: Thermal Insulating Intensity for the Experimental Materials
Cyclicity of the Temperature
Results of analysis of temperature dataset shows that the cyclicity of temperature is very close to the theoretical cyclicity for the whole studied period. Figure 6 shows the temperature variation for the porous fibre for 22nd April 2020. It can be seen that the cycles are almost identical showing a behaviour very close to the theroretical ideal case. The cyclicity was found to be almost the same for all the other metarials and sides. In Figure 7 daily cycle amplitudes are shown for days of the studied period for the side X+. Based on the figure, it is clear that temperature amplitude values for the porous fibre are the lowest among the four materials for each day of the studied period. Its mean value for the whole interval is 15.5 °C, while the other mean amplitudes are: composite: 18.8 °C, Kapton: 19.3 °C, cryogel: 17.3 °C. Table I summarises
Table 1: The mean (M) and stardard deviation (STD) of daily average cycle amplitudes of the temperatues (in °C) measured on the different sides and in the reference point
|
Material |
Y + |
X+ |
Y − |
Z− |
Ref |
|||||
|
M |
STD |
M |
STD |
M |
STD |
M |
STD |
M |
STD |
|
|
Composite |
18.2 |
0.61 |
18.8 |
0.62 |
17.7 |
0.61 |
18.4 |
0.62 |
22.9 |
0.76 |
|
Kapton |
16.3 |
0.57 |
19.3 |
0.60 |
18.8 |
0.68 |
18.1 |
0.60 |
20.6 |
0.72 |
|
Porous fibre |
15.6 |
0.55 |
15.5 |
0.55 |
15.7 |
0.57 |
15.1 |
0.55 |
20.2 |
0.72 |
|
Cryogel |
16.0 |
0.57 |
17.3 |
0.57 |
17.2 |
0.64 |
16.1 |
0.58 |
22.8 |
0.86 |
the mean of daily averages of the cycle amplitudes for all materials on all sides and on the reference point on battery board. Figure 8 shows the cycle amplitudes for the porous fibre for the four different sides and for the reference point. The standard deviations are very low for all four materials that confirms the high similarity of amplitudes of the individual cycles. Standard deviation is lowest for the porous fibre; its value is 0.55, while it is 0.57 for cryogel, 0.60 for Kapton and 0.62 for composite. The highest amplitude for porous fibre was 16.4°C, while it was 18.3°C for the cryogel, 19.8°C for composite and 20.2°C for Kapton. All these values indicate that the porous fibre is the most effective insulator. These results confirm the reliability and usability of the determined values of thermal insulating intensity. It is clear that mean cycle amplitudes for the reference are considerably higher than those for the insulated sides. These values show that all three in-house developed thermal insulation materials are effective insulators.
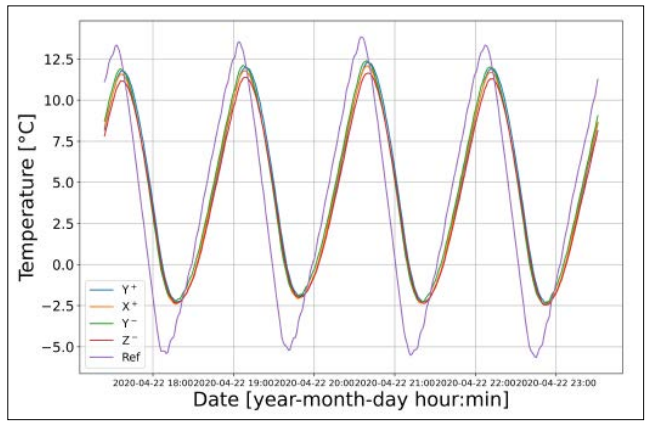
Figure 6: Example for temperature cyclicity: temperature variation for porous fibre on the four sides and on the reference point, 22 April, 2020
Effects of Start and Termination of Solar Irradiation on the Measured Temperature During Orbiting
Offsun-onsunTransition
Although the observed response times slightly differ for the different sides due to their different positions to the direction of the solar disc, the behaviour of the materials is relatively similar, but characteristic differences can still be observed as it is clear from the results discussed below. Temperature variation for porous fibre for an individual offsun-onsun transition on the four sides and on the reference are shown in Figure 9. Time elapsed from start of solar irradiation is shown in minutes on x-axis. One can see well that the temperature starts to increase considerably earlier on the uninsulated reference point than on the insulated sides. Comparison of the response times for the different materials on each side shows that porous fibre performs best. For example, on side X+, Kapton responds most rapidly (after 9 minutes of start of irradiation), then cryogel (10 min), composite (12 min), and finally the porous fibre (14 min). Calculated response times for all cycle starts in the studied period show that, despite some fluctuations, porous fibre performs best in general: its response times are the longest for most of the cycle starts for all sides. Its grand mean response time (daily mean response time values averaged for all sides) is 13 minutes (with standard deviation of 0.5), while the runner-up is the composite (12 minutes with standard deviation of 0.7). Grand mean response time of cryogel is 11 minutes (with standard deviation of 0.9). The reference material, Kapton, has the shortest mean response time (9 minutes with standard deviation of 0.5). Though it can be established that generally porous fibre performed best, there is one exception where different result was found. On side Y+, mean response time value of Kapton was the highest. Because this is the only one exception, we incline to explain it by the same reason by which the different behaviours found for the different sides are explained in case of thermal insulating intensity (Section "Evaluation Method. Thermal Insulating Intensity")
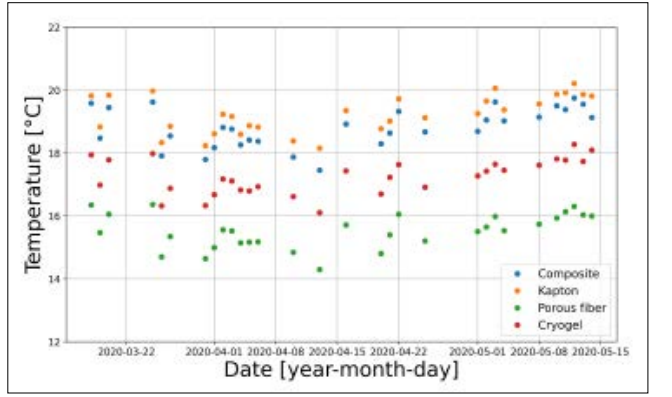
Figure 7: Daily temperature cycle amplitudes for the studied period on the side X+
Onsun-offsun Transition
To show and discuss the results for the onsun-offsun transitions, the same way is followed as in as in the Section Effects of Start and Termination of Solar Irradiation on the Measured Temperature During Orbiting Offsun-onsun Transition). The response times are shown both for the individual solar irradiation terminations of a selected day and for daily means of the studied period. Considering the response times found for start of solar irradiation, two important facts are to be noted: (i) the response times for termination of solar radiation are considerably shorter for all four materials and all sides that means that the insulating effect of the materials is significantly lower when the irradiation is terminated than in the case when it increases from zero to a high value. (ii) In this case no significant differences were found for the different materials. Additionally, however, it is also to be noted that considering the grand mean values of response times (that can be considered as suitable indicator for general behaviour), it is obvious that porous fibre performs a slightly better than the other materials as its grand mean is 4 minutes compared to 3 minutes for composite and cryogel, and 2 minutes for Kapton. The results of the studies described in this section also confirm the effectivity of our newly developed materials, because the response times are considerably shorter for the reference for all cases.
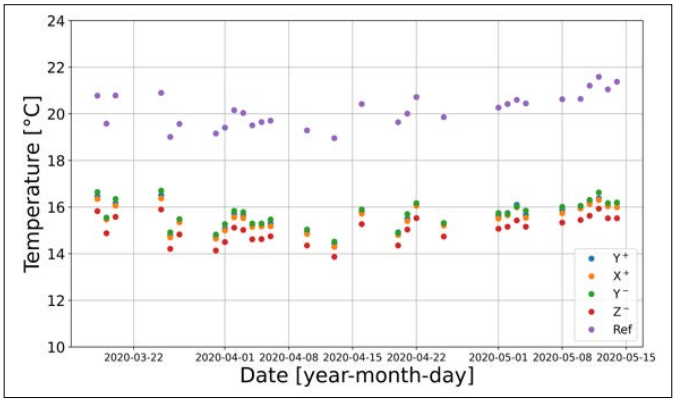
Figure 8: Temperature cycle amplitudes for the porous fibre on the different sides and on the reference
Summary
Thermal performance characterisation of four insulating materials was carried out in relevant space environment on the ATL-1 picosatellite mission. Three of them have been in-house developed, aluminium oxide-based thermal insulation materials: composite, porous fibre and cryogel. The fourth material was Kapton foil (polyimide) used as reference. The lifetime of the satellite was approximately 10 months, and despite of the difficulties of the comunication and data transfer, sufficient amount of measurement data were collected to carry out reliable data analysis. Thermal insulation properties of the materials were investigated by three types of study: (i) thermal insulating intensity, (ii) temperature cyclicity resulted in by the orbit-determined solar irradiant flux variation and (iii) response time of the temperature change to the start and termination of solar irradiation due to orbiting the Earth (“daytime-nighttime” variation for the satellite). The results obtained in the space experiment, with some minor discrepancies, are in good agreement with the results of ground- based tests carried out pre-flight in the laboratory. In lack of facility to monitor thermal conductivity factor on-board, a special quantity called thermal insulating intensity was needed to adequately and reliably characterise the thermal insulation properties of the materials (for definition, see the Section "Evaluation Method. Thermal Insulating Intensity)". Results of the data analyses carried out for all three study types mentioned above show that the porous fibre has the best thermal insulation properties, in accordance with the results of the pre-flight tests carried out in the laboratory. Most of the results of the three study types mutually confirm each other with only some exception. The exceptions are assumed to be due to the fact that, following fabricating the layers, material continuity defects and inhomogeneity occured during the ATL- 1’s ascent towards its orbit. The reasons for this phenomenon were found in the layer formation methodology that affected the structure of the material.
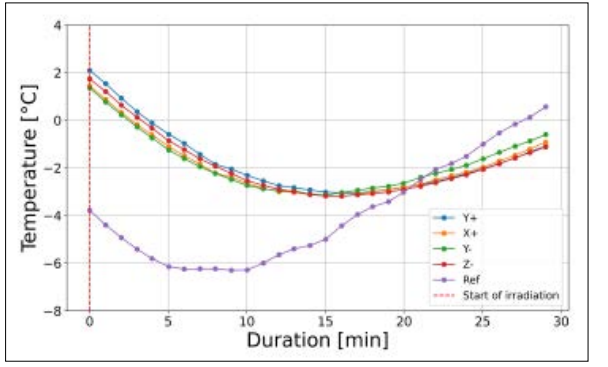
Figure 9: Temperature variation after an offsun-onsun transition on 2 May for the porous fibre
Acknowledgment
The authors would like to acknowledge the much support to Dr. Andras Gschwindt, Associate Professor of the Department of Broadband Communication and Electrical Engineering, Faculty of Engineering and Informatics, Budapest University of Technology and Economics. Furthermore, the authors would like to thank the VEKOP grant (VEKOP-2.1.1-15-2016- 00197) funded by the European Union and the Hungarian State for making this project possible.
References
- Adam P, Temesi O, Dankhazi Z, Voniatis C, Rohonczy J, et al (2022) Various colloid systems for drawing of aluminium oxide fibres. Ceramics International 48: 5499- 5508.
- Adam P, Horvath M, Sinko K (2023) Sol-gel derived porous aluminium cryogel–fibre composite systems. Journal of Molecular Liquids 380: 121755.