Quantifying the Impact: Evaluating Success Metrics and KPIs for Data Science Initiatives and ROI Optimization
© 2023 Sowmya Ramesh Kumar, et al. This is an open-access article distributed under the terms of the Creative Commons Attribution License, which permits unrestricted use, distribution, and reproduction in any medium, provided the original author and source are credited.
Abstract
In the dynamic intersection of business and technology, data science emerges as a linchpin for innovation and competitive advantage. This paper delves into the nuanced realm of success metrics and key performance indicators (KPIs) crucial for evaluating the impact and success of data science initiatives. Unveiling metrics such as accuracy, model performance, and business impact, it outlines the strategic importance of Return on Investment (ROI) and data quality in the data science landscape. This paper also provides a comprehensive guide for data scientists to implement and monitor these metrics, emphasizing the iterative nature of improvement. Illustrated through a case study on customer lifetime value (CLV), the piece underscores the role of success metrics in optimizing outcomes, showcasing the significance of continuous monitoring and improvement for organizations venturing into data-centric endeavors
Introduction
In the rapidly evolving landscape of business and technology, data science has emerged as a critical driver of innovation and competitive advantage. Organizations invest heavily in data science initiatives to extract valuable insights from vast datasets, enhance decision-making processes, and ultimately, achieve a positive return on investment (ROI). As an expert data scientist, understanding and effectively measuring the ROI of data science initiatives is paramount. In this article, we will delve into the intricacies of success metrics and key performance indicators (KPIs) that play a pivotal role in gauging the impact and success of data science projects.
Defining Success Metrics
Success metrics are the yardsticks by which the effectiveness and impact of data science initiatives are measured. They provide a quantitative and qualitative assessment of how well a project aligns with organizational goals. The selection of success metrics is contingent upon the specific objectives and nature of the data science project. Common success metrics for data science initiatives include [1]:
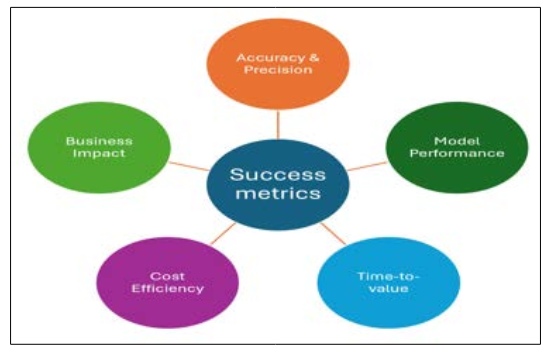
Figure 1: Success Metrics for Data Science Projects
Accuracy and Precision
Accuracy measures how close a model's predictions are to the actual outcomes. Precision gauges the model's ability to make correct positive predictions.
Model Performance
Metrics such as precision, recall, F1 score, and area under the receiver operating characteristic (ROC) curve are crucial for evaluating the performance of machine learning models.
Time-to-Value
Measures the time taken for a data science initiative to deliver actionable insights or tangible results.
Cost Efficiency
Evaluates the cost-effectiveness of the data science project in terms of resource utilization, infrastructure costs, and overall budget adherence.
Business Impact
Examines how well the insights generated by data science contribute to achieving business objectives, such as revenue growth, cost reduction, or customer satisfaction.
Key Performance Indicators (KPIs)
While success metrics offer a broad view of a project's effectiveness, KPIs provide more specific and quantifiable benchmarks that align with organizational objectives [2]. KPIs serve as vital indicators of progress and success throughout the lifecycle of a data science initiative. Here are some key KPIs that data scientists should consider:
Return on Investment (ROI)
The ultimate KPI, ROI calculates the net gain or loss generated by the data science initiative compared to the investment made. It considers both the financial and non-financial benefits.
Data Quality
KPIs related to data quality, such as completeness, accuracy, consistency, and timeliness, ensure that the input data meets the required standards for meaningful analysis.
Model Deployment Time
Measures the speed at which models are deployed into production, as faster deployment often correlates with quicker realization of value.
User Adoption and Engagement
Tracks the extent to which end-users within the organization are adopting and engaging with the insights generated by data science models.
Scalability
Assesses the ability of the data science solution to scale with increasing data volumes and user demands, ensuring continued relevance and impact.
Risk Mitigation
Evaluates the effectiveness of data science in identifying and mitigating risks, enhancing decision-making processes that lead to risk reduction.
Implementing and Monitoring Success Metrics and KPIs
Implementing and Monitoring Success Metrics and KPIs Successful implementation and monitoring of successful metrics and KPIs require a strategic and iterative approach [3]. Here's a step-by-step guide for data scientists:
Implementing and Monitoring Success Metrics and KPIs Successful implementation and monitoring of successful metrics and KPIs require a strategic and iterative approach [3]. Here's a step-by-step guide for data scientists:
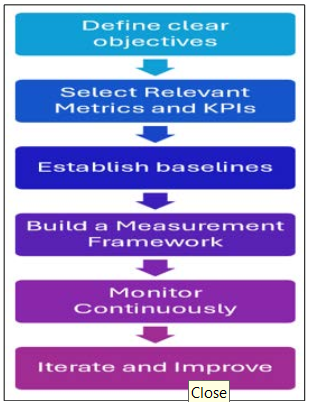
Figure 2: Step-by-Step Guide to Measure Success for Data Scientists
Define Clear Objectives
Clearly articulate the objectives of the data science initiative. These objectives should align with the broader goals of the organization.
Select Relevant Metrics and KPIs
Choose success metrics and KPIs that directly measure progress toward the defined objectives. Consider both short-term and long- term indicators.
Establish Baselines
Set baseline values for selected metrics and KPIs to provide a point of comparison for future assessments. This baseline is essential for gauging improvement or decline.
Build a Measurement Framework
Develop a robust measurement framework that outlines the data collection processes, tools, and frequency of assessments for each metric and KPI.
Monitor Continuously
Implement continuous monitoring mechanisms to track the performance of data science initiatives in real-time. Regularly update stakeholders on progress and address any deviations from expected outcomes promptly.
Iterate and Improve
Use the insights gained from monitoring to iterate and improve the data science models, algorithms, and processes. Continuous improvement is key to optimizing ROI over time.
Case Study: A Data-Driven Approach to Customer Lifetime Value (CLV)
Establishing success metrics for a data science initiative focused on optimizing Customer Lifetime Value (CLV) requires a careful consideration of key factors influencing customer behavior, retention, and overall value. Here are some essential success metrics that data scientists can use to measure the effectiveness of their efforts in maximizing CLV [4]:
Customer Retention Rate
The percentage of customers retained over a specific period.
Importance
A higher retention rate indicates that the data-driven strategies implemented are effectively keeping customers engaged and loyal.
Churn Rate
The rate at which customers discontinue their relationship with the company.
Importance
A lower churn rate signifies successful efforts in preventing customers from leaving, contributing positively to CLV.
Average Order Value (AOV)
The average value of orders placed by customers.
Importance
An increase in AOV suggests that personalized marketing strategies or upselling efforts are influencing customers to spend more, directly impacting CLV.
Purchase Frequency
How often, on average, a customer makes a purchase within a specific timeframe.
Importance
Higher purchase frequency indicates sustained customer engagement and contributes to the overall CLV.
Customer Segmentation Metrics
Metrics related to the behavior and preferences of different customer segments (e.g., high-value customers, at-risk customers).
Importance
Understanding the performance of data-driven strategies across different customer segments helps in tailoring approaches to maximize CLV for each group.
Customer Satisfaction Scores (CSAT) and Net Promoter Score (NPS)
Metrics reflecting customer satisfaction and likelihood to recommend the brand
Importance
Satisfied customers are more likely to remain loyal and contribute positively to CLV
Customer Acquisition Cost (CAC)
The cost incurred to acquire a new customer.
Importance
Lowering CAC while maintaining or increasing CLV ensures a positive return on investment and efficient resource allocation.
Customer Engagement Metrics
Metrics related to customer interactions, such as clicks, views, and time spent on the platform.
Importance
Higher engagement indicates that customers find value in the platform, which can lead to increased CLV.
CLV to CAC Ratio
The ratio of Customer Lifetime Value to Customer Acquisition Cost.
Importance
A ratio greater than 1 indicates that the value a customer brings over their lifetime exceeds the cost of acquiring them, demonstrating a positive impact on the business.
Predictive Model Accuracy
The accuracy of predictive models in forecasting customer behavior, including future purchases and likelihood of churn.
Importance
Higher accuracy ensures that data-driven strategies are based on reliable predictions, contributing to successful CLV optimization.
Incrementality Metrics
Metrics assessing the incremental impact of data-driven strategies compared to a control group.
Importance
Understanding the incremental contribution of data science efforts helps in attributing changes in CLV to specific interventions.
Cross-Sell and Upsell Success Rates
The success rates of cross-selling and upselling initiatives.
Importance
Successful cross-selling and upselling contribute to increased transaction values and, consequently, higher CLV.
By establishing and regularly monitoring these success metrics, data scientists can gauge the effectiveness of their data-driven strategies in optimizing Customer Lifetime Value. The iterative process of refining models and strategies based on these metrics will contribute to the continuous improvement of CLV optimization efforts.
Conclusion
Measuring the ROI of data science initiatives is a multifaceted process that requires a combination of success metrics and key performance indicators. As an expert data scientist, the ability to define clear objectives, choose relevant metrics, and implement a robust measurement framework is essential for demonstrating the impact of data science projects. By continuously monitoring and iterating based on insights gained, organizations can optimize the ROI of their data science initiatives, driving innovation, and maintaining a competitive edge in an increasingly data-centric world [5].
References
- Martinez I, Viles E, Olaizola IG (2021) A survey studyof success factors in data science projects. In 2021 IEEE International Conference on Big Data 2313-2318.
- Thakur R Beck, Mostaghim S, GroBmann D (2020) Survey into predictive key performance indicator analysis from data mining perspective. 2020 25th IEEE International Conference on Emerging Technologies and Factory Automation (ETFA),Vienna, Austria 476-483.
- Stelmaszak M, Kline K (2023) Managing Embedded Data Science Teams for Success: How Managers Can Navigate the Advantages and Challenges of Distributed Data Science.Harvard Data Science Review 5: 1-14.
- Jose Ramon Saura (2021) Using Data Sciences in Digital Marketing: Framework, methods, and performance metrics. Journal of Innovation & Knowledge 6: 92-102.
- Miksa T, Cardoso J, Borbinha J (2018) Framing the scope of the common data model for machine-actionable data management plans. In 2018 IEEE International Conference on Big Data 2733-2742.