Mathematical Modeling and Forecast 11 Years in Advance of the Dumping of Sand in Varadero Beach, Cuba, Using the Regressive Objective Regression (Ror) Methodology
© 2021 Ricardo Oses Rodriguez, et al. This is an open-access article distributed under the terms of the Creative Commons Attribution License, which permits unrestricted use, distribution, and reproduction in any medium, provided the original author and source are credited.
Abstract
The specialists estimate that the most important challenge on the beaches is the dumping of sand. Sustainable tourism in our time must be conceived towards the future to ensure that resources are managed with due protection of ecological processes, biological diversity and the environment in general, hence our objective is to know the amount of the following sand dumps on the beach of Varadero mathematically modeling according to the data we have. A database of the dumping of cubic meters of sand in Varadero was used from 1987 to 2012, the methodology used was the Regressive Objective Regression (ROR). We can conclude that the model explains 100% of the variance with an error that cannot be determined, over time, all the variables are significant, the model depends on the shedding twelve times ago (Lag12Vert). In the long term, resources can be saved and the resilience of coastal communities to climate change and rising sea levels can be improved, maintaining the quality indicators required of the sand strip for the enjoyment of bathers and protection of the dunes. The forecast obtained for the next discharges has a maximum of 2,225,140.6 m3, in t50 discharge, a value this May that the discharge occurred before 2012.
Introduction
The beaches are not only potential for the development of tourist activity but also constitute natural barriers to protect the coastal area from the rising sea and the waves derived from various meteorological phenomena such as hurricanes.
Cuba has had a special interest in preparing to face this reality, and a reliable example is the state plan to confront climate change (Tarea Vida), approved by the Cuban government in April 2017.
In Cuba, of some 430 sandy beaches, it has been detected that more than 80% present symptoms of erosion. And it is valid to note that human activity such as the extraction of sand for various purposes has a great influence on these processes.
Since the 70s in Varadero, research has been carried out on the design and execution of artificial sand discharges from which the strip of sand was expanded and maintained with the required quality indicators for the enjoyment of bathers and protected dunes.
The specialists estimate that the most important challenge is the dumping of sand. Sustainable tourism in our time must be conceived towards the future to ensure that resources are managed with due protection of ecological processes, biological diversity and the environment in general, hence our objective is to know the amount of Following sand dumping on Varadero beach, mathematically modeling according to the data we have, this will bring an application of science to improve the resilience of coastal communities to climate change and rising sea levels [1].
Materials and methods
A database of the dumping of cubic meters of sand in Varadero from 1987 to 2012 was used, taken from the newspaper Juventud rebelde of August 4, 2019, with the title Safeguarding the beaches, in the science supplement, which is shown below (Table 1). The Objective Regressive Regression (ROR) methodology was used [2-4]. A forecast is made 11 years in advance of the dumping of sand, this period is selected because it is the 11-year cycle that the sun changes and therefore conditions all the processes on planet earth.
Table 1: Dumping of cubic meters of sand in Varadero
|
|
Year |
Shedding (m3) |
|
1 |
1987 |
50000 |
|
2 |
1988 |
61000 |
|
3 |
1990 |
204000 |
|
4 |
1991 |
195000 |
|
5 |
1992 |
178000 |
|
6 |
1996 |
40000 |
|
7 |
1997 |
35000 |
|
8 |
1998 |
1087835 |
|
9 |
2000 |
2494 |
|
10 |
2002 |
6800 |
|
11 |
2003-2004 |
460000 |
|
12 |
2008 |
136934 |
|
13 |
2009 |
394969 |
|
14 |
2010 |
142382 |
|
15 |
2012 |
413779 |
|
16 |
Next |
|
|
Total N |
16 |
15 |
Results and Discussion
In figure 1 it can be seen that the highest dumping occurred in 1998 with 1087835 m3 of sand with a historical average of 227212.87 m3 with a standard deviation of 281229.478 m3, the minimum occurred in 2000 with 2494 m3.
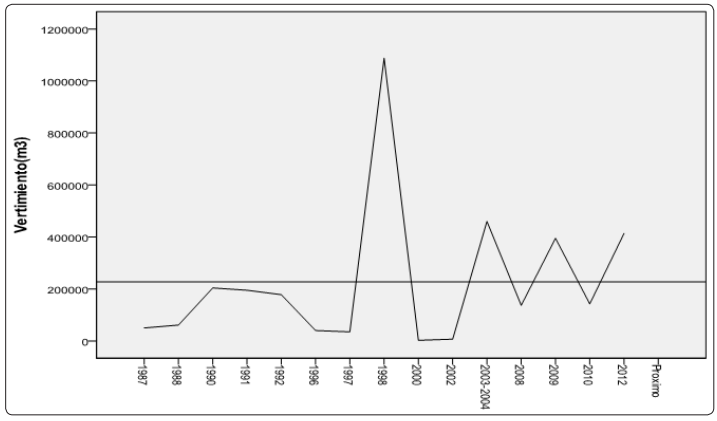
Figure 1: Behavior of sand dumping in Varadero by years
In table 2 the ROR model obtained for the dumping of sand in Varadero. This model explains 100% with an error that cannot be determined, Fisher’s F cannot be determined because a division by zero is proposed in the statistics, the model depends on the shedding in twelve back shedding (Lag12Vert), it actually corresponds to 11 years ago as the short-term model depends on shedding one step back.
Table 2: Model obtained for the dumping of sand in Varadero
Coefficients
|
Model |
Non-standardized coefficients |
Standardized coefficients |
t |
Sig. |
|
|
B |
Standard error |
Beta |
|||
|
1 DI Lag12Vert |
18653,966 2,028 |
,000 ,000 |
,043 ,987 |
. . |
. . |
a.Dependent variable: Shedding (m3)
b.Linear regression through the origin
The forecast obtained for the next discharges according to the forecast by year is the last one made according to the data. Table 3 and figure 2.
Table 3: Result of the forecast for the next discharge
Case summaries
|
|
Year |
Forecast year |
Shedding (m3) |
Shedding forecast |
Unstandardized Residual |
|
1 |
1987 |
. |
50000 |
. |
. |
|
2 |
1988 |
. |
61000 |
. |
. |
|
3 |
1990 |
. |
204000 |
. |
. |
|
4 |
1991 |
. |
195000 |
. |
. |
|
5 |
1992 |
. |
178000 |
. |
. |
|
6 |
1996 |
. |
40000 |
. |
. |
|
7 |
1997 |
. |
35000 |
. |
. |
|
8 |
1998 |
. |
1087835 |
. |
. |
|
9 |
2000 |
. |
2494 |
. |
. |
|
10 |
2002 |
. |
6800 |
. |
. |
|
11 |
. |
. |
460000 |
. |
. |
|
12 |
2008 |
. |
136934 |
. |
. |
|
13 |
2009 |
. |
394969 |
101416,42157 |
293552,57843 |
|
14 |
2010 |
2010,00000 |
142382 |
142382,00000 |
,00000 |
|
15 |
2012 |
2012,00000 |
413779 |
413779,00000 |
,00000 |
|
16 |
. |
2013,03622 |
. |
414178,00980 |
. |
|
17 |
. |
2015,03622 |
. |
361042,46078 |
. |
|
18 |
. |
2015,06036 |
. |
99787,10294 |
. |
|
19 |
. |
2020,09658 |
. |
70991,49510 |
. |
|
20 |
. |
2020,12072 |
. |
2225140,62483 |
. |
|
21 |
. |
2022,12072 |
. |
5058,65111 |
. |
|
22 |
. |
2023,15694 |
. |
32446,59902 |
. |
|
23 |
. |
2026,16901 |
. |
933031,07843 |
. |
|
24 |
. |
. |
. |
296401,09111 |
. |
|
25 |
. |
2032,24145 |
. |
801126,85221 |
. |
|
26 |
. |
2032,26559 |
. |
307451,42440 |
. |
|
Total N |
14 |
12 |
15 |
14 |
3 |
a.Limited to the first 100 cases.
In figure 2 the graph of the actual and predicted values, the 5th discharge is the highest predicted in the data series with a value of 2,225,140,624 m3, corresponding to the year 2020.
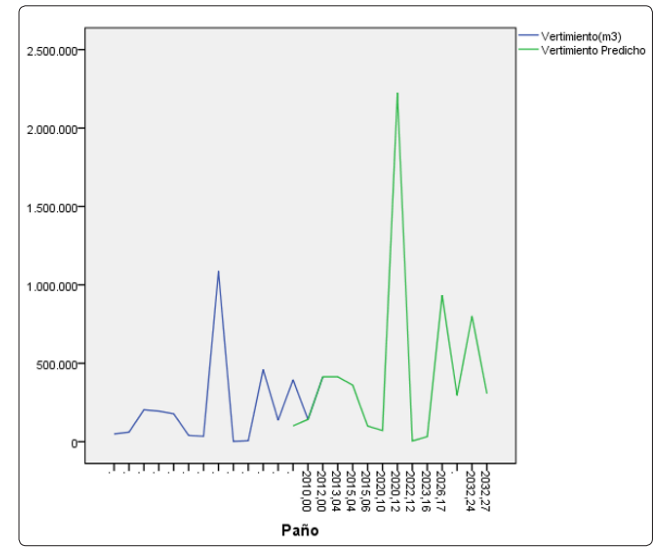
Figure 2: Real value of the discharge and value predicted by the model according to predicted year (Cloth).
Conclusions
We can conclude that the model explains 100% of the variance with an error that cannot be determined over time, all the variables are significant, the model depends on the shedding twelve times ago (Lag12Vert), with a forecast at very More certain long-term resources can be saved and the resilience of coastal communities to climate change and sea level rise can be improved, maintaining the quality indicators required of the sand strip for the enjoyment of bathers and the protection of the dunes. The forecast obtained for the next discharges expresses that the highest value must occur for the 5th discharge after 2012.
References
- Anamaria Domínguez Cruz, Hugo García Férnandez (2019) Safeguarding the Beaches. Technical scientific supplement of Juventud rebelde, 228, Sunday, August 4,
- Ricardo Osés Rodríguez, José Lannacone, Anai Carmenate Ramírez, Lorenzo Diéguez Fernández, Ramón González González, et al, (2017) “Modeling and prediction up to 2020 for total angiostrongylosis using objective regression regression”. Villa Clara, Cuba The Biologist (Lima) 15:1-6.
- Ricardo Oses Rodríguez, Rigoberto Fimia, Meylin Otero (ROR) modeling applied to forecasts. Prediction of the future. Editorial Academica Española (EAE) .ISBN: 978-613-9- 43739-9.
- Ricardo Osés Rodríguez, Jaime Wilfrido Aldaz Cárdenas, Rigoberto Fimia Duarte, Jorge Jagger Segura Ochoa, Iosbel Burgos Alemán, et al. (2018) “How regressive objective regression methodology finds information beyond a white noise” International Journal of Current Research in Life Sciences 7: 2257-2261.