Employment of RPA (Remotely Piloted Aircraft) in Identifying Imperfections in the Asphalt Pavement of the Transoeste Bus Rapid Transit (BRT) System
© 2023 Joao Victor Da Conceicao Miranda, Hélio Lopes Guerra Neto, Leonardo Vieira Barbalho, Rodolfo Vale Bocafoli Righi, Sergio Orlando Antoun Netto, et al. This is an open-access article distributed under the terms of the Creative Commons Attribution License, which permits unrestricted use, distribution, and reproduction in any medium, provided the original author and source are credited.
Abstract
The Brazilian Road network is constantly used by the population and its maintenance is an essential charge to ensure the performance of the pavement. Therefore, the verification of asphalt conditions is extremely relevant to analyze their structural and functional qualities. It is noteworthy that this verification is usually performed by technicians manually being the results slow and often with impalpable and partial analysis. Given this, we see the need to study the benefits of obtaining this information indirectly without the need for inloco man. In this work we will focus on the use of Remotely Piloted Aircraft System to obtain the images that will enable the analysis of asphalt conditions. The place where the study will take place is the corridor of BRT Transoeste in Rio de Janeiro, which connects the region of Barra da Tijuca to Santa Cruz and Campo Grande, passing through Guaratiba and Recreio dos Bandeirantes. The following procedures will be adopted: Flight Planning with RPAS observing GSD Ground Sample Distance advocated by the scientific literature, field support using GNSS NTRIP technology, processing of images obtained with the use of Agisoft software and generating Orthorectified Orthophoto. Finally, the main objective of the work is to verify the potential of the metric quality of the images from RPAS in identifying damage to the asphalt surface.
Introduction
The Law No. 12.587, of January 3, 2012, established the guidelines of the National Urban Mobility Policy, aiming at integration between different modes of transport and improving accessibility and mobility of people and cargo in the Municipality's territory. According to article 3 of the aforementioned law, the National Urban Mobility System is the organized and coordinated set of modes of transport (motorized or not), services and infrastructure, which guarantees the movement of people and cargo within the Municipality's territory. These are urban mobility infrastructures: roads and other public places, including metro railways, waterways and cycle paths; as well as road and traffic signage; among others. The main body responsible for transport infrastructure in Brazil is the National Department of Transport Infrastructure (DNIT).
Highway conservation comprises a set of operations that aim to preserve the characteristics of highway facilities, whether by standard or by regulatory agency rules [1].
Classical imaging, whether by satellite or by aircraft, often burdens engineering work. Related to this, there is the need for team movement to the field and timely analysis of possible damage or not. With this, a technical assessment using low-cost technology makes it possible to certify in less time the appropriate locations to be repaired. The work carried out on Remotely Piloted Aircraft Systems (RPAs) shows that the main studies discuss the versatility of operations of the most diverse models, especially multirotors, evaluating the main characteristics of the equipment and its potential applications, whether in civil construction or related areas [2].
Several works are found in the literature whose objective is to detect defects in asphalt pavements from aerial images obtained by
RPAs, whether using neural networks, techniques related to texture, and even some that make use of more modern techniques such as Machine Learning [3]. Nowadays in literature we can that RPAS constitute an emerging technology in the transport context [4,5]. According to the authors, sensors embedded in RPAs constitute a new and economical source of information for remote sensing. Since 2003, the Transport area has been evaluating the use of RPAs technology in different applications, such as, for example, the effectiveness of using RPAS in controlling avalanches and snow on roads [6]. RPAS is a technology resulting from disruptive innovation that has significantly increased efficiency and productivity in various sectors of the economy, such as Engineering, Environment, Precision Agriculture, Energy, Mining, Cartography, Archeology, Public Security, among others. The use of geotechnologies is increasingly present in engineering work because it is a quick way to acquire information and, in the specific case of RPAS, has a low implementation cost. Furthermore, there is the benefit of temporal resolution, which in the case of RPAs is almost instantaneous, given that, whenever there is interest in imaging a certain area, there is the possibility of carrying it out in the short term. Unlike satellite imaging, where obtaining images of the study area, if it is not currently on its route, is restricted to a new orbit passage for imaging. One must also consider the spatial resolution that perfectly suits engineering projects to the point of identifying elements at a centimeter level. Given this, we see the need to study the benefits of obtaining this information indirectly without the need for humans “on site”. This work will focus on the use of RPAs to obtain images that enable analyzes of asphalt conditions. The chosen work region has been suffering from problems related to lack of maintenance. It should be noted that, as reported in the written and spoken midia in January 2021, it was estimated that the Bust Rapid Transit (BRT) TransOeste track alone had around 400 holes, apart from the undulations in the asphalt. Therefore, the initial focus of this study is the TransOeste BRT corridor. However, the aforementioned study can be extended to the extensive road network existing throughout the national territory.
Methodology
The methodology adopted for the development of the project in question consisted of several sequential steps that correspond to the project implementation phases, as highlighted in the diagram in figure 1.
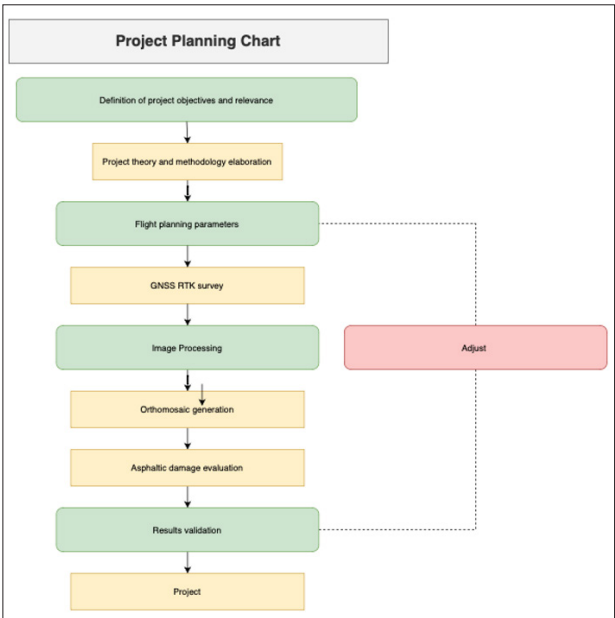
Figure 1: Project Development Stages Source: Authors (2023)
Next, the main materials and methods that were used in this research will be presented, considering the study area, the motivation for choosing the area to carry out the work in question, as well as the specifications of the equipment and software used in the entire mapping process. It is worth remembering that to classify defects, the DNIT 005/2003 standard was used [1]: Defects in flexible and semi-rigid pavements: terminology. They are classified as: crack (fissure, crack, isolated crack and interconnected crack), subsidence (plastic and consolidation subsidence), ripple, slip, exudation, wear, pan and patch (deep and superficial).
Study Area
BRT represents articulated transport that travels in an exclusive corridor and, therefore, is a faster travel alternative for passengers. In the city of Rio de Janeiro, the BRT was inaugurated in June 2012, with the TransOeste corridor, connecting the neighborhoods of Santa Cruz and Barra da Tijuca. The system also has two other corridors: TransCarioca and TransOlímpica, opened, respectively, in 2014 and 2016 (Figure 2). The place where the study was carried out is a section of the BRT Transoeste corridor in Rio de Janeiro, which connects the Barra da Tijuca to Santa Cruz and Campo Grande, passing through Guaratiba and Recreio dos Bandeirantes. Within this corridor, the study area in question is the connection between Pontal station, to Dom Bosco station, which corresponds to a strip approximately 750m long, indicated by the red fill yellow rectangle below.
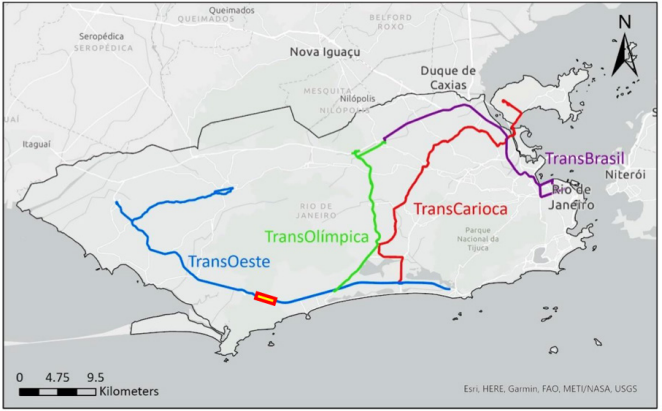
Figure 2: Location of Study Area Source: Adapted from [7]
RPAS
For the images aquisition, the RPAS Phantom 4 Pro from the DJI brand, owned by one of the authors of the article, was used (Figure 3). The aircraft is equipped with a 20-megapixel 1-inch sensor capable of recording 4K video. Additionally, its Flight Autonomy system includes two rear vision sensors and infrared detection systems for a total of 5 obstacle detection directions and 4 obstacle avoidance directions. Along with the radio control, a smartphone was used that connects to the radio control via Bluetooth technology to upload data. This device was used to upload flight plans and monitor the BRT Transoeste mapping process. The PIX4D Capture software was used for flight planning and for monitoring during the Phantom 4 Pro flight, the application used was DJI GO 4. identification as ONRJ, located inside the National Observatory in Rio de Janeiro (SAT Code: 93921.37), since with the distance between the reference station and the study area of approximately 30 km, it was possible to obtain results with horizontal and vertical accuracies of less than 5 and 7 cm, respectively.
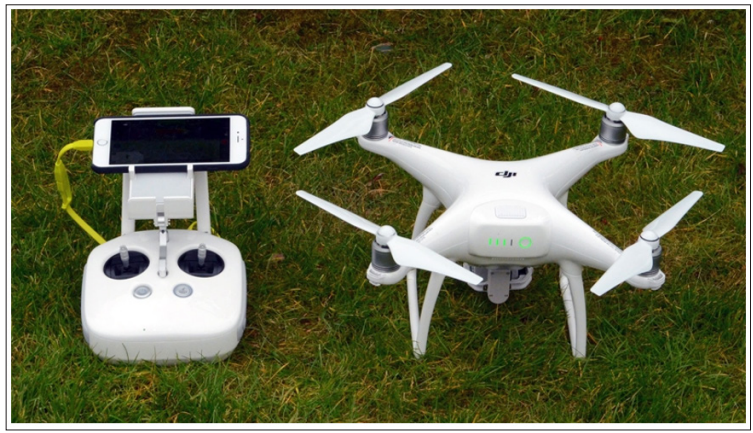
Figure 3: RPA Equipment used Source: Adapted from [8]
Field Survey
Real-time relative positioning called Real-Time Kinematic (RTK) has been widely used, as it allows the user to determine their accurate position in real time [9]. This method can achieve centimeter accuracy, without the need for further data processing, if the solution to the ambiguities obtained is reliable [10]. In network RTK, instead of just one reference station, there are several continuous monitoring stations connected to a central server, from which correction data is distributed to mobile receivers via the Internet (Figure 4) [11].
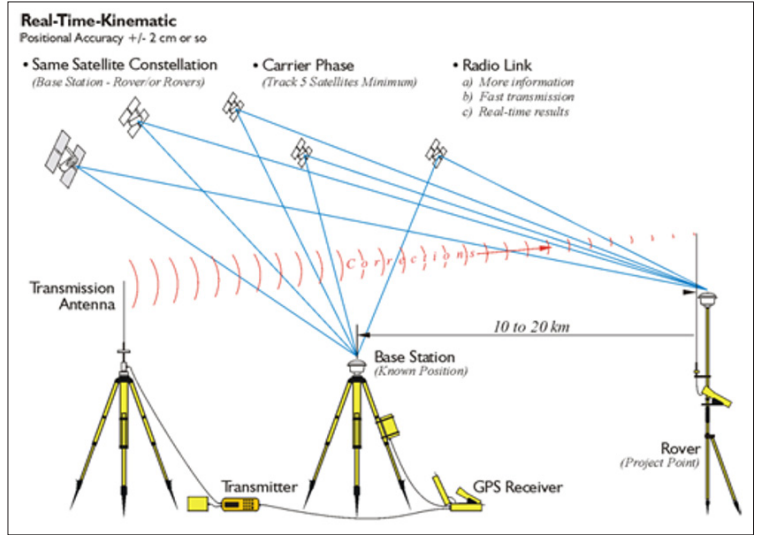
Figure 4: Network RTK Method Source: Adapted from [12]
A network RTK service is provided free of charge by Brazilian Institute of Geography and Statistics (IBGE), which provides correction data via the Internet protocol known as Networked Transport of RTCM (Radio Technical Committee for Maritime Service) via Internet Protocol – NTRIP [11]. The possibility of performing kinematic relative positioning in real time, using this service, has greater precision in locations located close to reference stations of the Brazilian Network for Continuous Monitoring of GNSS Systems (RBMC). To collect the mapping control points, a CHC brand GNSS X900U+ receiver was used (Figure 5), it is a Post-Processed GNSS with 432 channels and the possibility of correction via RTK NTRIP [13]. In the field, when using the GNSS receiver following the surveyed path, the collected coordinates are corrected and sent via the cell phone's internet, constantly through the GNSS base, which in the case of the work in question, was the RBMC (Brazilian Continuous Monitoring Network) station
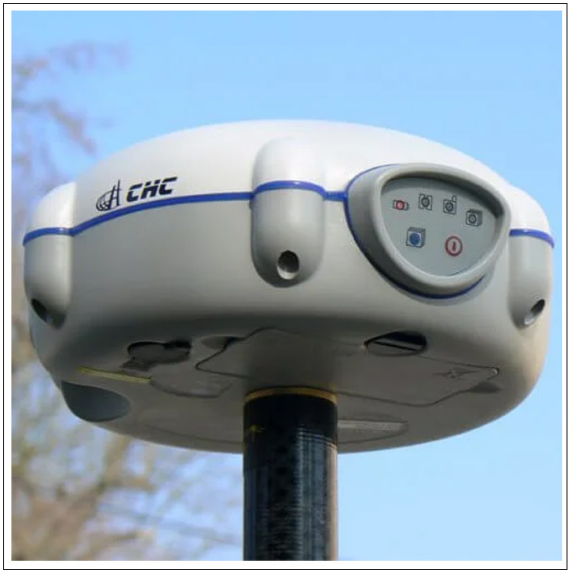
Figure 5: GNSS Receiver used Source: Adapted from [13]
Planning and Flight
For the planning flight, some properties of the RPAS must be considered, such as the sensors, the autonomy of the battery system and the image overlay with the aim of pre-determining the characteristics of the cartographic products that are desired to be obtained [14]. In Brazil, RPAS has been gradually evolving with the dissemination of technology, allowing access and use in different sectors and, as a result, the definition of rules regarding flying are very recent. The National Civil Aviation Agency (ANAC) put into force the regulation, known as “RBAC-E 94” (Special Brazilian Civil Aviation Regulation No. 94/2017), in May 2017 [15]. Currently, there are several standards and requirements for an RPAS flight is carried out. Currently the 3 main bodies that regulate the use of RPAS in Brazil are: National Telecommunications Agency (ANATEL), Airspace Control Department (DECEA) and ANAC, mentioned before. A flight authorization was requested from DECEA, a check was carried out on the aircraft systems, as well as the RPAS and radio control batteries. Furthermore, it was ensured that the RPAS had its document linked to the Brazilian Unmanned Aircraft System (SISANT) up to date. On the ground, analyzes were also carried out to verify that there were no obstructions that could impede the flight. Using the Pix4D Capture application, flight planning was carried out to obtain images to generate the orthorectified orthomosaic. Normally, in conventional photogrammetry, the longitudinal superposition used in images along the flight range is 60% and lateral superposition of 20% [16]. It is worth remembering that the higher the overlap rate, the greater the abundance of photos and tie-in points between them. Therefore, the flight was carried out on May 22, 2021, in the morning, with the following photogrammetric parameters: 80 meters high and longitudinal and lateral overlaps of 75% (seventy-five percent). It is necessary to guarantee at least 60% lateral overlap and 70% longitudinal overlap [17]. Lateral and longitudinal overlaps have an influence on the quality of the generated orthomosaic, since the greater the overlap, the greater the number of common points that the computational algorithm will detect. The Ground Sample Distance (GSD) is directly linked to the drone's flight height when mapping. It was defined that the recommended value for the objective of this work corresponds to 2.5 cm. A corridor mapping is characterized by a long, narrow area. This type of technique is very common, especially on highways. The chosen flight direction was Southeast – Northwest, precisely so that the flight range would be longer, making the RPAS gain battery autonomy throughout the flight. In total, three flight lanes were needed to cover the BRT Transoeste area between Pontal and Dom Bosco stations, as shown in figure 6.
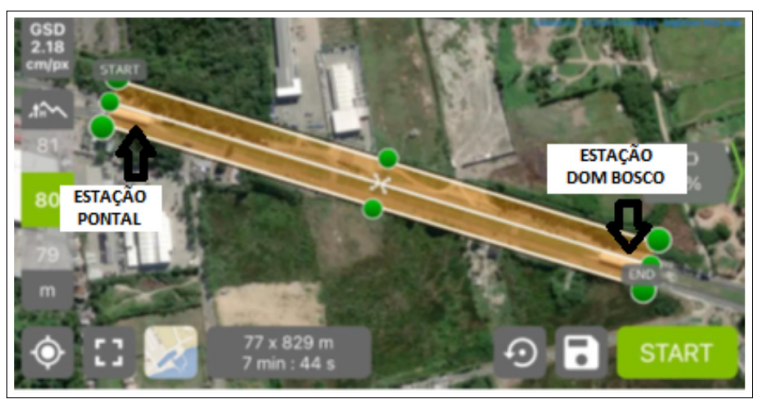
Figure 6: Flight Planning Source: Authors (2022)
Normally, at least 5 control points are used, distributed homogeneously, covering the entire area over which the aerial survey with RPAS will be carried out. Considering the objective of mapping, the precision required for the final product, as well as in very large areas that have significant variation in altitude, it is possible that a greater number of control points will be allocated. Hence, the greater the number of control points, the better the products generated, this quantity will depend on the extent of the area that you wish to survey [18]. However, it is worth checking to what extent it is economically viable to install so many control points. In this work, 12 support points were collected within the area of interest, as shown in figure 7, to support the RPAs survey. These points were raised using the RTK NTRIP technique. It should be noted that 1 point was removed from the survey due to a high positional error. Finally, the distribution was as follows:
- 8 points were used as control points;
- 3 points were used for
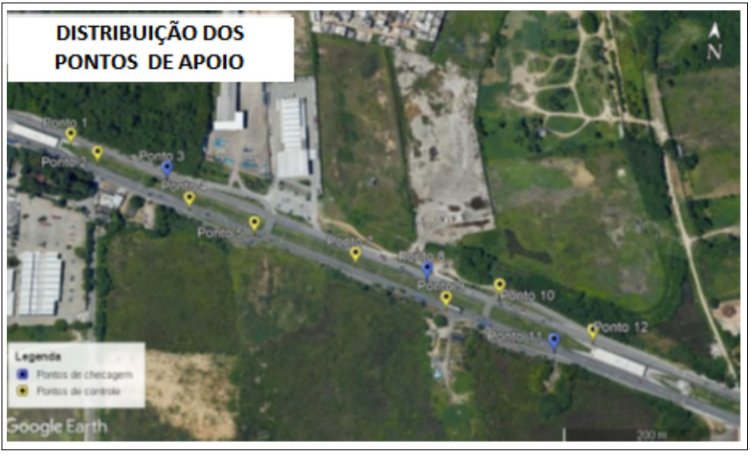
Figure 7: Distribution of Support Points Source: Authors (2022)
Data Processing
Data processing was carried out with the Agisoft Metashape software version 1.5.3 which is software for aerial photogrammetry with the ability to analyze images taken by RPAs to generate digital cartographic models such as points clouds, georeferenced orthomosaics, Digital Terrain Model (MDT) and Digital Surface Model (MDS), measurement of area, volume, distances [19]. It is worth mentioning that for the work in question, the evaluation license offered by the platform was the trial version. Aligning the images is the first stage of execution in the workflow where the Phototriangulation process is carried out, which is the photogrammetric technique, where, through the search for homologous points, the terrain coordinates are determined in relation to a reference. As a result of this technique, the cloud of mooring points is generated, which has the function of materializing the terrain coordinate system. At this stage, support points collected in the field are also inserted, used to improve the positional accuracy of the point cloud. In total, 147 images of the terrain were obtained during the RPAs flight, which went through this process to generate the sparse point cloud. After aligning the photos and generating the sparse point cloud, the dense cloud is generated. The main function of this step is to densify the sparse point cloud. In this case, the software increases the number of points in the cloud, reducing empty spaces to better represent the mapped area. The dense cloud is the basic product that serves as the basis for generating digital terrain and surface models. From the dense cloud, it is possible to generate three-dimensionais surfaces in the terrain software in question. The 3D model is interesting due to its ability to faithfully represent the three-dimensionally mapped terrain.
Results
It is important to highlight that the purpose of this work is not to evaluate the accuracy of the cartographic product resulting from flight processing in Metashape. When building the Digital Elevation Model (DEM), the products generated are a 2D representation in raster format (image) of the digital surface model. It is a georeferenced matrix where each pixel has an elevation value. For the work in question, this is the most important product for the study, as it allows, among other features, a visual interpretation linked to the geometric calculation of asphalt irregularities. With the studies carried out using the methodology described in this document, it was possible to analyze the products obtained by the aerial survey, mainly the orthomosaic, from the perspective of Transport Engineering guidelines for classifying and measuring asphalt irregularities. Based on the statistical results contained in the Agisoft Metashape Processing Report after data processing, it is possible to verify the accuracy of the aerial survey. Table 1 presents the error estimate in X, Y, Z and for XY direction.
Table 1: Error Estimations
|
X error (cm) |
Y error (cm) |
Z error (cm) |
Planimetric error (cm) |
Total error (cm) |
|
3.570 |
4.043 |
1.832 |
5.394 |
5.697 |
Source: Authors (2022).
It was found that the survey obtained a planimetric error of approximately 5 cm and an altimetric error of approximately 2 cm, which is a very satisfactory result for identifying and characterizing asphalt faults. Since, for engineering work carried out with RPAS, centimeter accuracy is expected and meets the requirements. According to the average Ground Sample Distance (GSD) is one of the most important variables to be previously defined in aerial mapping, responsible for the level of detail desired in orthophotos [20]. It is the representation of an image's pixel in terrain units, and is directly related to the flight altitude. In aerial photogrammetry, GSD is one of the most important variables that guarantees the spatial resolution of the work. It is worth mentioning that your choice directly influences the sharpness of the mapping. In the research being carried out, the average GSD obtained by aerial survey was 2.18 cm/pixel. Which means that one pixel of the image will represent an average of 2.18 cm of the terrain. For engineering purposes and for the work in question, this spatial resolution is quite satisfactory as visual clarity of details was achieved. Considering that the spatial resolution obtained is in accordance with that recommended for identifying asphalt faults, planimetric measurements can be carried out with sufficient precision (Figure 8). In this way, it is demonstrated that surveying through RPAS is a viable solution, given the savings in money and time that this solution can bring.
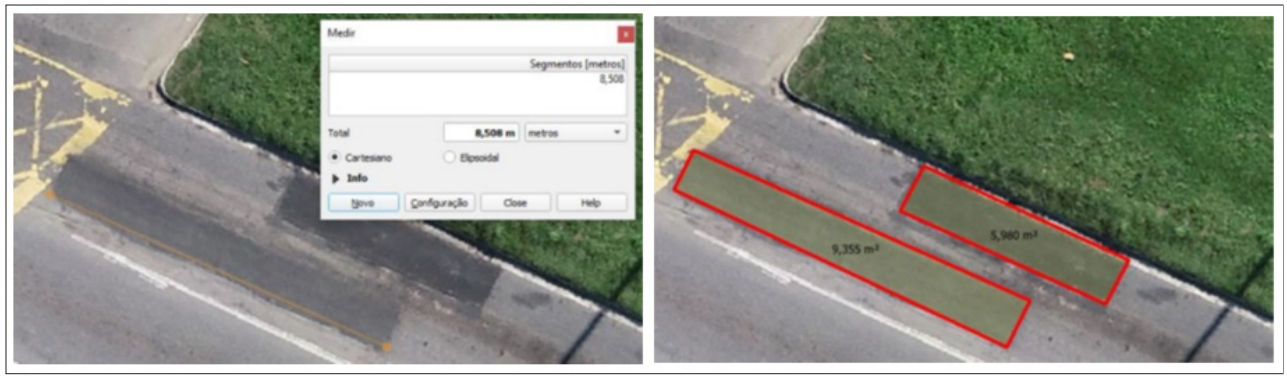
Figure 8: Area Calculation from Irregularity Vectorization Source: Authors (2022)
From the analysis of the orthomosaic and the classification of asphalt faults from the DNIT, it is possible to measure what type of irregularity occurs on the pavement. In addition to characterization, it is also possible to extract geometric information from the faults. In the section of the BRT Transoeste shown in Figure 9, the presence of two different types of asphalt faults is clearly observed, namely “Panela” (Pan) and “Remendo” (Pothole filling) poorly executed. According to the DNIT Standard, a pan or hole (P) is a cavity that forms in the coating for various reasons (including lack of adhesion between superimposed layers, causing layers to peel away), which can reach the lower layers of the pavement, causing disintegration. of these layers. According to the standard, patch (R) is a pan filled with one or more layers of pavement in the operation called “pothole filling”. It is divided into deep patch (the one in which the coating is replaced and, eventually, one or more lower layers of the pavement, usually presented in rectangular shape) and superficial patch (correction, in a localized area, of the coating surface, by application of a bituminous layer.
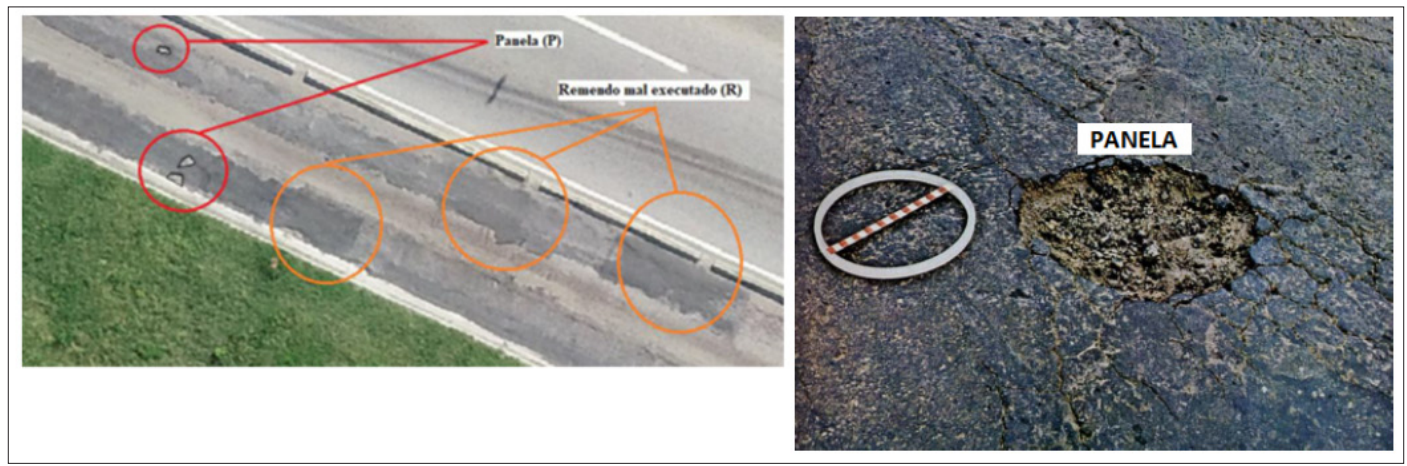
Figure 9: Classification of Irregularities
Source: Adapted from DNIT_005_2003_TER (2022)
In the case of irregularities classified as Panel (P), “holes” as they are commonly called, are noticeable. And in the irregularities classified as Patch (R) it is visible that they are deep patches (since they are rectangular and have a large layer of asphalt mass) however, they are poorly executed, so that the terrain is completely irregular.
Conclusion
The approach employed to detect flaws in the asphalt pavement of the Transoeste Bus Rapid Transit (BRT) System in Rio de Janeiro has demonstrated promise, offering swift and precise outcomes. This method serves as a valuable resource for identifying and restructuring the asphalt within the system. Employing RPAS (Remotely Piloted Aircraft Systems) for surveying significantly streamlines the identification of asphalt issues, contrasting with the traditional method requiring an employee to traverse the entire area, meticulously measuring all irregularities in the asphalt. For future investigations, it is recommended to conduct a comparative analysis of the resultant orthophotos processed in both proprietary software like AGISOFT and open-source software such as OPENDRONEMAP. This comparison could be executed using tools like GEOPEC software, known for its user-friendly features in evaluating and positioning cartographic products. Such a comparative study would likely offer insights into the most effective software for this specific application, optimizing the evaluation and restructuring process of the asphalt within the BRT system.
Acknowledgment
The authors extend their sincere and profound gratitude to FAPERJ for their invaluable support in funding this significant research project under the reference number: E-26/290.116/2021 (262461)
References
- DNIT Departamento Nacional De Infraestrutura De Transportes (2003) DNIT 005-TER: defeitos nos pavimentosflexíveis e semirrígidos: terminologia. Rio de Janeiro, 2003.https://www.gov.br/dnit/pt-br/assuntos/planejamento-epesquisa/ipr/coletanea-de-normas/coletanea-de-normas/terminologia-ter/dnit_005_2003_ter-1.pdf.
- Saraiva, David Harley de Oliveira (2019) Use of photogrammetric products obtained from a remotely piloted aircraft (RPA) for the preparation of engineering 70 f.: Course Completion Work (undergraduate) – Federal University of Ceará, Technology Center, Civil Engineering Course, Fortaleza https://repositorio.ufc.br/handle/riufc/52331.
- Castelo Branco Luiz Henrique (2016) Maniac: uma metodologia para o monitoramento automatizado das condições dos pavimentos utilizando VANTs Tese (Doutorado). Programa de Pós-Graduação em Engenharia de Transportes e Área de Concentração em Infraestrutura de Transportes -- Escola de Engenharia de São Carlos da Universidade de São Paulo https://www.teses.usp.br/teses/ disponiveis/18/18143/tde-07082017-152050/pt-br.php.
- Herold M, Roberts D (2005) Spectral characteristics of asphalt road aging and deterioration: implications for remote-sensing Applied Optics, Optical Society of America 44: 4327-4334.
- Herold M, Roberts D, Val Noronha, Omar Smadi (2008) Imaging spectrometry and asphalt road Transportation Research Part C: Emerging Technologies. Elsevier 16: 153- 166.
- Mccormack E. Stimberis J (2010) Small unmanned aircraft evaluated for avalanche control. Transportation Research Record: Journal of the Transportation Research Transportation Research Board of the National Academies 2169: 168-173.
- Drost L (2021) A transport equity analysis of a 2016 Olympic Games Legacy Project: Bus Rapid Transit in the city of Rio de Janeiro, Brazil. Bachelor Thesis, Univeristy of Groningen 1-20.
- Jim Martin (2023) DJI Phantom 4 review. Tech Review https://www.techadvisor.com/article/716844/dji-phantom-4-review.html.
- Barbosa Eduardo, Monico Galera, Alves Daniele, Oliveira Leonardo (2010) Integridade No Posicionamento RTK E RTK Em Rede. Boletim de Ciências Geodésicas. Research Gate https://www.researchgate.net/publication/277061295_INTEGRIDADE_NO_POSICIONAMENTO_RTK_E_RTK_
- Dai L, Wang J, Rizos C, Han S (2023) Predicting atmospheric biases for real-time ambiguity resolution in GPS/ GLONASS reference station Journal of Geodesy, Berlin 76: 617-628.
- INCRA Instituto Nacional de Colonização e Reforma Agrária (2013) Manual Técnico de Posicionamento: Georreferenciamento de Imóveis 1a ed. Brasília.
- Van Sickle Jan (2015) GPS for land surveyors. CRC press httpshttp://www.taylorfrancis.com/books/mono/10.1201/b18480/gps-land-surveyors-jan-van-sickle .
- CHC – GNSS equipement and receivers (2023) CHCNAV https://www.chcnav.com/.
- Silva João Edson Costa Ferreira, Botelho, Mosar Faria (2017) Cadastro Ambiental Rural utilizando imagem de drone aerofotogramétrico. Revista Agrogeoambiental 9: 1-12.
- Anac (2017) Orientações para usuários de Assessoria de Comunicação Social – ASCOM, 1ª Edição – maio de http://www.gov.br/anac/pt-br/assuntos/drones/orientacoes_para_usuarios.pdf.
- Haala N (2011) Multiray photogrammetry and dense image In Photogrammetric week 11: 185-195.
- Ferreira Alexandre Moreno Richwin, Henrique Roig, Paulo H B J Mnezes, Giuliano S. Marotta (2013) Utilização de aeronaves remotamente pilotadas para extração de mosaico georreferenciado multiespectral e modelo digital de elevação de altíssima resolução espacial. Anais do Simpósio Brasileiro de Sensoriamento Remoto (SBSR) 9308-9315.
- Brito Jorge Luís Nunes e Silva (2007) Fotogrametria Rio de Janeiro: EdUERJ 1-196.
- Agisoft (2020) Agisoft Metashape 5.3—Professional edition: Agisoft LLC software https://www.agisoft.com/downloads/installer/.
- Costa L G. Amorim A L (2009) Geração de Ortofotos para Produção de Mapas de Danos. Research Gate https:// researchgate.net/publication/38977077_Geracao_de_Ortofotos_para_Producao_de_Mapas_de_Danos_Ortophoto_ creation_for_damage_map_production .