The Impact of Fuel Policies on Price Control in Mozambique from 2015 to 2019
© 2020 Filipe Mahaluça, et al. This is an open-access article distributed under the terms of the Creative Commons Attribution License, which permits unrestricted use, distribution, and reproduction in any medium, provided the original author and source are credited.
Abstract
This article analyzes the impact of the price control policy on fuels in Mozambique, in view of the successive increases in the price of crude in the international market from 2015 to 2019.
The stabilization of the general price level is one of the biggest concerns of all States in the World and Mozambique is not an exception, as the opposite presupposes an increase in the cost of living and a consequent loss of purchasing power.
The results of this research shows that in the referred period, the fuel price control policy adopted by the Government of Mozambique had a positive impact in this sector, since the inflation rate is decreasing, although in the same period, the price of crude in the international market has grown at an average of 80% per year, corresponding to 62$ and an increase of 31$ from 2015 to 2019.
From 2017 to 2018 there was disinflation in the price of fuel in Mozambique with the exception of Liquefied Petroleum Gases. However, there was a high inflation from 2016 to 2017, mainly influenced by lighting oil and diesel, which registered 36% and 33% respectively.
Therefore, for any of the results obtained in both 2016, 2018 and 2019, we see that they are consistent with the purposes of price stabilization. Therefore, the impact of the adopted policies is positive. While price control in Mozambique is effective, it is necessary to carry out further research on these matters, to assess the impact of this policy on national oil companies.
Introduction
Mozambique, like any other country in the world that imports fuel, spends a lot of money, both from the state as well as from companies and families. Nevertheless, being subject to the vulnerabilities of the price fluctuations of this precious energy liquid in the international market, there is a whole need to guarantee stable prices in the domestic market.
Since fuel prices significantly influence quality of life, decisionmakers in each state adopt policies aimed at controlling inflation, which may be liberalization (total or partial derivative prices), or price controls practiced in the market domestic market combined with the stabilization fund [1].
In the international market, the price of a barrel of oil is determined by several factors such as crude quality, refining, location, demand and supply conditions that often depend on facts, news and perspectives [2-4]
Looking at supply, it is said that there is a beneficial shock in it, if there is a surplus of oil, which causes a drop in the prices of the product and a consequent fall in the rate of inflation [5]. However, an adverse shock to supply arises from the scarcity of the product, conditioning the rise in international oil prices and ultimately the growth of inflation [5, 6].
The evolution of the prices of oil products shows the upward trend and the volatility to which they are subject, as they respond to variations in world supply and demand [7]. In developed countries with low and stable inflation rates such as Canada and the United States, price liberalization appears to be more feasible [8].
However, the same may not be true in developing countries, as they tend to be more concerned with the impacts that variations in international demand and supply cause on domestic prices and, respectively, on inflation. It is in this sense that many of these countries end up opting for a policy to control the prices of derivatives [9, 10].
Fluctuations in energy prices are caused by imbalances between supply and demand, which, among others, are due to wars, changes in political regimes, economic crises, entry into force or breaches of trade agreements, unexpected weather events [11].
As can be seen in figure 1, from 2015 to 2019 the average price of a barrel of oil was $ 62, with an average percentage rate of increase of around 80%. From 2015 to 2019, the barrel price growth rate was approximately 82%, which corresponds to an increase of $ 31 from the first to the last year.
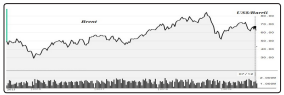
Figure 1: Price of Brent crude in the international market from 2015 to 2019
Mozambique, being a developing country, also opts for the price control policy. According to the study presented by Arndt et al (2005), in that same year, it was estimated that oil companies in Mozambique registered accumulated losses in the amount of $ 28 million, since, until September, losses were already around the margin of $ 13.4 million [12].
Therefore, the Government decided to increase prices gradually, in order to follow the trend in the international market, to avoid the collapse of national oil companies. This decision, in the authors’ opinion, was correct and unavoidable as there were several disadvantages in maintaining fixed prices and fuel subsidies.
The same authors strongly recommended to the Ministry of Energy at the time and to the Council of Ministers that in their respective proposals and decision link the domestic prices of fuels to the prices of the International Market.
In turn, the Council of Ministers has systematically approved the readjustment of fuel prices, following the international trend of crude oil. In this path from 2015 to 2019, the WTI crude barrel price in the international market registered an average increase of $ 9, averaging between $ 52 and $ 61 per barrel unit.
The question that arises is, to what extent the Government, using the price control policy, managed to monitor the trends in the price of crude in the international market without, however, creating situations of high inflation in Mozambique or passing the burden on to the final consumer in the fuel sector.
Therefore, in this article, we seek to analyze the impact of the price control policy on fuels (gasoline, lighting oil, diesel and liquefied petroleum gases) in Mozambique from 2015 to 2019 in view of the increases in the price of crude oil in the international market.
Material and Methods
This is a quantitative, descriptive and inductive study, with retrospective analysis of primary data existing at the Ministry of Mineral Resources and Energy from 2015 to 2019.
Population and Sample
The universe set considered for this research comprises information on all fuel prices (Gasoline, Lighting Oil, Diesel and Liquefied Petroleum Gases) from January 2015 to December 2019, here considered finite.
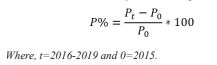
Rate of Change
To assess the difference between the prices from 2016 to 2019 taking into account the base year (year 2015), the relative price variation was determined by the following formula:
Data Analysis
A seasonal analysis was performed using Figureand tables to understand the behavior of fuel prices. For verification of normality, the Kolmogorov-Smirnov (K-S) statistical tests were used. Levene’s test was used to analyze the homogeneity of variances. For multiple comparisons of averages, Analysis of Variance (ANOVA) was used. When comparing two averages, supplementary tests of LSD (Least Significant Difference), HSDTuckey (Honnestly Significant Difference) or Scheffe were used. For all tests, a significance level of 5% was used, where any value of P-value less than 5% was considered significant. Data analysis was performed using the Statistical Package for the Social Sciences (SPSS) version 20.
Presentation of Results
Seasonal Analysis of Fuel Prices
Domestic fuel prices in the last 4 years, in general, had a stationary trend, with a markedly more pronounced increase from October 2016. As shown in Figure 2, 3, 4 and 5, the price of fuels did not change in 2015.
In 2017, the prices of gasoline, lighting oil and diesel presented a wave-like behavior with an increasing trend. In the same year, the price of liquefied petroleum gases showed a varied behavior, having the lowest price in June and the highest in November and December in the five years under analysis (Figure 2,3,4 and 5)
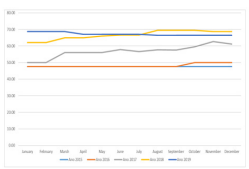
Figure 2: Monthly variation in the price of Gasoline in Meticais per liter
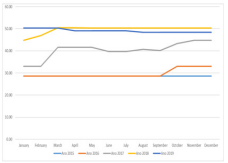
Figure 3: Monthly variation of the price of Lighting Oil in Meticais per liter
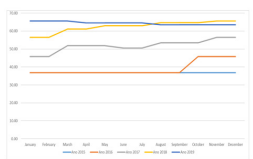
Figure 4: Monthly variation of the price of Diesel in Meticais per liter
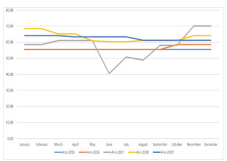
Figure 5: Monthly variation of the price of iquefied Petroleum Gases in Meticais per kilogram
Average Fuel Price Comparison
As shown in table 1, the price of gasoline increased slightly by 0.625 cents from 2015 to 2016. From 2016 to 2017 the increase was 8.64 meticais, 10.4717 meticais from 2017 to 2018 and 0.6266 cents from 2018 to 2019. The data show also that the largest monthly dispersion of gasoline prices was registered in the years 2017 (3.78352) and 2018 (2.72079). In general, the price of gasoline registered an absolute average increase of 19.7233 meticais from 2015 to 2019. In the five years under analysis the average price of gasoline was 57.2620 meticais.
In relation to lighting oil, from 2015 to 2016 the increase was only 1,105 meticals. From 2016 to 2017 the increase was 10.5725 meticais, 9.2867 meticais from 2017 to 2018 and a decrease of 0.4784 cents from 2018 to 2019. The data also show that the largest monthly dispersion of lighting oil prices was registered in the years 2017 (3,80631), 2016 (1.99902) and 2018 (1.81632). In general, the price of lighting oil registered an absolute average increase of 20.4858 meticais from 2015 to 2019. In the five years under analysis the average price of lighting oil was 39.4865 meticais. (Table 1)
According to table 1, the price of diesel increased slightly by 2,255 meticais from 2015 to 2016. From 2016 to 2017 the increase was 12,7092 meticais, 10,6458 meticais from 2017 to 2018 and 1,9492 metical from 2018 to 2019. The data also show that the largest monthly dispersion of diesel prices was recorded in the years 2016 (4,07945), 2017 (3,377297) and 2018 (3,18888). In general, the price of diesel increased by an absolute average of 27.5592 from 2015 to 2019 meticais. In the five years under analysis, the average price of diesel was 50.8877 meticais.
In relation to liquefied petroleum gases, from 2015 to 2016 the increase was only 0.77 cents. From 2016 to 2017 the increase was 1.84 meticals, 5,3025 meticais from 2017 to 2018 and a decrease of 0.7408 cents from 2018 to 2019. The data also show that the largest monthly dispersion of liquefied petroleum gas prices was registered in the year 2017 (8.31992). In general, the price of liquefied petroleum gases registered an absolute average increase of 7.1717 meticais from 2015 to 2019. In the five years under analysis the average price of liquefied petroleum gases was 59.1528 meticais. (Table 1)
The data in table 1 also show that the monthly prices of each type of fuel for the five years analyzed show a normal distribution of heterogeneous variances. Comparing the average values of the four types of fuels analyzed (Anova), it can be concluded for any level of significance that there is a significant difference in annual prices (P-value = 0.000).
Following an analysis of variance where it was concluded that there are significant differences between the average annual fuel prices, supplementary tests of LSD, HSD-Tuckey or Scheffe were carried out in order to identify which are the statistically different averages. Thus, these tests showed that there is no significant difference in prices for gasoline, lighting oil and diesel between the years 2015-2016 and 2018-2019. Regarding the average annual prices of liquefied petroleum gases, it is also concluded that there is no significant difference in the years 2015-2016,
Table 1: Average fuel price comparison
| Year | Average | Std. Deviation | Normality Test | Levene’s Variance Homogeneity Test | Analysis of Variance (Anova) | |||
|---|---|---|---|---|---|---|---|---|
| Test K-S | P-value | Value of F | P-value | Value of F | P-value | |||
| Gasoline | ||||||||
| 2015 | 47.5200 | 0 | 1.751 | 0.004 | 7.375 | 0.000 | 229.634 | 0 |
| 2016 | 48.1450 | 1.13067 | ||||||
| 2017 | 56.7850 | 3.78352 | ||||||
| 2018 | 66.6167 | 2.72079 | ||||||
| 2019 | 67.2433 | 0.93363 | ||||||
| Total | 57.2620 | 8.87506 | ||||||
| Lighting Oil | ||||||||
| 2015 | 28.6400 | 0 | 1.760 | 0.004 | 6.614 | 0.000 | 273.645 | 0 |
| 2016 | 29.7450 | 1.99902 | ||||||
| 2017 | 40.3175 | 3.80631 | ||||||
| 2018 | 49.6042 | 1.81632 | ||||||
| 2019 | 49.1258 | 0.78104 | ||||||
| Total | 39.4865 | 9.34149 | ||||||
| Diesel | ||||||||
| 2015 | 36.8100 | 0 | 1.803 | 0.003 | 8.833 | 0.000 | 252.672 | 0 |
| 2016 | 39.0650 | 4.07945 | ||||||
| 2017 | 51.7742 | 3.37297 | ||||||
| 2018 | 62.4200 | 3.16885 | ||||||
| 2019 | 64.3692 | 0.85684 | ||||||
| Total | 50.8877 | 11.83831 | ||||||
| Liquefied Petroleum Gases | ||||||||
| 2015 | 55.4600 | 0 | 1.431 | 0.033 | 7.740 | 0.000 | 9.772 | 0 |
| 2016 | 56.2300 | 1.39298 | ||||||
| 2017 | 58.0700 | 8.31992 | ||||||
| 2018 | 63.3725 | 2.99022 | ||||||
| 2019 | 62.6317 | 1.28408 | ||||||
| Total | 59.1528 | 5.10632 | ||||||
Price Variation Rate
As shown in Figure 6, based on the year 2015, the price of gasoline increased by 1.32% in 2016, 19.5% in 2017, 40.19% in 2018 and 41.5% in 2019. For lighting oil, in the year 2016 the price increase was 3.86%, 40.77% in 2017, 73.20% in 2018 and 71.53% in 2019. In 2016, the price of diesel increased by 6.13%, in 2017 by 40.65%, 69.57% in 2018 and 74.87% in 2019. In relation to liquefied petroleum gases, the price increase was 1.39% in 2016, 4.71% in 2017, 14.27% in 2018 and 12.93% in 2019.
In 2016, the average variation in fuel prices was 3.17%, with diesel (6.13%) and lighting oil (3.86%) registering higher rates. In 2017, the average variation in fuel prices was 26.41%, with lighting oil and diesel registering higher rates with 40.77% and 40.65% respectively. The average change in fuel prices in 2018 was 49.31%, with lighting oil and diesel registering higher rates with 73.20% and 69.57% respectively. In 2019, the fuel price registered an average variation of 50.21%, with diesel (74.87%) and lighting oil (71.53%) registering the highest rates this year (Figure 6).
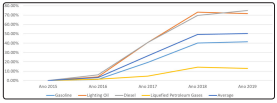
Figure 6: Average change in fuel prices (base year-2015)
The price of gasoline, from 2016 to 2017 increased by 18%, 17 %% from 2017 to 2018 and 1% from 2018 to 2019. The price of lighting oil increased by 36% from 2016 to 2017, 23% from 2017 to 2018 and a decrease of 1% from 2018 to 2019. The price of diesel increased by 33% from 2016 to 2017, 21% from 2017 to 2018 and 3% from 2018 to 2019. The price of liquefied petroleum gases, increased by 3% from 2016 for 2017, 9% from 2017 to 2018 and a decrease of 1% from 2018 to 2019 (Figure 7).
The price of gasoline, from 2016 to 2017 increased by 18%, 17 %% from 2017 to 2018 and 1% from 2018 to 2019. The price of lighting oil increased by 36% from 2016 to 2017, 23% from 2017 to 2018 and a decrease of 1% from 2018 to 2019. The price of diesel increased by 33% from 2016 to 2017, 21% from 2017 to 2018 and 3% from 2018 to 2019. The price of liquefied petroleum gases, increased by 3% from 2016 for 2017, 9% from 2017 to 2018 and a decrease of 1% from 2018 to 2019 (Figure 7).
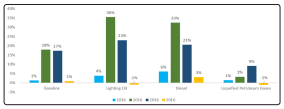
Figure 7: Average annual variation in fuel prices
From 2015 to 2019, the price of fuels registered an average increase of 32.27%, with diesel 47.81% and lighting oil 47.34% presenting high average rates. Liquefied petroleum gases registered an increase of 8.32%, a much smaller value when compared to other types of fuels studied here (Figure 8)
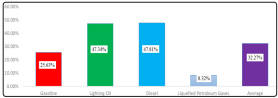
Figure 8: Average price increase by fuel type (5 years of analysis)
Discussion of Results
With the results presented here, it is clear that the set of measures adopted by the government of Mozambique has had the desired effect, at least with regard to the stabilization of fuel prices. Even though they registered some increase, it was not abrupt or glaring, according to the seasonality analyzed.
However, this was not always the case, as some studies by the International Monetary Fund (IMF) and the Center for Public Integrity (CIP) revealed in 2015 and 2016, respectively, the Government’s need for better operationalization of Decree 45/2012 of December 28. This approves the setting and formation of fuel prices in Mozambique, within the scope of the price control policy
Accordingly, according to this legal provision, it is up to the ministers of energy and finance to deal with fuel prices, as long as the changes are less than 20%; however, if they are larger, it is up to the Council of Ministers to determine prices. In turn, the prices of any petroleum product must be reviewed monthly and must be updated and communicated to the duly licensed distributors in the event of a variation greater than 3% of the Base Price.
However, looking at the international market in the same period under review, there was clearly a shock in the price of Brent that would have caused a 47% increase only from 2015 to 2016, and a worsening in 2018.
This last year was particularly adverse in the fuel sector, both in the international and in the domestic market, due to the highest growth rates of the main fuels. Nevertheless, this situation in Mozambique was dampened by the price control policy, accompanied by the gatherings that were always justified, otherwise the end consumer would have felt very suffocated the burden of this increase registered in about 110% of the year in reference.
As can be seen in the results, prices in general increased slightly for all fuels under analysis from 2015 to 2016 and decreased in 2019, that is, we can consider moderate inflation in fuels from 2015 to 2016 and deflation from 2018 to 2019.
These results follow the same trend as the Brent price in the highlighted periods. This was one of the strong recommendations made by Arndt et al (2005), so it can also be seen that it was welcomed, as well as those made by the IMF and CIP [12].
From 2017 to 2018 there was disinflation in the price of fuel in Mozambique with the exception of LPG. However, there was a high inflation from 2016 to 2017, mainly influenced by lighting oil and diesel, which registered 36% and 33% respectively.
Therefore, for any of the results obtained in both 2016, 2018 and 2019, we see that they are consistent with the purposes of price stabilization. Therefore, the impact of the adopted policies is positive.
As can be seen from the literature review and the results presented here, fuels in the national market registered an average increase of 32%, against 80% of the increase in the Brent rate. Again, this is unequivocal proof of the effectiveness of the price control policy. This measure helps to minimize the harmful effects of the increase in crude oil on the international market.
However, further research is needed to assess the impact of this measure on gas stations, which is the dilemma of this price control policy. If the Government prioritizes the stability of fuel prices that largely determine the behavior of the economy in general, gasoline operators often add large losses, especially if the policy is not accompanied by subsidies to operators.
According to Kojima (2013), governments often manage to achieve this result of lowering or containing inflation, but from it, externalities such as flourishing black markets, smuggling, fuel adulteration, and illegal diversion of subsidy funds, major financial losses suffered by suppliers may arise fuel, deteriorating refining and infrastructure and acute fuel shortages, causing damage throughout the economy. In several countries, subsidies, price controls and other restrictions have helped to protect inefficient oil refineries and traders [13].
In this same survey, this author shows that price fixing for months or even years in a row remains common in a large number of countries, of which Mozambique is a part. Predictably, almost all led to price subsidies, some reaching a few percentage points of GDP. Countries that have frozen prices for gasoline, diesel or both for several months or more over the past three years include Angola, Bangladesh, Bolivia, Cameroon, Ivory Coast, Egypt, Ethiopia, Ghana, India, Indonesia, Islamic Republic of Iran, Iraq, Jordan, Kazakhstan, Madagascar, Malawi, Malaysia, Morocco, Mozambique, Nepal, Niger, Nigeria, Russian Federation, Rwanda, Sri Lanka, Syria, Bolivarian Republic of Venezuela and Republic of Yemen.
Just to name a few countries that have had externalities in the use of the price control policy, we have Angola, where fuels are smuggled out of the country. Malawi suffered from a shortage of fuel for several years in a row, at least one month each from 2009 to 2012. On the other hand, fuel prices on the black market were more than double official prices.
Following the decision by the government of Nigeria to no longer include the subsidy provision in the 2009 budget, private oil traders stopped importing, causing serious fuel problems. Refund delays continued to discourage imports, and severe fuel shortages were reported in late 2009 and early 2010.
These are just some of the cases that can be reported among the many linked to price control policies. That is why additional research in Mozambique is needed to see to what extent the country is not affected by the same problems, even though it has managed to stabilize prices.
Conclusions
The increase in the price of oil as an indisputable determinant in the economic literature is a consensual fact, therefore, this research did not seek to bring about this debate. From the literature review carried out, several policy options were presented in relation to the pricing of derivatives, aiming to contain the adverse effects that often arise with fluctuations in the price of crude in the international market. It was evident that for industrialized countries such as Canada and the United States of America, policies of full price liberalization are effective; however, for the vast majority of countries like Mozambique, the best ones are those for controlling the prices of oil products.
The price of a barrel of oil in the international market has shown to be increasing in the years 2015 to 2019, however, in the Mozambican domestic market the burden has not been passed on to the end customer. This is the impact of the fuel price control policy adopted by the Government, which means that the average cost of fuels in the domestic market, although increasing, its rate has been decreasing year after year.
Although price control in Mozambique is effective, since it is possible to stabilize prices or not pass the burden of fluctuating crude prices in the international market to the final consumer, further research on these matters is necessary to assess the impact of this policy national oil companies because previous research has shown in its results that the use of these policies can also be linked to huge losses to national oil companies depending on the cases.
Conflict of Interests
The authors have not declared any conflict of interests.
References
- Demczuk Andre, Padula Antonio Domingos (2017) “Using system dynamics modeling to evaluate the feasibility of ethanol supply chain in Brazil: The role of sugarcane yield, gasoline prices and sales tax rates.” Biomass and Bioenergy 97: 186-211
- Kesicki Fabian. (2010) “The third oil price surg-What’s different this time?” Energy Policy 38: 1596-1606.
- Umbach Frank. (2010) “Global energy security and the implications for the EU.” Energy Policy 38: 1229-1240.
- Alquist Ron, Guenette Justin Damien. (2014) “A blessing in disguise: The implications of high global oil prices for the North American market.” Energy Policy 64: 49-57
- Berument Hakan, Ceylan Nildag Basak, Dogan Nukhet. (2010) “The impact of oil price shocks on the economic growth of selected MENA1 countries.” Energy J 31: 1-7.
- Baumeister Christiane, Peersman Gert. (2013) “Time-varying effects of oil supply shocks on the US economy.” Am. Econ. J. Macroecon 5: 1-28.
- Masih Rumi, Peters Sanjay, Mello Lurion De. (2011) “Oil price volatility and stock price fluctuations in an emerging market: evidence from South Korea.” Energy Econ 33: 975- 986.
- Diaz Elena Maria, Molero Juan Carlos, Gracia Fernando Perez De. (2016) “Oil price volatility and stock returns in the G7 economies” Energy Econ 54: 417-430.
- Cavalcanti Tiago, e Jalles Joao Tovar. (2013) “Macroeconomic effects of oil price shocks in Brazil and in the United States.” Appl. Energy 104: 475-486.
- Ghalayini Latife. (2011) “The Interaction between Oil Price and Economic Growth The Interaction between Oil Price and Economic Growt.” Middle East. Financ. Econ 13: 127-141.
- Martinho Isabel Rodrigues. (2010) “O preco do petroleo como factor global: análise sectorial”.
- Arndt C, Matsinhe L, Mulder P, Paulo E, e Van Dunem J. (2005) “O impacto do aumento do preco do petroleo na Economia Mocambicana”. Ministerio da Planificacao e Desenolvimento, DNEAP Discussion paper, p. 19. 28.
- Masami Kojima. (2013) “Petroleum product pricing and complementary policies: experience of 65 developing countries since 2009. The World Bank.