The Impact of Covid-19 and Lockdown on South African Revenue
© 2020 Mangalani Peter Makananisa, et al. This is an open-access article distributed under the terms of the Creative Commons Attribution License, which permits unrestricted use, distribution, and reproduction in any medium, provided the original author and source are credited.
Abstract
The state revenue plays a critical role in the running of its departments and plays a significant role in the economy. The study investigates the impact of COVID-19 and the lockdown on the South African revenue collections. The study focuses on the major taxes Personal Income Tax (PIT), Corporate Income Tax (CIT) and Value Added Tax (VAT). Over the fiscal year 2008/09 to 2019/20 the three taxes contribute around 80% of the Total Tax (TTAX). The sample data was from quarter 1, 2014 to quarter 2, 2020 (50 observations) obtained with quarter 2 of 2020 carrying the impact of the pandemic. The SARIMA and Holt-Winters models were used to forecast the continuation of the historical patterns in two scenarios, (1.) Without the impact of the COVID-19 pandemic (No shock), and (2.) with the impact of COVID-19 and lockdown (with a shock) on the revenue collections. The R-statistical software was used to obtain the regression parameters and for forecasting purposes. On “average”, the impact of the pandemic is expected to reduce total revenue by around R310.6bn to R1, 127 trillion (on the interval R1, 093 – R1, 162 trillion) from the original estimates of R1, 438 trillion for the fiscal year 2020/21. The average forecast for PIT, CIT and VAT due to the impact of the pandemic is R532.9billion, R172.6billion and R320.9billion respectively. The study further encourages model revision as more data impacted by the pandemic become available.
Introduction
The collection of the state revenue relates to the economic performance of a country (Gross Domestic Product (GDP)), which implies that an increase in GDP results in an increase in revenue. However, to obtain maximum revenue from the economic activities, a sound administration of revenue is to be established by the state. This includes sound policies, the right equipment or tools in place and cooperation of taxpayers to fulfil their tax obligation
The Covid-19 pandemic which started to impact the world economy towards the end of calendar year 2019 imposes a challenge on revenue collection. The unexpected pandemic or shock will also affect the revenue collection for fiscal year 2020/21 resulting in lower revenue collection. Estimates from the International Monetary Fund (IMF), Reserve Bank and Organisation for Economic Co-operation and Development (OECD) suggest that economic growth in South Africa will contract by between 6 and 7 percent in 2020 [9].
The state also imposed a hard lockdown from March 27, 2020. The lockdown resulted in job losses as most businesses did not operate and some such as liquor, cigarette, recreation and restaurants were not allowed to operate. However, this poses an imbalance between saving lives and the economy, which was already contracting. The lock-down was then slightly relaxed in May 28, 2020 to avoid further contraction of the South African economy, allowing some economic activities to resume with some precautionary measures in place.
The South Africa economy was already in stagnation long before the outbreak of the COVID19 at the end of 2019. For the past five years (2015-2019), its rate of growth averaged only less than 1%; it slipped into a technical recession (two consecutive negative quarterly GDP growth) in 2019 when it contracted by -1.4% in the 4th quarter from -0.8% in the 3rd quarter. At the beginning of 2020, the economy went into a full recession with GDP contracting by -2% in the 1st quarter of 2020 [12].
South Africa’s economic outlook remains pessimistic with the real GDP expected to deteriorate by -7.2% in 2020, and return to growth of 2.6% in 2021. In addition, unemployment has worsened from 29.1% in the 4th quarter of 2019 to 30.1% in the 1st quarter of 2020 with the most affected group being the youth, ages between 25 and 34 years. The state projects the gross national government debt to increase from R3.26 trillion (63.5% of GDP) in 2019/20 to R3.97 trillion (81.8% of GDP) in 2020/21. Furthermore, by the end of 2022/23, the gross loan debt is expected to reach R4.83 trillion or 86% of GDP. The tourism industry will be the most affected by the lock-down imposed to the economy in general. PricewaterhouseCoopers (PWC) estimated that1000 of tourism related jobs will be threatened; this is adding more pressure to the South African unemployment rate, which is around 30% and the rand weakened by 11% in January and February 2020 [10,13-14].
The crucial part in revenue is to provide estimates, paying careful attention to the economic occurrence as the revenue carries a significant portion of the state affairs from which failure to do that could result in ridiculous over/under estimation of the actual realisation of revenue. This could also results in poor running of the state affairs and bad publicity.
This study seeks to derive the simple underlying structure that represent the data well enough from which inferences about the population and predictions are constructed. Using time series SARIMA and the Holt-Winters model to produce revenue expectations for major taxes Personal Income Tax (PIT), Corporate Income Tax (CIT), and Value-Added Tax (VAT) for fiscal year 2020/21 with the following assumptions: (a) No impact of the shock (pandemic and lock down), and (b) The inclusion of the shock on the state revenue collection. Furthermore, to show the anticipated revenue loss due to COVID-19 and to derive the medium term forecast for fiscal year 2021/22 assuming the continuation of the pandemic.
The Covid-19 Pandemic Literature Review
The COVID-19 pandemic form part of the humanitarian problem globally, its impact is not only felt by human kind but also by countries’ economy. The impact of this invisible biological enemy also affected political influence around the world as many countries compete to find the cure of the current global pandemic. Though the current pandemic started to surface towards the end of 2019, several literatures exist around the world to address the depth of the problem that human kind and the economy confront.
The impact on food directly affects the collection of VAT for both importation and domestic goods and services. However, on the production side both the firms/companies and employment will be affected, resulting in lower PIT and CIT revenue collection. The link between the state revenue is inseparable as one depends on the other.
Arndt C reported on the estimates of the costs of lock down implemented by the South African government in March 2020, looking at the four scenarios in which the lock down and other efforts influencing economic activities are distinguished. This includes the impact due to reduction in production, household demands for goods and services, global production, supply chains on national exports, and uncertainty on investments. The study emphasise that the continuation of COVID-19 would worsen GDP outcome in line with the slow and long recovery scenarios. This study recommended that attention should be on a long run strategy on health dimension and economic consequence [1]
Maliszewska, Mattoo & Mensbrugghe used the illustrative Computable General Equilibrium (CGE) model to simulate the potential impact of COVID-19 on GDP and trade. The model expects global GDP to fall by 2.1 percent under the world benchmark, 2.5% for the developing countries and 1.8% for industrial countries. According to the model, the biggest GDP losses due to COVID-19 based on their direct impact on tourism and relative integration on trade are Cambodia (3.2 %), Hong Kong SAR(2.3%), Thailand (3 %), Vietnam (2.7 %), China (2.3 %), Singapore (2.1 %) and Malaysia by 2.1 % (East Asia and Pacific countries). However, the declines will be nearly 4% below the world benchmark. The overall negative impact on GDP implies the reduction in the overall state revenue collection, as there exist a direct relationship between revenue and GDP. Furthermore, the study recorded biggest negative shock in domestic services and tourism services. However, the limitation on the model built was the minimal capturing of social isolation induces and the investor confidence due to early stages of the pandemic [7].
Polishchuk analysis the consequences of COVID-19 effect on finances and economy (world GDP and the case of Ukraine). If the pandemic is not under control until summer 2020 (more especially for the developing countries), the study emphasises that the fall in the world GDP will be as a result of lower consumption and loss in tourism, trade, as well as reduction in investment and affected financial markets. The balance between human health and the introduction of effective financial levers will reduce the economic deterioration. The study also recommend the exploration of economic and financial manifestation in Ukraine as the pandemic is just adding more problems on the economy that was already deteriorating, especially the financial sector [11].
Krever who analysis the historical evolution of the Australian tax institution (the state and central government) argued that the problem is not what the government did but rather what they did not do deliberately. The Australian government did not use income tax concessional as a way of biasing investments in favoured sectors. They did not adopt any concessional measure when COVID-19 impact became a reality. The government began to modify their rules around taxes as the government failed to find ways to relieve the burden of tax payers, some businesses/ companies sought to use the economic crises (downturn) for their benefit. One could conclude that there will be a loss of state revenue although the study did not indicate by how much the Australian revenue is going to be impacted [6].
Most of the literature coverage of COVID-19 impact on the economy are on their initial stages as the data is still minimal. However, the limited literature indicates that the tourism sector and trade are expected to be affected the most. It also gives some direction and update about the impact. The cumulative availability of data will then encourage further amendment or revision of existing models/projections to assess the impact of COVID-19 and lock-down on the economy/revenue better, assuming the long dragging of the pandemic.
The Sarima and Holt Winters Literature Review
The application of the Holt-Winters and ARIMA models on state revenues has increased over the past years, with several authors supporting the use of these models for the purpose of forecasting future outcomes. This is because they are not time consuming, they generate unbiased estimates/forecast and they are precise when assessed against the actual. The models of this nature treat the process as black box. The studies include the work of authors such as; Ebelechukwu OC, Chioma OF, Johnson B who used secondary data for the period 2006 to 2016 (eleven years) collected from the Inland Revenue department of the local government in Gombe, aiming to develop patterns in the management of revenue generation and to see if there was a steady increase in revenue generated over the years. The ordinary least square and ARIMA models were used. The results showed a steady increase in the sample of interest and a minor instability in the de-seasonalised time series data. The study recommended the local government to try to get more ways of improving revenue by utilizing the resources with clear objectives to deal with tax defaulters [4-5].
Chimilila C employs a time series approach ARIMA and GARCH models on the Tanzanian monthly tax revenue data spanning from January 2000 to February 2015 to forecast tax revenue and its volatility. In a study, the higher volatility observed was associated with income taxes. The best models were selected based on Akaike information criteria (AIC), Bayes-Schwarz information criteria (BCI) and Root mean squared error (RMSE). The study recommend the use of combined forecast and GARCH(1,1) to model monthly revenue and its volatility, enhanced diversity of taxes by widening consumption tax base. This will result in increased income tax revenue contribution and volatility reduction [3].
Nandi, Chaudhury & Hasan intended to identify suitable HoltWinters (Additive and Multiplicative) models and SARIMA (Dynamic and One-step) for Bangladesh tax revenue. These models were applied on the data from July 2004 to November 2012 (101 observations). However, the first 84 observations were used to train the models and the remaining observations were used for testing or fitness of the model. The official forecast from the Ministry of Finance (MoF) and the models forecast were compared to the actual to identify the gap. The models results showed that Holt-Winters multiplicative approach perform better compared to other models with minimal error. The study also opened an avenue for systemic analysis of revenue forecasting using different models rather than judgmental method used by the authority in Bangladesh [8].
The ARIMA and other formal econometric models were used by Botric V & Vizel M for estimating both direct and indirect taxes, aiming to improve the existing literature in Croatia. The data from 1995 to 2006 was used for different taxes except for VAT which started in 1998. The models were implemented on the seven fiscal revenues, namely Income Tax, Corporation Tax, VAT, Property Tax, Import Duties, Excise and Social Contributions. The statistic criteria such as MAPE and Thiels inequality U-coefficient were used to check the estimate’s accuracy against the actual ending 2006. The formal econometric methods were also used to forecast 2007 and 2008 values and the formal methods were also compared to the forecast from the Croatian Ministry of Finance (CMF). The ARIMA forecasts were more accurate than the official forecasts. This study concluded that CMF could benefit from using time series methods due to their forecast accuracy in a transitional Croatia, suggesting a replacement of expert judgement, political bias and simple trend extrapolation. Using these methods, the government authorities could gain more information on the future direction of revenue in Croatia [2].
The economy dynamics might change because of policy changes by the state or global impact such as the COVID-19 pandemic, thus it is advisable to consider model revisions to cater for the current or latest occurrences. The few studies reviewed above clearly show the significance and the benefits of using time series models in different countries, emphasising short-term forecasting due to the loss of prediction power over a longer period.
Major Taxes and Their Contribution to Total Tax
This study focuses on the major taxes Personal Income Tax (PIT), Corporate Income Tax (CIT) and Value Added Tax (VAT). Over the sampled years 2008/09 to 2019/20 the three taxes contribute around 80% of the Total Tax (TTAX). The revenue data from quarter 1, 2009 to quarter 1, 2020 for each taxes of interest and Total tax was collected internally, recorded in rand million for the purpose of modelling and forecasting annual revenue using the Holt-Winters and SARIMA models. The tax types of interest are shown below in Figure 1.
The time series data in Figure 1 clearly show the increasing series of revenue collections over time with both trend and seasonality components. The visible patterns make it possible to fit the models of interest.
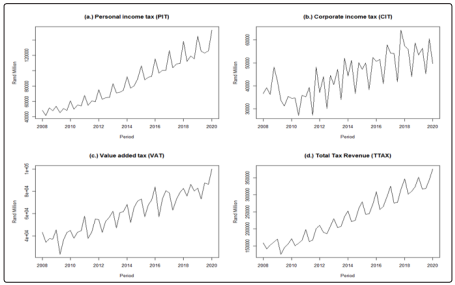
Source: South African National Treasury
Figure 1: Quarterly major taxes and total revenue
Research Methodology
This study applies the two-univariate time series model SARIMA and Holt-Winters models. The models acknowledge the lack of visible explanatory variables. However, the models assume that the explanatory part of the occurrence is inclusive in the historical path of the variable of interest. The models of interest are described below.
Holt-Winters methods are an extension of simple exponential smoothing and Holt’s trend corrected exponential smoothing method. Simple exponential smoothing is used to forecast series when there is no trend or seasonal pattern, while Holt’s trend corrected exponential smoothing is applicable when a time series displays a changing level (mean) and the growth rate (slope) for the trend. The series can assume the additive (1) or multiplicative (2) patterns.
Holt-Winters Methods give weights ( ) to the mean, trend and the seasonal components of the time series respectively and allow us to control these components for prediction. These models are represented as Holt-Winter’s Additive seasonality model in equation array (3) and the Holt-Winter’s Multiplicative seasonality model in equation array (4) below [5].
Where s is the length of seasonality (e.g., number of months or quarters in a year), Yt represent the series to be forecasted e.g. Total tax revenue, Lm the seasonal adjustment component, St the series seasonal component, m the number of period ahead to be forecast, bt the trend component and Ft+m the forecast for period m.
SARIMA models: This model captures the movement of the series and extrapolates the movement to the future values, based on the assumption that the time series involved are stationary (i.e. have no unit roots). This means that their means and the variances are constant and the co-variances are not time varying (Pindyck & Rubinfeld, 1998). The mathematical representation of this model is as follows (Shumway & Stoffer, 2006):
Hence to derive the model forecast equation 5 can be solved to be equation 6, assuming ζ=0.
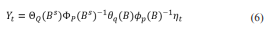
Where: p and P are the orders of non-seasonal and seasonal autoregressive (AR) components, respectively. d and D are the non-seasonal and seasonal differencing, respectively. q and Q represent the non-seasonal and seasonal moving averages (MA). s Is the seasonal component of the data (i.e. 4 if quarterly data is considered or 12 for monthly data).
There are many tests used to test model accuracy. However, the current study utilise the Ljung-Box (LB) statistic on model residual for joint hypothesis that all the (autocorrelation) for lag k are equal to zero (or centered around zero). For a larger sample n, this test statistic follows a chi-square ( ) distribution with m degrees of freedom and is defined as follows.
Holt Winters Models Fitted
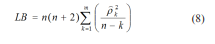
Table 1 is the model (smoothing parameters) fitted to major taxes and total tax for the period quarter 1, 2008 to quarter 1, 2020. The natural logarithms (ln) was used for PIT, CIT and Total Tax (TTAX). However, the natural logarithm transformation was not used for VAT data series. The models reveal that all variables have the presence of seasonality as the Gamma smoothing parameter is not equal to zero and all variables have the presence of a trend (beta not equal to zero) except for CIT data series. This is a true reflection of CIT as payments from companies are biannual (First and second payment) with minimal top up depending on the outcome from the SARS payments review, hence more seasonal than observed trend.
Table 1: Holt Winters Models (Smoothing Parameters)
Source: Authors computation
Table 2 below are the starting seasonal components of each tax type model presented in Table 1 above. These are simply the starting values of smoothers to initiate the fitted values for the defined Holt-Winters models defined in the research methodology section.
Table 2: Starting Seasonal Components per Tax Type
Source: Authors computation
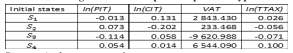
Table 3 presents the measure of accuracy from the fitted HoltWinters models on the variables of interest. VAT measure of accuracy shows the higher values, this is due to that the natural logarithm transformation was not used on VAT but the model was fitted on the original values.
Table 3: Holt-Winters Measure of accuracy
Source: Authors computation
The following section present the SARIMA models fitted to the variables. The time series models were more sensitive than the Holt-Winters models.
Sarima Models Fitted
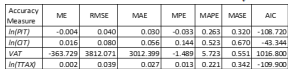
These models are concerned with the behaviour of the series residuals, aiming to obtain the minimal model with normally distributed errors. This is possible by transforming the data to be normal and by applying seasonal differencing; hence, several statistics are available to test for data stationarity. The following SARIMA models were fitted to the quarterly data: ARIMA(1,0,0)(0,1,0)4 fitted on ln(PIT), ARIMA(2,0,0)(0,1,1)4 fitted on CIT, ARIMA(0,0,0)(1,1,0)4 fitted on VAT, and ARIMA(1,0,0)(1,1,0)4 fitted on ln(TTAX) Table 4 below is the SARIMA models parameters, the autoregressive, seasonal autoregressive, seasonal moving average components and their statistics. The fitted models have a positive drift or constant term except for CIT model without a drift. This confirm the Holt-Winters model features in Table 1 above.
Table 4: SARIMA Models Parameters
Source: Authors computation
Where ζ represent a drift or constant term, ?1 represent first autoregressive component, ?2 the second autoregressive component, Φ1 the first seasonal auto regressive component and Θ1 representing the first seasonal moving average
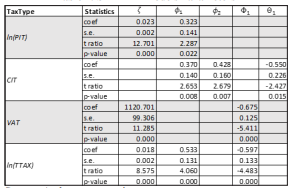
Table 5 presents the measure of accuracy from fitted SARIMA models on the variables of interest. CIT and VAT measure of accuracy shows higher values, this is due to that the natural logarithm transformation was not applied on both variables but the model was fitted on the original values.
Table 5: SARIMA Measure of accuracy
Source: Authors computation
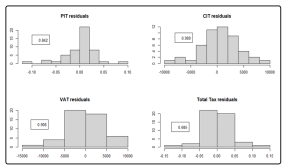
Figure 2 is the residual histogram from the SARIMA model for the variables of interest. The visual representation clearly shows the models residuals to have normal distribution and the mean centred around zero. However, the most used statistics to analyse the residual independency is the Ljungs-Box test, sometimes known as Box-Jenkins test applied on sample residuals to test if the residuals are truly independent from each another. Here if the p-value of the test is lower than 0.05 then the residuals are dependent hence if p-value is greater than 0.05 (or 5%) the residuals are said to be independent and coming from a welldefined model. The Ljungs-Box p-values in Figure 1 are all greater than 0.05 (or 5%) signifying the independency of the residuals and well-defined SARIMA models.
The Ljungs-Box p-values for PIT, CIT, VAT and Total Tax are 0.842, 0.989, 0.906 and 0.685 respectively.
Source: Authors computation
Figure 2: Residuals Histogram from SARIMA Models
Initial Insample Fit
Figure 3(e.) - (h.) are the Holt-Winters and SARIMA in sample fitted compared to the actual for the period of quarter 1, 2008 to quarter 1, 2020. The fitted models seem to follow the actual data. This indicates that the model can be used when forecasting the continuation of the historical patterns of PIT, CIT VAT and Total tax.
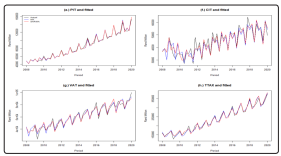
Source: South African National Treasury and Authors computation
Figure 3: Actuals and fitted (HW & SARIMA) values
Analysis of Models Forecast
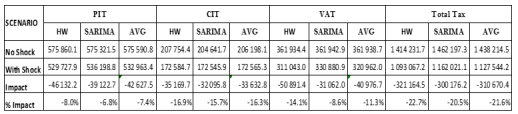
The model forecasts from both Holt-Winters and SARIMA were generated using fiscal year 2020/21 and presented in Table 1 with the data ending quarter 1, 2020. This represents the scenario of actual data that does not include the impact of COVID-19 pandemic (No shock). Assuming no shock in the economy, the total tax revenue expectation is R1, 462 trillion and PIT, CIT and VAT collection are expected to be in the interval of R1, 414 trillion to R1, 462 trillion in 2020/21. The expectation of the major taxes is also displayed in Table 1.
However, the data was expanded to include quarter 2 of 2020 calendar year, representing the second scenario where the impact of COVID-19 and the lock-down were considered (With shock), as shown in Figure 4 below. The quarter 2 of 2020 shows a deepening of the revenue collection that may serve as a base of the new trend assuming the continuation of the pandemic.
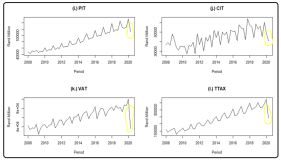
Source: South African National Treasury
Figure 4: Actuals with Inclusion of Impacted Quarter 2 of 2020
The models were used incorporating the affected quarter 2 of the calendar year 2020, which happens to be the first quarter of the fiscal year 2020/21. With the inclusion of the shock (COVID-19 and the lock-down), the revenue for 2020/21 is expected to be in the interval of R1, 093 trillion and R1, 162 trillion based on Holt-Winters and SARIMA models respectively. The total impact value will reduce the expectation amount by around R300.2billion to R321.3 billion for the fiscal year 2020/21 from SARIMA and Holt-Winters models respectively
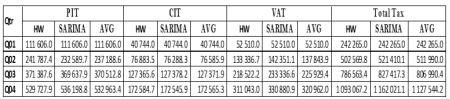
Table 1: Forecast for fiscal year 2020/21 per scenarios in rand million
Source: Authors computation
Table 2: Cumulative forecast for 2020/21 in rand million (with a shock)
Source: Authors computation, NB* Q01 are actuals
Discussion of Findings and Limitation
The state revenue collections play a critical role in uplifting the standard of both the country’s economy and improving the life of the people. The commitment within revenue authorities and taxpayers is also an important factor towards a sound and a better running of state affairs. However, the political will of the country is one of the components that can either build or destroy the country’s economy as it has the power to attract investors and good trade facilitation for the benefit of the economy and revenue collections. Therefore it is critical to have trustworthy authorities for the benefit of the country and smooth running of the state affairs.
The South African economy is mostly dependent on the state revenue, hence reporting reliable estimates or forecast for the state remains an important part for resources distribution and funds, thereby contributing to good publicity. However, there are some factors beyond the control of authorities and residents, which affect the economic activities and growth negatively such as the current pandemic, “COVID-19”.
Beside the impact of the pandemic on human health, the excessive impact of the pandemic also lead to lock-down of the economy where business struggle to operate, inflating unemployment and encouraging the illegal activities to grow, hence leading to tax avoidance. Nevertheless the accurate estimation of revenue still takes higher priority for decision making regarding the future of the country.
The current study applied two time series models, which are HoltWinters and SARIMA. The models were fitted to the major taxes and the overall tax estimates the continuation of the negative impact on the revenue for fiscal year 2020/21. Assuming continuation of the pandemic, the total revenue is expected to be around R1, 093 and R1, 162 trillion reduced from the interval R1, 414 trillion to R1, 462 trillion if there was no influence of the pandemic.
Conclusion and Recommendations
The unexpected shock (COVID-19), which started to affect GDP globally towards the end of calendar year 2019 has caused great human and economic confusion and led to most countries’ lock down. The revenue collection is sensitive to economic reaction to the pandemic, which makes it more vulnerable. Assuming the continuation of the pandemic, the revenue is expected to shrink. However, the cumulative availability of data will then encourage further amendment or revision of existing models/projections to assess the impact of the covid-19 and lock-down on the economy/ revenue, assuming the long dragging of the pandemic.
On “average”, the impact of the pandemic is expected to reduce total revenue by around R310.6bn to R1, 127 trillion from the original estimates of R1, 438 trillion for the fiscal year 2020/21. The amended average forecast for PIT, CIT and VAT due to the impact of the pandemic is R532.9billion, R172.6billion and R320.9billion respectively. The continuation of this shock will further damage both the future economic growth and the state revenue. The study further encourages model revision as more data impacted by pandemic become available.
The increase in illegal activities makes it impossible for SARS to reach maximum collection. To optimize revenue collection, the revenue authority should focus on the shadow economic activities, as it remains the untouched portion of collection and utilization of special skills in crypto currency movement and payments, applying more advance quantitative methodology that leverages statistics and computer algorithms. This might offset some of the loss of revenue due to the pandemic and lock-down in present and future fiscal years.
References
- Arndt C.Davies Rob, Gabriel Sherwin, Harris Laurence, Makrelov Konstantin et al. (2020) Impact of covid-19 on the South African economy, an initial analysis. SA-TIED working paper 111. International Food Policy Research UNU-WIDER. Retrieved from
- Botric V & Vizel M (2012) Forecasting fiscal revenues in transition countries: The case of Croatia, Croatia. Zagreb International review of Economic and Business 15:
- Chimilila C (2017) Forecasting tax revenue and its volatility in Tanzania. African Journal of Economic Review 5:
- Ebelechukwu OC, Chioma OF, Johnson B (2018) Time series analysis of monthly generated revenue in Gombe local government. International Journal of Scientific and Innovative Mathematical Research (IJSIMR). Enders, Applied econometric time series (2nd ed.). Wiley series in probability and statistics 6:
- Hyndman RJ, Makridakis S,Wheelwright SC (1998) Forecasting methods and application: Third edition. New York: John Wiley & Sons 18:
- Krever R (2020) Tax responses to a pandemic: An Australian case study. Belt and Road Initiative Tax Journal 1:
- Maliszewska M, Mattoo A, Van der Mensbrugghe D (2020) The impact of covid-19 on GDP and trade, a preliminary assessment. Policy Research Working Paper 9211. World Bank Group, East Asia and Pacific region. Retrieved from http://
- Nandi BK, Chaudhury M, Hasan GQ (2014). Univariate time series forecasting: A study of monthly tax revenue of Bangladesh. East West University Working paper https://
- National Treasury (2020) Briefing by national treasury on financial implications of covid-19 on both the economy and budget. Available from. Pretoria, South Africa. Retrieved from
- National treasury2 (2020) Supplementary budget review 2020. Pretoria, South Africa. Payoff. Retrieved from http://
- Polishchuk V (2020) Danger of financial economic consequences of covid-19 distribution in the world and Ukraine and possible countermeasures. Lutsk National Technical University. Retrieved from
- Statistics SA (2020). Statistical release P0441, Gross domestic product first quarter 2020. Pretoria, South Retrieved from
- Statistics SA QLF (2020) Statistical release P0211, quarterly labour force survey first quarter 2020. Pretoria, South Retrieved from
- UNECA (2020) COVID-19 pandemic impact on Southern Africa. final_18.1.20.pdf.