Author(s): Erasmus L. Owusu
The paper empirically examines the short and long-run causal relationship between energy consumption, CO2 emission, population growth and economic growth in South Africa. In so doing, the paper employs multivariate Granger-Causality within an ARDL-bounds testing approach to co-integration and unrestricted error correction model (UECM). The paper finds that energy usage and electricity consumption cause economic growth in South Africa but only in the short run. Additionally, the paper finds that, economic growth, population growth and energy consumption cause CO2 emission. Thus, policies should be targeted at the expansion of renewable and efficient electricity production in order to cope with the expected demand from expected population growth and from increasing demand from industries in order to maintain sustainable economic growth.
In many emerging countries due to population growth pressures, policymakers want higher economic growth by reducing the amount of raw material export and increasing the amount of processed raw materials for export via agro-processing industries (value adding) in an attempt to increase export revenues and meet the need of the people. This can be achieved through some targeted plan that requires higher energy consumption. In this respect, South Africa is a fairly industrialised economy. However, energy plays a crucial and pivotal role in the economic growth and development of every country. Many policymakers across the globe agree that CO2 emission and its associated climate change is a developmental as well as an environmental challenge.
The discussion regarding the relationship between population growth, energy consumption and economic growth has attracted a vast amount of literature from both theoretical and empirical perspective in recent years. Firstly, this paper uses the most recent time series data from 1971 to 2014 in South Africa. Secondly, it looks comprehensive at the relationship between energy consumption, CO2 emission, population growth and economic growth. Thirdly, the paper employs the auto-regression distributed lag (ARDL) for co-integration. Section 2 describes the methodology and data used. Section 3 looks at empirical analyses, as well as the discussion of the results. Section 4 provides the concluding remarks of the paper.
The paper uses a multivariate Granger-causality model within an ARDL-bounds testing framework, in order to investigate the causal relationship between carbon emission, energy consumption, electricity consumption, population growth and economic growth. The ARDL model for co-integration is conducted by taking, in turn, each variable as a dependent variable. Theoretically, CO2 emission and energy consumptions are assumed to be a function of economic growth. Thus, when energy consumed (fossil fuel), CO2 is released via economic activities.
Following Alkhathlan and Javid [1], this paper specifies a modified standard multivariate log-linear functional long run relationship between carbon emission, energy consumption, electricity consumption, population growth and economic growth as follows:
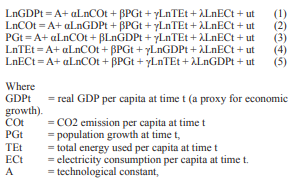
α, β, γ and λ are the long run multipliers corresponding to long-run relationships in each equation; ut is the white noise errors and Ln is the log operator. The data used in this paper are taken from the World Bank’s World Development Indicators. The econometric software used in this paper is Microfit5.0 (Oxford University Press, Oxford, UK) [5].
In theory, the transmission mechanism between the variables is such that, increase in population growth is expected to generate an increase in CO2 emission via an increase in energy consumption as a result of an increase in economic activities which in turn will lead to economic growth. The coefficients of all the variables are expected to be positive. The testing process will involve three steps. First, we will test for the stationarity of the variables. Second, examine the long run relationship between the variables using ARDL co-integration techniques. This involves the estimation of the long-run coefficients which represent the optimum order of the variables after selection by the Akaike Information Criteria (AIC) or the Schwarz-Bayesian Criteria (SBC). Finally, the paper uses the Granger causality test methodology together with the ARDL approach for the causality results.
In the context of the ARDL, the paper specifies the following unrestricted error correction model (UECM):
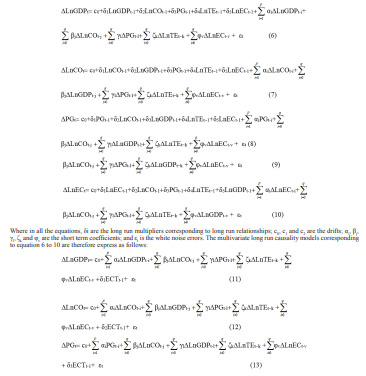
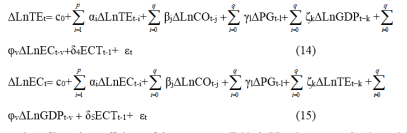
Where in all the equations, δi are the coefficients of the error correction term (ECT); c0, is the drifts; αi, βj, γl, ζk and φv are the short term coefficients; and εt is the white noise errors. The short-run causal impact is measured by using the F-statistics on the explanatory variables in the Granger causality test; while the long-run causal impact is measured by using the error-correction term (ECT) in the ARDL methodology.
According to Pesaran et al., the ARDL-bounds test does not require that all variables be integrated of the same order. It is only required that all variables are integrated of order 0 or 1. It is, therefore, vital to conduct a unit root to ensure that all the variables are integrated of order 1 at most. Tables 1 to 4 below show the results of the Augmented Dickey-Fuller and Phillips and Peron unit root tests for the relevant variables [2-4].
Table 1: ADF unit root tests for the variables in levels
| Variable | No Trend | Result | Trend | Result |
|---|---|---|---|---|
| LnGDP | -0.544 | N | -1.009 | N |
| LnCO | -2.003 | N | -2.034 | N |
| PG | -2.092 | N | -5.985 | S |
| LnTE | -2.217 | N | -2.242 | N |
| LnEC | -3.329 | S | -1.535 | N |
Notes: 95% published asymptotic critical value including an intercept but not a trend is -2.932 and the value including an intercept and a trend is -3.519. S = Stationary and N = Nonstationary. Ln is the natural log operator. Source: Data output via Microfit 5.0
Table 2: ADF unit root tests for the variables in the first difference
| Variable | No Trend | Result | Trend | Result |
|---|---|---|---|---|
| δLnGDP | -3.747 | S | -4.108 | S |
| δLnCO | -4.171 | S | -4.203 | S |
| δPG | -8.753 | S | -8.553 | S |
| δLnTE | -4.313 | S | -4.364 | S |
| δLnEC | -3.483 | S | -4.841 | S |
Notes: 95% published asymptotic critical value including an intercept but not a trend is -2.934 and the value including an intercept and a trend is -3.522. S = Stationary and N = Nonstationary. Ln is the natural log operator. Source: Data output via Microfit 5.0
Table 3: PP unit root tests for the variables in levels
| Variable | No Trend | Result | Trend | Result |
|---|---|---|---|---|
| LnGDP | -0.487 | N | -0.713 | N |
| LnCO | -1.610 | N | -1.530 | N |
| PG | -1.018 | N | -1.363 | N |
| LnTE | -1.964 | N | -1.694 | N |
| LnEC | -6.440 | S | -1.847 | N |
Notes: 95% published asymptotic critical value including an intercept but not a trend is -2.930 and the value including an intercept and a trend is -3.516. S = Stationary and N = Nonstationary. Ln is the natural log operator. Source: Data output via Microfit 5.0
Table 4: PP unit root tests for the variables in the first difference
| Variable | No Trend | Result | Trend | Result |
|---|---|---|---|---|
| δLnGDP | -4.313 | S | -4.148 | S |
| δLnCO | -6.339 | S | -6.418 | S |
| δPG | -4.735 | S | -4.355 | S |
| δLnTE | -6.250 | S | -6.412 | S |
| δLnEC | -4.817 | S | -5.993 | S |
Notes: 95% published asymptotic critical value including an intercept but not a trend is -2.932 and the value including an intercept and a trend is -3.519. S = Stationary and N = Nonstationary. Ln is the natural log operator. Source: Data output via Microfit 5.0
As can be seen from Tables 1 o 4, all the variables are either I(0) or I(1) - using the Augmented Dickey-Fuller and the Phillips and Peron unit root tests. The paper, therefore, rejects the null hypothesis that the variables are non-stationary [2,4].
The results of the co-integration test, based on the ARDL-bounds testing approach, are reported in Table 5. The results show that, in all the models, the null hypothesis of no co-integration is rejected. This implies that there are long-run co-integration relationships among the variables in all the models in South Africa.
Table 5: Bounds F-test for co-integration
| Dependent variable | Functions | F-test statistics | ||||
|---|---|---|---|---|---|---|
| LnGDP | FLnGDP (LnGDP| LnCO, PG, LnTE, LnEC ) | |||||
| LnCO | FLnCO (LnCO| LnGDP, PG, LnTE, LnEC ) | |||||
| PG | FPG (PG| LnGDP, LnCO, LnTE, LnEC ) | |||||
| LnTE | FLnTE (LnTE| LnGDP, PG, LnCO, LnEC, ) | |||||
| LnEC | FLnEC (LnEC| LnGDP, PG, LnCO, LnTE, ) | |||||
| Asymptotic Critical Values | ||||||
| Pesaran et al.,[3], p.301, Table CI(iv) Case IV | 1% | 5% | 10% | |||
| I(0) | I(1) | I(0) | I(1) | I(0) | I(1) | |
| 3.81 | 4.92 | 3.05 | 3.97 | 2.68 | 3.53 | |
Note: *, ** and *** denote statistical significant at 10%, 5% and 1% levels respectively. Source: Data output via Microfit 5.0
As can be seen from Table 5 show that there is long run co-integration relationship between the all the variables. The next step is to test for causality between the variables using the Granger-causality (F-Statistics) methodology.
The results of the causality test between all the variables and their respective error correction terms are presented in Table 6.
Table 6: Results of Granger-Causality and ECT tests
| Dependent Variable | F-statistics[probability] | ECT(-1) [t-statistics] | ||||
|---|---|---|---|---|---|---|
| δLnGDP | δLnCO | δPG | δLnTE | δLnEC | ||
| δLnGDP | - | 0.002 [0.965] | 0.001 [0.975] | 6.496** [0.015] | 22.791*** [0.000] | -0.024 [-0.508] |
| δLnCO | 4.141** [0.005] | - | 13.277*** [0.000] | 6.063*** [0.001] | 0.001 [0.975] | -2.322*** [-7.686] |
| δPG | 0.002 [0.965] | 9.594*** [0.004] | - | 10.431*** [0.003] | 0.003 [0.957] | 0.003 [0.957] |
| δLnTE | 5.818*** [0.008] | 16.356*** [0.000] | 14.028*** [0.000] | - | 5.479** [0.026] | -2.137*** [-8.883] |
| δLnEC | 7.169** [0.013] | 0.001 [0.975] | 4.734*** [0.006 | 6.063*** [0.001] | - | -0.409** [-2.135] |
*, ** and *** are 10%, 5% and 1% significance level respectively
The results in Table 6 show that there is a short run bi-directional between energy usage and electricity consumption on one hand and economic growth on the other hand. However, there is only a uni-directional causality from economic growth to energy usage and electricity consumption in the long run. Also, there is a unique and very strong bi-directional causality between population growth and CO2 emission both in the short and long runs. Furthermore, there is a strong bi-directional causal relationship between population growth and energy usage and electricity consumption in South Africa. Other findings are: (i) a uni-directional causality from population growth to electricity consumption in both the short and the long runs; (ii) there is a bi-directional causality between energy usage and electricity consumption in short and long runs; (iii) and finally, a bi-directional causal relationship between CO2 emission and energy usage in the short and long runs in South Africa.
Furthermore, the regression for the underlying ARDL models fits very well and they pass all the diagnostic tests against serial correlation, functional form, Normality and Heteroscedasticity based on the Lagrange Multiplier (LM) Test Statistics as shown in Table 7. Finally, an inspection of the cumulative sum (CUSUM) and the cumulative sum of squares (CUSUMSQ) graphs (not reported here) from the recursive estimation of the model, indicates that there is stability; and there are no systematic changes detected in the coefficient at a 5% significance level over the sample period.
Table 7: ARDL-UECM Models Diagnostic Tests
| LM Test Statistics Results | LnGDP | LnCO2 | PG | LnTE | LnEC |
|---|---|---|---|---|---|
| R-Square | 97.9% | 97.5% | 99.8% | 99.0% | 98.9% |
| Serial Correlation: CHSQ(1) | 2.337 [0.126] | 0.414 [0.520] | 0.166 [0.683] | 1.045 [0.307] | 1.492 [0.222] |
| Functional Form: CHSQ(1) | 0.091 [0.763] | 0.085 [0.771] | 0.204 [0.651] | 1.394 [0.122] | 2.641 [0.092] |
| Normality: CHSQ(2) | 1.516 [0.469] | 0.333 [0.846] | 1.055 [0.590] | 2.758 [0.252] | 1.727 [0.422] |
| Heteroscedasticity: CHSQ(1) | 0.002 [0.968] | 2.197 [0.138] | 0.095 [0.758] | 0.330 [0.565] | 0.939 [0.333] |
The paper empirically analyses the causal relationship between CO2 emission, population growth, energy consumption and economic growth in South Africa for the period from 1971 to 2014. The paper employs the ARDL-bounds testing approach of co-integration and unrestricted error correction model (UECM) using a multivariate Granger-Causality methodology to investigate the causal relationship between the variables. The paper finds that energy usage and electricity consumption Granger-cause economic growth in South Africa but only in the short run. Additionally, the paper finds that, economic growth, population growth and energy consumption Granger-cause CO2 emission as expected in the transmission mechanism.
For sustainable economic growth in South Africa, the policy implications arising from the findings in this paper, therefore, are that, for population growth control measures, policymakers should target both short and long run effective policies in order to reduce the amount of CO2 emissions in South Africa. Furthermore, policies directed at the expansion of electricity production must be intensified in South Africa in order to cope with the expected demand. Finally, given that population growth has an impact on electricity consumption and energy usage with its related CO2 emission in South Africa, policies should be geared towards environmentally friendly economic growth through enhancement and consumption of cleaner energy and incorporating policies on population growth, urbanization and industrialisation.