Author(s): Sele Yalaghuli
Almost a decade and a half has passed since South Africa joined BRICS in 2010 and it is yet to reap the full economic benefits and advantages which it was promised. For this reason, this article assesses the extent to which the ‘Flying Geese’ model can assist South Africa, as a late comer to BRICS, to catch up with the other members within the grouping by expanding its market presence. It will do so by examining the GDP composition of each of the original BRICS member states between 2010 and 2022 in order to identify which labour-intensive economic activities may be passed down from the so-called “lead goose”, being China, to the latecomer, South Africa. It will analyse the extent to which BRIC nations have shifted its production from consumer to capital goods and whether this is reflected in the grouping’ sexports, as suggested by the Flying Geese model. The article will also make brief use of the Cobb-Douglas production function to showcase the relationship between output and production inputs within BRICS.
This article earmarks the textile manufacturing industry as one such sector for consideration. Textile manufacturing activitiesare already being relinquished from China to India, and indeed a newcomer, Ethiopia. It provides recommendations and caveats for the plausible adoption of this development strategy for the BRICS+ group as a means to strengthen South Africa’s manufacturing base, and thereby help address its pressing socioeconomic concerns of high youth unemployment, poverty and underdevelopment.
In 2001, Goldman Sachs economist, Jim O’Neill coined the acronym BRIC in a paper titled “Build Better Global Economic BRICs”. The paper discussed the economic potential of the fastest growing developing economies who did not form part of the G-7 (Group of 7, i.e. Canada, France, Germany, Italy, Japan, the United Kingdom, and the United States). These developing economies included Brazil, Russia, India, and China (BRIC). O’Neill predicted that by 2050 the four BRIC economies would come to dominate the global economy. In an effort to challenge a unipolar Western world order led by the United States of America (USA), these four countries set up a group known as BRIC. They did so with a view to amplify the voices of the Global South within global politics. The quartet ran with O’Neill’s idea, holding its first summit in 2009 in Yekaterinburg, Russia on June 16, with the aim of promoting commercial, political and cultural cooperation.
In 2010, through a “Chinese-initiated invitation”, South Africa joined the BRIC group [1]. South Africa’s admission into BRIC was partly attributed to its economic stability and growth, but also to the political leading role the country played in Africa and the world. In so doing, the acronym changed from BRIC to BRICS (S standing for South Africa). Since then, the group has admitted the following five new members as of 1 January 2024: The United Arab Emirates (UAE), Iran, Saudia Arabia, Egypt, and Ethiopia.
BRICS, like every economic or political organisation, provides economic and political opportunities for its members. Evidently, participating in BRICS and conducting national economic policies to alleviate poverty are not contradictory. BRICS can bring opportunities to its members to enhance their economic position globally through increased trade and investment. In so doing they can also respond to the crucial poverty problem faced by the majority of their populations. Related to this, many articles and studies have been published to address various aspects of the benefit acountry is able to gain from its membership and participation in a grouping such as BRICS [2-6]. However, to do so, there is an urgent necessity to maintain a strategic balance between trade and domestic imperatives. For this reason, the South African government views its membership within BRICS as a strategic external partnership which would assist the country in meeting its pressing domestic developmental objectives as well as an opportunity to regain its position as Africa’s economic hegemon.
Indeed, since it gained democracy in 1994, South Africa has struggled to address one of its most pressing socioeconomic issues, namely, how to uplift the vast majority of the population living in poor conditions. A total of 18.2 million South Africans were recorded as living in extreme poverty in 2023 [7]. This figure is projected to increase to 19.1 million by the year 2030 [7]. In fact, despite the democratisation, and some specific redress programmes (i.e. positive discrimination in the form of the Broad- Based Black Economic Empowerment [BBBEE] strategy), the country still faces huge socioeconomic hardships with subsequent real detrimental impacts on its economy andsustainability. For example, figures from 2022 show that 64 percent of Black South Africans continue to live in poverty despite efforts at addressing the problem [8]. The majority of the population is still not benefitting from the economic growth the country experienced before and even after apartheid. This is most clearly shown by the country’s Gini Coefficient of 0.65 which makes it one of the most unequal societies in the world [9].
Although all four original BRICS members are regarded as economic powers in their own right, whether globally or regionally, the same cannot be said about South Africa. In comparison, it has overwhelmingly the smallest economy in the bloc. It must also be noted that South Africa was ranked as having the third largest economy in Africa for the year 2023 with a GDP of $405.71 billion. First place went to Nigeria (with a GDP of $477.38 billion) and Egypt took second place (with a GDP of $475.23 billion) [10]. According to the South African government, reasons for the country’s weak economic growth include, power cuts, the poor performance of the logistics sector, high inflation, rising borrowing costs and a weaker global environment [11].
Up until the present, South Africa’s relatively small economy has posed severe limitations to the extent to which the countrycan fully benefit from being a member of the group – particularly when compared tothe initial five members. For example, South African faces what seems to be insurmountable market competition from BRICS in major sectors such as clothing and textiles, steel and the automotive sector [12]. For its part, its manufacturing industries are not as strong and developed as those of its BRICS partners. Cheap Chinese exports have already “decimated” the textile sector in South Africa as well as the shoe industry in Brazil (Russel). China’s rapidly expanding export base has been difficult to compete with and is exacerbated by China’s policy of allowing the yuan to rise slowly and thereby undervaluing itscurrency. With China clearly at an advantage, it is difficult to imagine a sustainable and equitable trade relationship with South Africa.
Compounding this situation, South Africa also runs a trade deficit with the original four members of the group: Brazil, Russia, India, and China. Figures from 2022 show that its trade deficit has increased four times since it joined the bloc in 2010. In 2010, its trade deficit amounted to US$ 3.7 billion, which increased to US$ 14.8 billion in 2022. This is largely due to the fact that South Africa mainly exports raw materials without any added value to its BRICS partners. In 2022, the composition of its export basket consisted largely of mineral products such as coal (19.1 percent), iron ore (18.9 percent), manganese (12.2 percent), ferro-alloys (7.6 percent) and chromium ores (6.7 percent). In comparison, South Africa mainly imports manufactured goods from its BRICS partners such as petroleum oils (10.7 percent), motor vehicles (5.3 percent) and electric accumulators (2.3 percent) [13].
Cognisant of the above, this article seeks to explore possible strategies and re-distributional mechanisms which could be employed within BRICS to promote sustainable and fairer trade relations among its economically stronger and weaker members, such as China and South Africa. It does so by drawing on the Flying Geese model, developed by the Japanese economist, and closely associated with the East Asian Miracle of the 1950s and 1960s. Broadly speaking, the Flying Geese model is a model of global economic development which uses visual imagery of a gaggle of geese flying in a ‘V’ formation. The model demonstrates how economies within a regional bloc or group are able to develop under the direction of the ‘lead goose’ being the leading economy [14].
As such, this article aims to assess the extent to which the Flying Geese model can assist South Africa, as a latecomer to BRICS, in ‘catching up’ with the other members within the grouping by expanding its market presence inthe bloc. It will do so by examining the economic composition of each of the original BRICS member states (Brazil, Russia, India, and China) between 2010 and 2022 in order to identify which labour-intensive economic activities may be applicable to South Africa from the ‘lead goose’, being China. It will do so, specifically, by assessing the extent to which BRIC nations have shifted its production from consumer to capital goods and how it has beenreflected in its exports, as suggested by the Flying Geese model. The article will also make brief use of the Cobb-Douglas production function to showcase the relationship between output and production inputs within BRICS.
This article specifically earmarks the textile manufacturing industry as one such sector for consideration for the said model. Here, the model has already revealed that textile manufacturing is already being transferred from China to India, and indeed a newcomer, Ethiopia. It provides recommendations and caveats for the plausible adoption of this development strategy for the BRICS+ group as a means to strengthen South Africa’s manufacturing base, and addressing its pressing socioeconomic concerns of high youth unemployment, poverty and underdevelopment. BRICS member states are by no means obligated to strengthen the economies of weaker member states, doing so may be viewed as economically imprudent and rightfully so. However, ensuring that all economies within the bloc are strong and thriving serves the underpinning geopolitical raison d’être of the group, i.e. to serve as a formidable counterweight to the Global North.
The remainder of the article is structured as follows: Following from the introductory section, this article will locate its study within the literature by way of presentinga literature review. Thereafter, it will outline its theoretical framework, methodology and present its findings. With reference to the Flying Geese model, this article will then provide some strategic recommendations which will aid South Africa in taking advantage of its huge natural resources endowments, its human capital, its industries, and its participation in BRICS through the formation of a textile development pact with China. This is all with the view of improving its economy with real trickle-down effects to alleviate poverty and open up the era of a real emerging economy on par with its BRICS+ members.
The post-World War Two rapid economic growth and industrialisation of East Asia has been a phenomenon which has gripped the attention of many scholarsand practitioners alike. As will be shown within this brief literature review, the Flying Geesemodel has been a useful explanatory tool used by many scholars and academics to account for the lead role which Japan played in heading the process of rapid industrialisation within the East Asian region. As previously noted, the Flying Geesemodel of economic development was devised by [14] .to explain Japan’s pattern of technological development which, in turn, filtered down to the surrounding Southeast Asian economies. Since then, many authors have written on the topic: [15-17]. provide an historical analysis of the Flying Geese model as it relates to Japan in their respective studies. However, goes further by testing the empirical validity of the theory at the time of writing [18]. offers an alternative assessment of Japan’s Flying Geese strategy. Nester’s study adopts a psycho-cultural analysis of the case. In so doing, Nester attempts to draw a correlation between Japan’s psycho-cultural “make-up” and its unique patterns of development as portrayed by the Flying Geese model. His study concludes that Japan’s role of economic hegemon and “lead goose” within the Asian region can largely be attributed to its neo-mercantilistic aspirations which in turn are a reflection of its vertical societal structure (encapsulated in the term tate shake) [18]. Picking up from where Nester left off, Carlota V. [19]. approaches the discussion through a historical socio-cultural perspective. Cortez seeks to go beyond Nester’s analysis by isolating the precise socio-cultural dimension of the Flying Geese model. then, Japan’s pattern of development – as exhibited by the V formation of the Flying Geese model is less a reflection of political and economic strategy (as alluded to by Nester) and more to do with Japan’s vertical societal organisation.
There have also been studies which have been conducted which assess the Flying Geese paradigm outside of the Japanese experience: Various studies have located the Flying Geese model within China – showcasing how the economy shifted its production from consumer to capital goods [20-23]. A study conducted by [24]. goes as far as to explore how China’s Flying Geese pattern of development has in fact expanded its horizons to Africa – which is indicative in the number of manufacturing firms currently operating out of the continent.
There are also studies which go beyond the Asian region and assesses the use of the model in other parts of the world. For example, conducts a comparative analysis of specialisation patterns relating to productivity growth and production upgrading in East Asia and Latin America [25]. concludes that while East Asia’s industrial upgrade closely followed the Flying Geese Model, Latin America’s industrial upgrade was as a result of explicit policy tools and measures. Turning to the Sub-Saharan African region, Oludele A. Akinboade and Daniel [26]apply the Flying Geese Modelto the continent’s economic development. Here, the two authors select South Africa as the “lead goose” of the African continent in providing empirical evidence showcasing how the country may act as a “regional growth pole [26].
As has been shown, then, much has been written about the Flying GeeseModel as it relates to East Asia, in particular. However, there exists no study within the literature which explicitly explores the ways in which the Flying GeeseModel may be used within the BRICS grouping in an effort to assist latecomers, such as South Africa, in transforming its economy into an industrial heavyweight such as its counterparts. This article intends to do just that.
As mentioned in the introduction, the Flying Geese model is a theoretical economic model of industrial development for latecomer economies. It is based on the long-term pattern of development of Asia, under the leadership of Japan and its experience of industrial development between 1860up until the 1930s [19]. The strategy is aptly summarised by former Japanese foreign minister Saburo [26].
“The nations of the region engineer successivetake-offs and are soon moving on their way to higher stages of development. It is akin to a V formation, and the relationship among the countries in the formation is neither horizontal integration nor vertical integration as they are commonly known. Rather it is a combination of both. And because the geese that take off later are able to benefit from the forerunner’s experiences to shorten the time required to catch up, they gradually transform the formation from a V-formation to eventual horizontal integration.”
The Flying Geese model of economic development is based on the following four stages [14]: In the first stage, the would-be lead economy, without having established a manufactured base, imports manufactured consumer goods. In the second stage, the country begins to set up its manufacture base by establishing infant industries to manufacture what was previously imported manufactured goods. In this stage, the country imports the necessary capital goods (such as heavy equipment, vehicles and tools) required for manufacturing. Domestic industries subsequently begin to export their manufactured goods during the third stage. Finally, that manufacturing sector of the now lead economy or “lead goose” would have successfully caught up with that of the developed nations as it moves up the value chain and begins exporting capital goods and less manufactured consumer goods. An emphasis on capital goods is important given its crucial role in the industrialisation of “latecomers”. As stated by [27]. machines increase the work productivity; the sector has the advantage to get more productivity gains compared to other sectors; and the technology diffusion provided by the sector contributes to increasing the overall productivity within the economy”.
In this way, it makes space in the market for countries in the lower tiers who are waiting in the wings to begin their own process of setting up the respective manufacturing industries.
This research article is based on a comparative study of the original five BRICS nations (Brazil, Russia, India, China, and South Africa) in which it compares the GDP composition of each economy between 2010 and 2022.While the BRICS bloc has expanded since 01 January 2024 to include five new members (Saudi Arabia, Egypt, UAE, Iran, and Ethiopia), this study will not include them given the insufficient availability of trade data at the time of writing.
It seeks to compare the GDP composition of each country in order to identify which labour-intensive economic activities may be shed from the “lead goose”, being China, to South Africa as part and parcel of the Flying Geese model.
This article also has a key assumption that as much as a specific country becomes economically complex, the potential to increase its GDP increases as well.
The study will also make use of the Flying Geese Model. This will help assess how South Africa can take advantage of this model to launch a catch-up strategy to improve its economic position within BRICS and in Africa, and its trade relations with the other members in the group. The study will use this model to assess the extent to which BRIC nations have shifted its production from consumer to capital goods and whether this is reflected in its exports.
Linked to the Flying Geese Model will be the brief use of the Cobb-Douglas production function to showcase the relationship between output and production inputs within BRICS.
The simplified model of Cobb-Douglas is presented like this: Q = f (αK, βL), where
Q is the Quantity Produced
K is the capital (Physical and Financial)
L is the Labor (Human resources, Knowledge Embedded in Products).
α andβ are the weights affected to each factor of production. α + β = 1
This simplified mathematical model is the explanation behind the success of emerging countries, among which are BRICS, by the way to understand the importance given to each factor over time.
Since Adam Smith, economic growth was essentially related to natural endowments. But thanks to the Industrial Revolution in England, the triggers of economic growth changed, and embrace many other factors. Starting from that point, we can assume that the Cobb-Douglass Model played, and continues to play, even today, an important role in understanding and explaining economic growth, and its difference among nations.
For example, emphasising formal education and technical training is the key to the economic take-off of China. In fact, in their studies, of the School of Economics, Minzu University of China demonstrate the evidence of the strong correlation between the education in China and the socioeconomic development [28].
China, facing the absence of physical, and financial capital by the end of 1970s, and under the Presidency of Deng Xiaoping, launched termed “socialism with Chinese characteristics” and “socialist market economy. This helped to open the economy to foreign investors in various sectors including textile, manufactures. And thanks to the massive labour force in the country, these sectors presented huge opportunities for investors [28].
Even more recently, foreign direct investment (FDI) continues to play a crucial role in tracking the China’s economy, according to the United States Department of State [29]. And this, despite the relatively restrictive investment environment for foreign investors. Thus, taking advantages of the international trade, and thanks to the work force, many reforms aimed to improve the business environment and attract FDI. Thus, some countries (mainly Asian, such as India, Indonesia, Thailand, the Philippines, and Vietnam) started in the end of seventies to modernise their economies, opening opportunities in terms of economic expansion (Ha, 2021). These economies started to move from a traditional scheme to more sophisticated ones. The main result is that they started to experience sustainable economic growth, catching up with more developed countries, and alleviating the poverty among their citizens (Ha).
In this way, these economies contradicted mainstream liberalthinking, both in politics and economic.In fact, politically, the dominant thinking asserts that only a political system based on democracy (based on western way) can facilitate the right economic policies, as triggers for the growth and development. Economically, the mainstream thinking taught that only the free market is the suitable way to efficiently allocate resources within a country and correct all deviations that are negative externalities which are physical and institutional constraints for growth.
Paradoxically, some countries, whose politics and economy functioning are far away from western model experienced economic growth and poverty alleviation. And some others, with a mix of democracy with their own political characteristics, were able to improve their economies, and are poised to surpass some European countries, in terms of GDP. For example, China, Brazil,
India, Russia [30].
In the beginning of their takeoff (to use theoretical concept associated with his “takeoff”model) these countries have taken advantages of the so-called creative destruction developed by [31]. This is because innovation is the driving force of economic growth. Countries located on the periphery of the global economy,took advantages of the dismantlement of small industries (textiles, and manufacturing) in countries located within the economic centre, and thanks to the massive labour force available in the countries, attract FDI in these sectors. This laid the basis of their economic growth.
Thus, China, India, Brazil started to become the world factories. Mainly China, whose share in the international trade started to grow faster than western countries. For example, in 2020, China’s share in international trade was 15%, while USA held 8,1% and Germany 7,8% [32]. This opened a new era and a possibility of a greater balance of power within international relations in which the dominance of Western hegemony was beginning to be challenged.
This is where BRICS, thanks to their economic vigour, decided to constitute themselves as an answer to the crucial question of dominant position of western countries, and a kind of counterforce to the so-called unipolarity.As will be illustrated below through use of graphs, BRIC countries experienced sustainable economic growth, but also engaged themselves in the economic diversification; let us say complexification.
Consequently, more and more, many countries are seduced by the political and the economic model of BRICS and started to knock on their doors for membership. Thus, during the last BRICS summit hosted by many countries applied for integrating the organization. Including some countries under the auspices of the USA, like Egypt, Saudi Arabia.These emerging countries have demonstrated sustainability in economic growth, and launched important reforms, following in the footprints of BRICS. This ultimately justified their political will to join them.
Assessing the Gross Domestic Product (GDP) and Export Composition of BRIC Economies (2010 – 2022)
Before delving into the composition of the four countries’ GDPs, let us begin by reviewing the GDP of BRICS’ member states from 2000 up until the projected 2028 as depicted below in
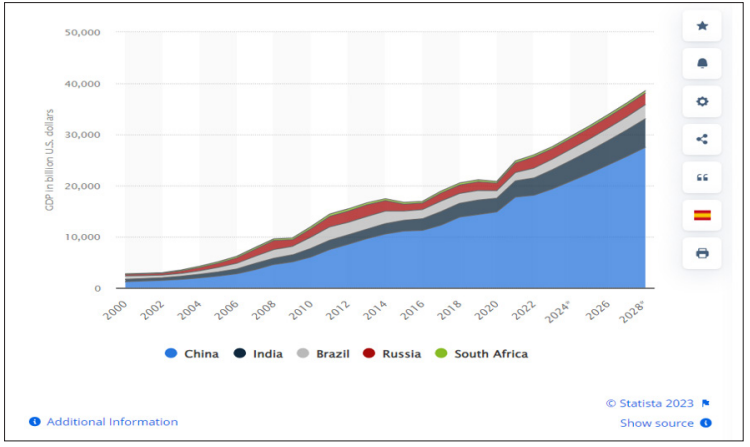
Figure 1: GDP of BRICS Countries from 2008 – 2028 (in U. S. dollars)
Source: BRICS: GDP per Country 2028 | Statista.
As illustrated above in Figure 1, China has experienced the fastest economic growth in comparison to the other four countries. Indeed, its GDP has grown exponentially beginning from US$ 1.2 trillion in the year 2000 to a projected US$23.61 trillion in 2028 [33].
Being the second largest economy in the world, it is predicted that China’sGDP is set to surpass the USA (being the largest) by the end of the 2020s)[33]. The spot of the second largest GDP has shifted between Brazil, Russia, and India. However, since 2015, India has held the second place with a recorded GDP of US$ 2.1 trillion while Brazil and Russia (both having experienced a contraction in their economies) registered GDPs of US$1.8 and US$1.356 trillion, respectively [33]. While alluded to within the introduction of this article, Figure 1 provides a visual representation of how minute South Africa’s GDP is in comparison to the rest of the original BRIC members: Its GDP for 2000was recorded at US$151. 85 billion and is projected to expand to US$459.02 billion in the year 2028 [33].
Below, with the aid of Figures 2 – 13, this article will assess the GDP composition of Brazil, Russia, India, and China, respectively. Beyond that, it will also critically evaluate the extent, if any, to which each economy has successfully moved up with the value chain by shifting from the manufacturing and exporting of consumer goods to capital goods – as assumed under the Flying Geese model.
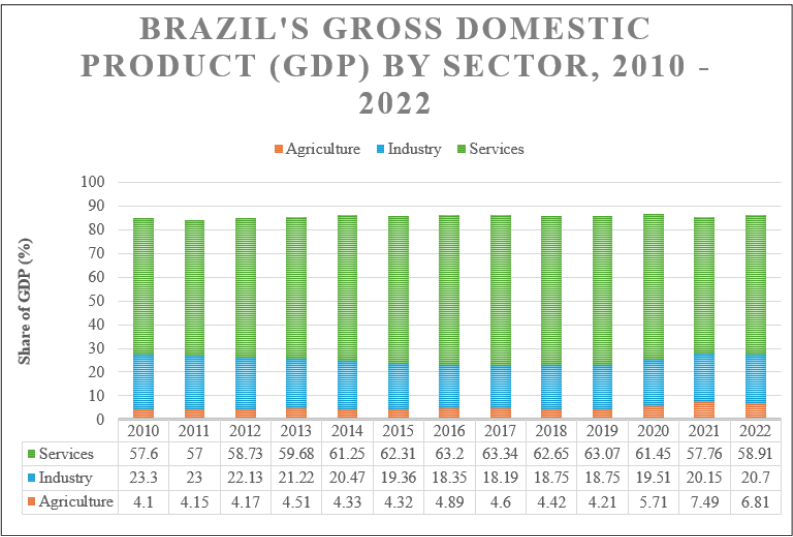
Figure 2: Brazil’s GDP by sector, 2010 – 2022.
Source: Statista [33] & World Bank [34].
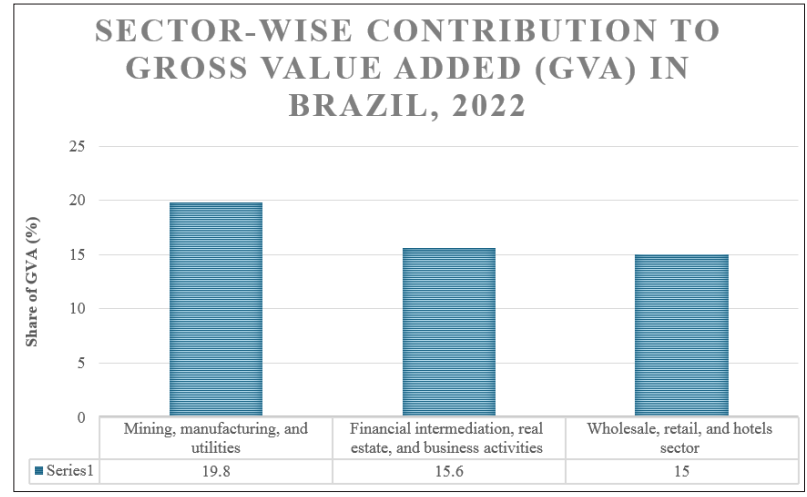
Figure 3: Sector-Wise Contribution to Gross Value Added (GVA) in Brazil, 2022
Source: Global Data [35].
Both Figures 2 and 3 provide an adequate visual overview of the composition of Brazil’s GDP together with the percentages of value added to the economy by the major sectors. The information in these two graphs is befitting of that of an emerging economy. As shown in Figure 2, between 2010 and 2022 Brazil’s services sector (led by its education, franchising, travel and tourism subsectors) has consistently contributed the most to its GDP.
Figure 3 indicates that Brazil derives much of its value addition from mining, manufacturing and utilities sector (19.8 percent).
Yet, to fully explore Brazil’s pattern of development according to the Flying GeeseModel, one must assess and compare its consumer and capital goods exports to ascertain whether there has been a greater shift towards capital goods exports. Historically, the Brazilian economy focused on consumer goods (such as sugar, cotton, and gold). It made a shift to the production of more capital goods in the 1990s and implementedpolicies such as the Industrial, Technological and Foreign Trade Policy (PITCE), between 2003
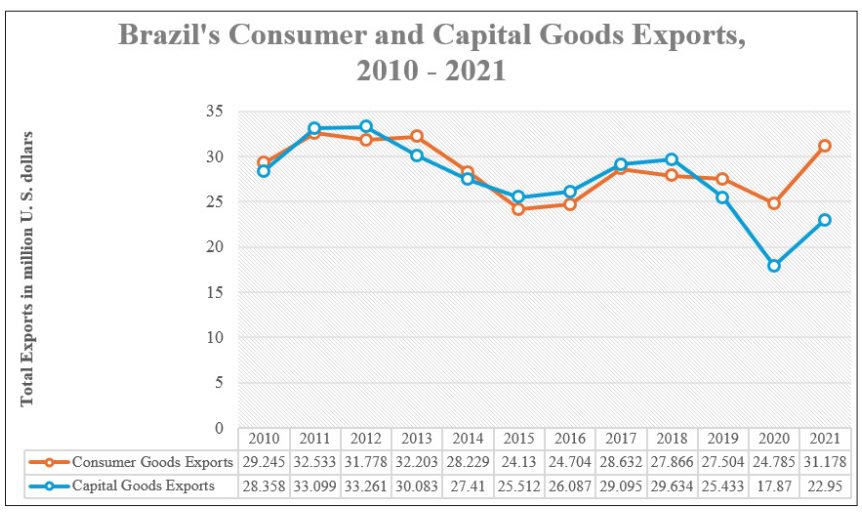
Figure 4: Brazil’s Consumer and Capital Goods Exports, 2010 . 2021
Source: World Integration Trade Solution (WITS) [37].
As can be seen from the above figure, Brazil’s consumer and capital goods exports have followed each other closely, overtaking each other interchangeably at various points. While capital goods exports exceeded consumer goods between 2015 and 2018, the period under review concluded with consumer goods exports surpassing the former. The latest 2021 figures from the World Bank shows Brazil’sconsumer goods exports total US$ 31.178 million, accounting for 11.1 percent of total exports and its capital goods amount to US$ 22. 950 million accounting for 8. 17 percent of total exports [37].
RUSSIA
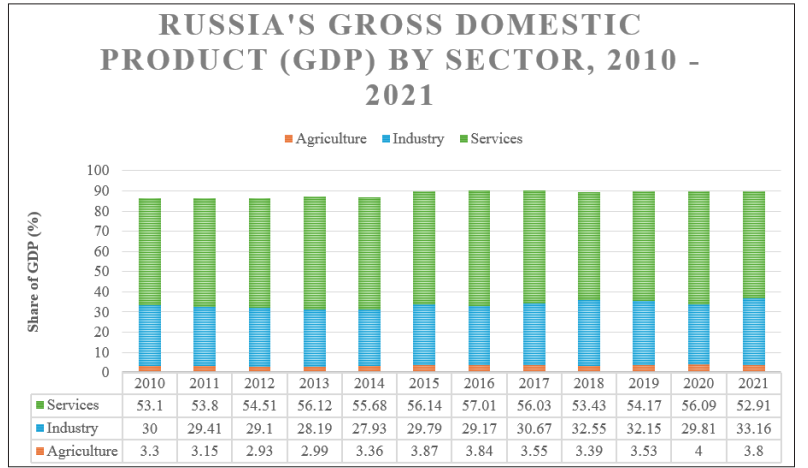
Figure 5: Russia’s GDP by Sector, 2020 - 2021
Source: Statista [7].
INDIA
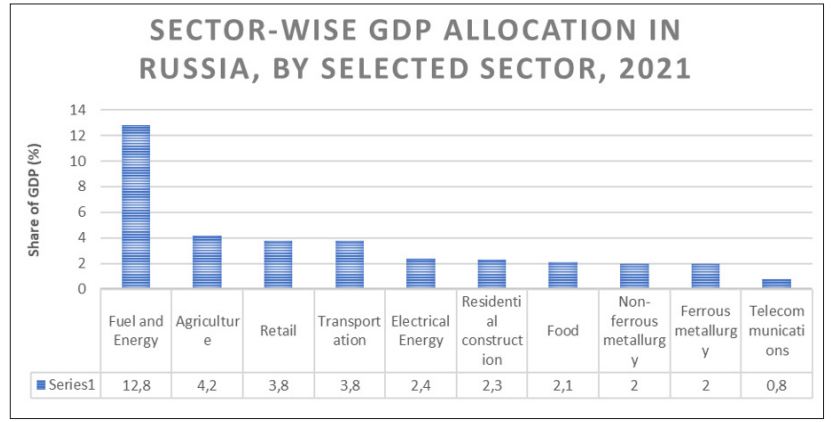
Figure 6: Sector-wise GDP allocation in Russia, by selected sector, 2021
Source: Statista [7]
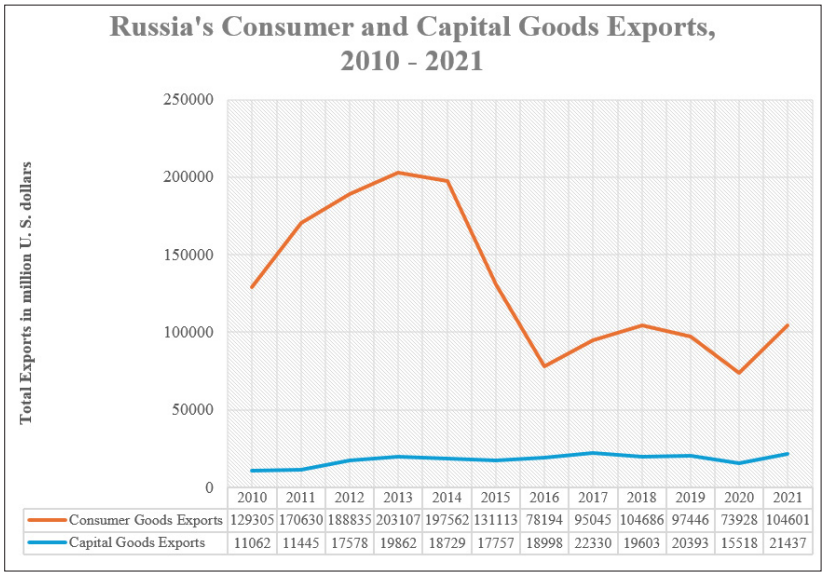
Figure 7: Russia’s Consumer and Capital Goods Exports, 2010.2021
Source: WITS [37].
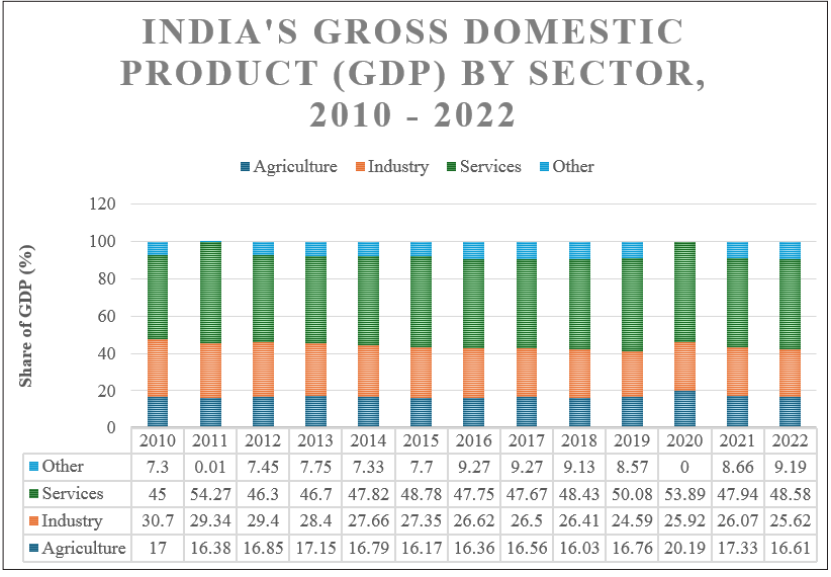
Figure 8: India’s GDP by sector, 2010 - 2022
Source: Statista [7], World Bank [38] & Ministry of Statistics and Program Information [39].
Similarly to Brazil and as shown in Figure 5, Russia’s service sector has consistently held the largest share of the country’s GDP over the period under review. Comprising 53.1 percent in 2010, the services sector reached its peak in 2016 (57.01 percent) and dropped to its lowest (52.91 percent) in 2021. By comparison, its agricultural sector has contributed the least to its GDP – a minimal 3.3 percent in 2010 which rose slightly to 4 percent in 2020 andsettled on 3.8 percent in 2021. Russia’s main exports are fuels and energy products (such as crude oil and natural gas), and this is reflected in Figure 6in which it is shown that the sector contributed 12.8 percent to its GDP for the year 2021. Granted that Russia is the fourth largest oil exporting region in the world, it comes as no surprise that there is a wide gap between the total consumer and capital goods exports as shown in Figure 6 (Statista, 2023)[7].Contrary to Brazil, then, Russia’s oil and energy exports (being consumer goods) account for the high amount of consumer goods exports in comparison to its capital goods exports: The biggest divergence recorded in 2013 with its consumer goods exports (US$ 203 107 million)registered at ten times greater than its capital goods exports (US$ 17 578 million).
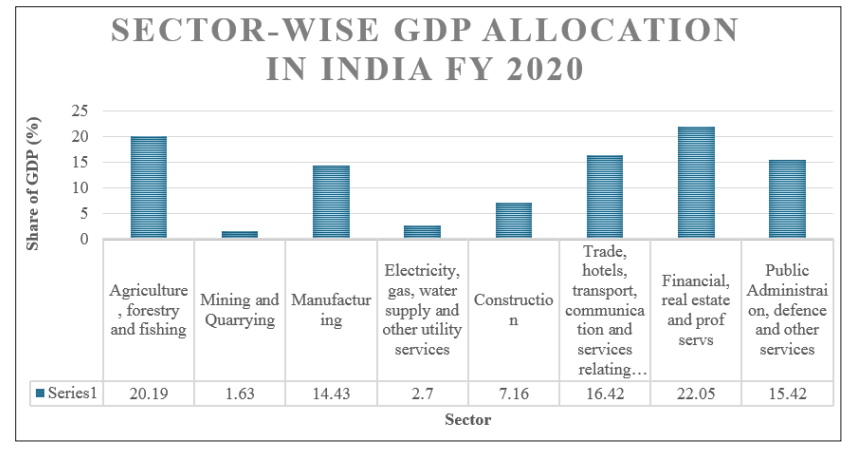
Figure 9: India’s Sector-Wise GDP allocation, 2020
Source: Statista [7].
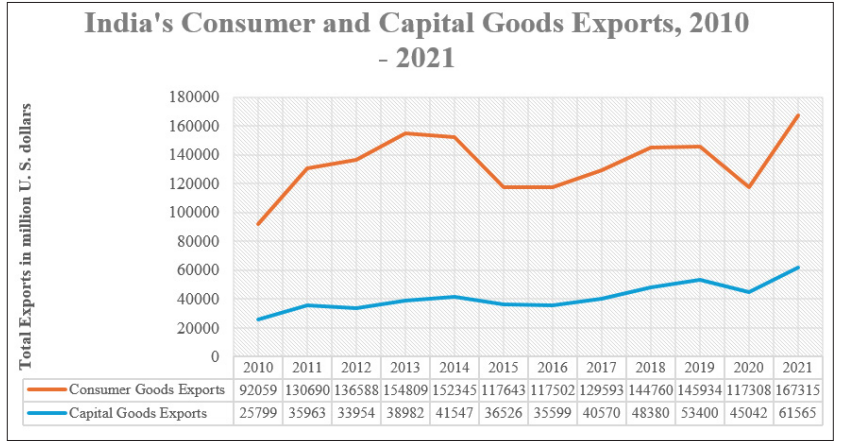
Figure 10: India’s Consumer and Capital Goods Exports, 2010.2021
Source: WITS [37].
While the discrepancy between the GDP contribution made by the services, agriculture, and manufacturing in India is not as great as Brazil and Russia, India’s services sector consistently contributed the largest to its GDP, as shown in Figure 8. Beginning at 43 percent in 2010, the service sector rose to a high of 53.89 percent in 2020 and settled at 48.58 percent in 2022.By comparison, its agriculture sector contributed the least to its GDP over the period under review, registering a 16.61 percent for 2022. Figure 9 provides a snapshot of the sector-wise GDP allocation for the year 2020. Here, we can see that it is reflective of the statistics presented in Figure 8 with the services sector (financial, real estate and professional services) leading the pack at 22.05 percent. Similarly to Russia, there is a major gap in its total consumer and capital goods exports. For the year 2013, its consumer goods exports amounted to US$154 809 million and its capital goods exports, US$ 38 982 million, representing the largest divergence of US$115 827 million for the period under review.
However, the reasons for its major divergence between its consumer and capital goods exports differ from those of Russia. India’s high consumer goods exports - which made a significant increase between 2020 and 2021 – is attributed to the surge in its Fast-Moving Consumer Goods (PMCG) exports. This increase has been in effect, “driven by factors like technological advancements, improved supply chain infrastructure, and evolving consumer preferences worldwide’’ [40].
China
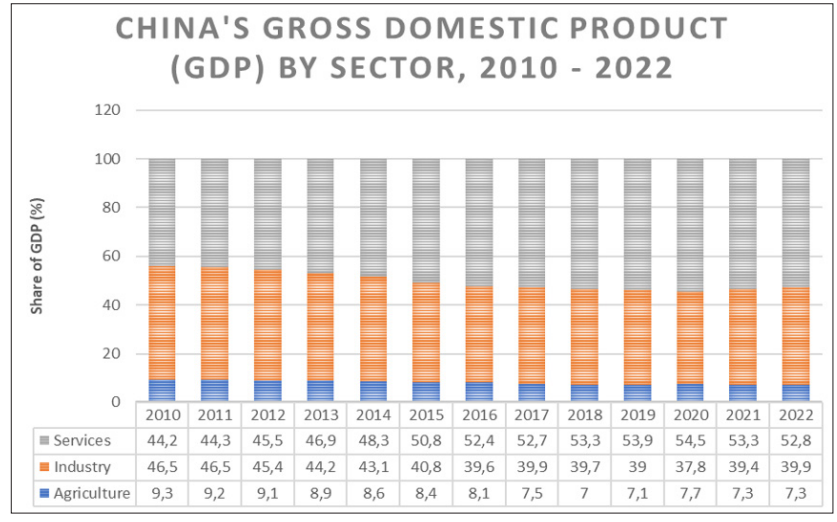
Source: Statista [7] & Investopedia [41]
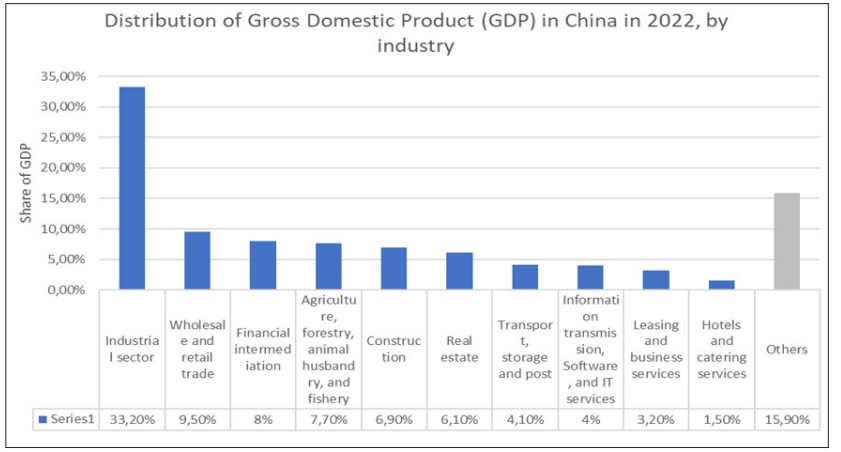
Figure 12: China’s Distribution of GDP in 2022, by Industry
Source: Statista [7]

Figure 13: China’s Consumer and Capital Goods Exports, 2010 . 2021
Source: WITS [37].
China, following the clear pattern of Brazil, Russia, and India, has the service sector as its lead sector having contributed the most to its GDP as shown in Figure 11 for the majority of the years under review (beginning from 2012 – 2022). Like India, in this regard, the discrepancies among its services, industrial, and agricultural sectors were minimal – with its services and industrial sector in particular being rather close. For example, the figures for 2012 show a 0.01 percentage point difference between the two sectors. China is often referred to as the “World’s Factory”, so it is unsurprising that Figure 12 showcases its industrial sector as being a key contributor to its GDP for the year 2022(33.2 percent share of its GDP [44]. Yet, contrary to its other BRIC partners assessed above, China’s capital goods exports have consistently exceeded its consumer goods export for the period under review. More impressive, and despite the global economic recession which accompanied the outbreak of the 2019 coronavirus disease, it experienced a massive surge both its consumer and capital goods exports between 2020 and 2021: Its capital goods exports increased by US$228 159 million and, likewise, its consumer goods exports increased by US$330 696.
Interpretation, Recommendations and Caveats for South Africa Figure 14 below illustrates capital goods as a percentage of total exports for BRIC nations between 2010 and 2021. China, overwhelmingly, has the highest percentage or product share of capital goods exports in comparison to Brazil, Russia, and India. For the most part, its figures more than double that of the country holding second place – in this instance fluctuating between Brazil and India. Russia – notably due to its oil and energy exports – has consistently held last place.
As shown below in Figure 14, in assessing the pattern of economic growth and development of all four original BRIC countries through the lens of the Flying GeeseModel one can clearly identify the lead goose as being China.
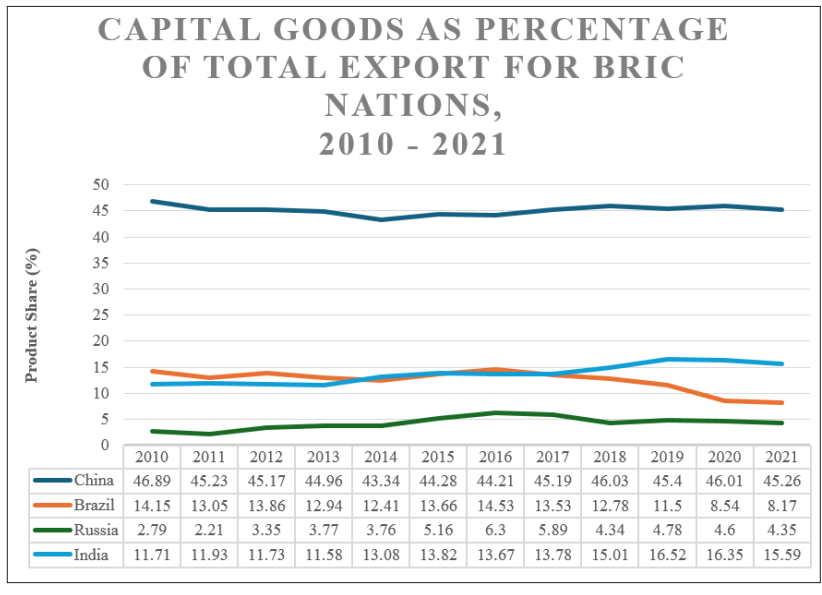
Figure 14: Capital Goods Exports as a Percentage of Total Exports for BRIC Nations, 2010 - 2021
Source: WITS [37].
As ‘lead goose’, an argument can be made for China to assume a greater role as leader in assisting in the development of its economically weaker members within the bloc – such as South Africa – in an attempt to economically strengthen the entirety of the group as it challenges Western global hegemony. Indeed, granting South Africa a greater market share within the manufacturing of consumer goods would do well to create a balanced and more fair-trade dynamic within the BRICS+ bloc. An ideal industry in which China could strike a development pact with South Africa could potentially be the textile industry.
It goes without saying that South Africa and China have a long (albeit, unhappy for the former) relationship concerning textiles. As already mentioned, South Africa’s textile industry suffered a massive blow in the early 2000s as it could not compete with Chinese imports. This resulted in the closing of many factories and the loss of 121 500 jobs in the textile and clothing manufacturing industry [45]. Although South Africa successfully convinced China to sign a textile pact in 2006 which restricted Chinese imports into the country in an effort to allow its own industry space to grow, this pact lapsed and was not renewed in 2009 [46].
In the decade since, recent developments have been made which may open up a window of opportunity for a new textile development pact to be made which may see China (and to a certain also India, a major textile exporter) not only share its market space with South Africa but also technical expertise and cooperation and best practices. This would be in line with the Flying Geese Model which suggests that “latecomers”, in a bid to ‘leapfrog’, learn from the experiences of the “lead goose” to shorten the time required to catch up. For 2022, China’s textile exports totalled US$ 303 billion and India’s textile exports amounted to US$44.4 billion [47-48]. In contrast, South Africa’s amounted to US$429 million (South African Revenue Services [SARS] [49].
For one, in line with the Flying GeeseModel, textile manufacturing has already begun to shift from China towards other economies within BRICS – such as India, and Ethiopia – as production costs are lower in those economies. For example, Ethiopia’s minimum wage is US$ 26 in comparison to China’s US$ 326. As a result, there has been a decrease in Chinese global exports from 38.3 percent in 2015 to 29.1 percent in 2020 [42-43].
Secondly, and linked to the first point is the matter of China’s aging population which has had a profound effect on its textile manufacturing sector. According to [50], ‘‘Most of the workers in factories around the country are in their 40s and 50s now, and it’s rare to see young manufacturing workers’’. As a result, it is noted that within the textile industry, factories have been saturated with orders and are unable to meet the demands. In comparison, South Africa,with a shockingly high 59.4 percent youth unemployment rate, is well-positioned to absorb and meet the labour demands of textile manufacturing [51].
However, for the Flying GeeseModel to truly be effective within BRICS, a measure of economic benevolence is required on the part of the major economic powers within the group. Here, economic benevolence would be based, firstly, on the strong values of South- South co-operation whereby countries in the Global South are committed to collectively assisting each other in advancing their position in the world.
Thus, as we have come to know, the international political economy does not function on altruism and good deeds alone and at the core, states are self-interested actors. For this reason, and secondly, economic benevolence would be based on the prospective and future economic gains for all within the group. Therefore, while the manufacturing sector continues to constitute a major source of economic wealth within the major BRICS member states – adopting a Flying GeeseModel has the potential to bring about positive-sum economic results for the group in an archaic and self-interested world.
By allocating South Africa a greater market share within the textile manufacturing sector, this strategy would prompt the major economies to move further up the value chain and shift their attention to more profitable sectors – such as the capital goods industry - while at the same time affording South Africa the opportunity to develop its manufacturing base.
It reasons, then, that building strong BRICS economies (through co-operation and co-ordination) will be economically and politically beneficial for the group in the long-, if not medium-, term. Economically speaking, it would boost the GDP of the group as a whole and increase the volume of trade among member states, thereby strengthening the group’s economic power. Politically speaking, it also represents a major geopolitically strategic move for the group in countering and challenging Western (unipolar) dominance.
The Republic of South Africa has enough human (L) and physical
(K) capital to launch a real take-off strategy to move from its current socioeconomic situation to a status capable of creating more wealth, and ultimately alleviate poverty (which is currently acting as a ‘bug trap’ for the future of the country). But two prerequisites are indispensable in doing so:Real political stability. Political stability is the necessary foundation for all development plans. In their book comparing the development paths of Africa and Asia, [52]. explained that political stability (among other factors) was vital to the Asian miracles. While this may seem as a glaringly obvious prerequisite, not much attention is given to it in South Africa. Without political stability, there will no continuity in developmental policy design and implementation as too frequent changes in political power means that much work which goes into medium and long-term macroeconomic policies are lost.
The formulation and implementation of sound development policies and taking advantage of the country’s full membership in BRICS are another prerequisite. In fact, based off the Flying Geese Model, South Africa should establish partnership with China (the “Leader Goose”) to develop its industrial framework, clearly starting with the textile.In fact, the current stage of the industrial development of China has progressively liberated some industries that some Asian countries enjoy in an effort at enhancing their economic capacities, specifically in textile (as mentioned above such as Bangladesh, Vietnam, etc). This sector, which is not technologically intensive, presents huge opportunities in terms of jobs and economic growth based on the internal demand and exports.
In sum, this article has provided a modest account of how the Flying Geese Model may be adopted within BRICS to allow South Africa to reap the full economic benefits from its membership. Nevertheless, such developmental policies and the partnership with a Leader Goose will require a sustainable response to the current energy crisis that constitutes the main constraint to all industrial policy in the country. Without which, any developmental strategy deployed by the group and the country would be powerless.