Author(s): Adeyeye EI*, Idowu OT, Akinsola AF, Olatunya AM, Popoola OK, Ayodele O and Gbolagade AY
Amino acid levels in the exoskeleton of the heterosexual samples of Neopetrolisthes maculatus were evaluated. Twenty parameters were reported on; 13 of these values were greater in the female than the male (i.e. 13/20 or 65.0%). Values in female > male were observed in Val, Thr, Lys, Met, Phe, Trp, Gly, Ala, Asp, Arg, Cys, total amino acids and protein. The variations between the male and female amino acid values were low having coefficient of variation percent range of 0.0579-16.9. The amino acid levels were significantly different between the heterosexuals at r=0.01. Limiting amino acids on the various scoring standards were egg (Cys=0.3172 and 0.3511), provisional essential amino acid scoring pattern (Lys = 0.4145 and 0.4746), preschool child requirements (Lys =0.3930 and 0.4501) and all the three scores were significantly different at r=0.01. The EAAI1 (compared to soybean) were 1.18 (male) and 1.16 (female), EAAI2 (compared to egg) were 88.5 (male) and 88.3 (female); their corresponding BV were 84.7 and 84.5. P-PER1 range was 1.86 (male) - 1.24 (female) and P-PER2 range was 2.02 (male) - 1.41 (female). Total EAA was 37.7g/100g protein (male) and 37.0g/100g protein (female). In the estimates of amino acid requirements of school boys at ages 10-12years (mg/kg/day), male exoskeleton would provide more than the requirement in Phe + Tyr (186%), Trp (25.8%) and Val (48.1%) whereas in female the following were higher than the standards: Phe + Tyr (218%), Thr (8.86%), Trp (35.0%), Val (61.6%) and TEAAs (4.01%).
Introduction
One of the greatest problems facing the developing countries is that
of providing food of adequate quality to its increasing populations.
This is because the malnutrition situation is more intense with low
level of protein and mineral intake, calling for urge and urgent
need to find a way of raising the protein and mineral intake of the
average citizens from 5.5g/head/day as recommended by FAO to
35g/head/day as suggested by Indufueke, more than 41% of the
total animal protein is obtained from fishery products in Nigeria,
this is because fishery products are relatively cheaper than meat
and the total fish consumption rate has risen to 2.66 million metric
tonnes annually [2-5].
Crabs are part of the basic components of the ecosystem and they are consumed as food in many countries Over 100 species of crabs are known worldwide with nine species common to West African countries especially Nigeria. Crabs are known to be mostly occurring at the mouth of estuaries and along the course of many main rivers. Crabs constitute one of the most important members of estuarine food chain.
Porcellanide family is a group of crab-shaped anomuran crustaceans that belong to the superfamily Galatheoidea together with three other families Galatheoidae, Munididae and Munidopsidae. They are commonly found in rocky and coral reefs of temperate and tropical coasts [6-9].
The World Register of Marine Species (WoRMS) has given the taxonomic details of Neopetrolisthes maculatus [10]. Classsification: Biota > Animalia (Kingdom) > Arthropoda (Phylum) > Crustacea (Subphylum) > Multicrustacea (Superclass) > Malacostraca (Class) > Eumalacostraca (Subclass) > Eucarida (Superorder) > Decapoda (Order) > Pleocyemata (Suborder) > Anomura (Infraorder) > Galatheoidea (Superfamily) > Porcellanidae (Family) > Neopetrolisthes (Genus) > Neopetrolisthes maculatus (Specie).
Patent: Neopetrolisthes Miyake, 1937
Original name: Porcellana maculata H. Milne Edwards, 1837
Synonymized names Neopetrolisthes oshimai Miyake, 1937
(Synonym) Petrolisthes ohsimai (Miyake, 1937) (junior synonym)
Porcellana maculata H. Milne Edwards, 1837
In distribution, porcellanide are widely distributed in the Indo- West Pacific. They are found from east coast of Africa to Christmas Island and Western Australia, Bismarck Archipelago, Queensland, Moluccas, Palau, Taiwan, Southern Japan (Ryukyu Islands), New Caledonia, Marshall and Fiji Islands. They live in shallow subtidal water; coral and rocky reefs, being associated with large sea anemones (Cryptodendrum, Entacmaea, Gyrostoma, Heteractis and Stichodactyla), typically found in a heterosexual pair [11-13].
Neopetrolisthes maculatus is a spotted crab. There are two different colour forms, although the ground colour of bodies of both forms is white. In one form, carapace and chelipeds are white, with an uneven pattern of irregular sizes of red blotches; ambulatory legs also white, with some small red spots on meri of first pair (second pereopod). In other form, the carapace and chelipeds have a uniform pattern of numerous small, reddish purple spots; meri of ambulatory legs also with numerous small, reddish purple spots [14].
Crab is consumed by many individuals as it is often recommended for pregnant women. Utilization of both fresh water and marine resources for human consumption has increased tremendously worldwide. Aquatic food products, including crustacean shellfish, have been landed for their health promoting characteristics. Shellfish are known to be nutritionally valuable source of various mineral and high quality proteins [15, 16, 17].
The nutritional status and chemical composition of different species of crabs had been reported extensively in various parts of the world [6, 15,18-28]. This work is part of the ongoing report on the nutritional qualities ofN. maculatus; this being on the amino acid composition of the exoskeleton of the heterosexual pairs of N. maculatus. It is hoped that this will further contribute to the information on Food Composition Tables. The colour pattern of the samples is of large and uneven blotches that resemble the Pacific Ocean Neopetrolisthes maculatus population [29].
Materials and Method
Collection of Samples
Samples were collected from trawler catches from the Atlantic
Ocean at Orimedu beach in Ibeju-Lekki area of Lagos State,
Nigeria. The experiment took place between July and August,
2017. The wet crabs were separated fresh and were washed with
distilled water to remove adhering contaminant and transported
in ice crushed containers to the laboratory for authentication and
preservation prior to the analyses. The crabs were authenticated in
the Department of Forestry, Wildlife and Fisheries Management
of Ekiti State University, Ado-Ekiti, wrapped in aluminium foil
and stored in a cool chamber at about 37°F (2.8°C) for about three
days prior to analyses.
Sample Treatment
Number of matured N. maculatus crabs caught was 16 but 13
samples were used for this study. The 13 whole crabs separated;
there were six males and seven females. Typically a crab is killed
by boiling it alive; however in an attempt to give the crab a quick
death, it was preserved under cold temperature. Whilst the internal
organs were discarded, the other separated parts were dried in
the oven at 1050C. For the purposes of analyses; the separated
parts were the carapace and cheliped exoskeleton (to constitute
the exoskeleton) and the muscle from the thoracic sterna and
cheliped (to constitute the endoskeleton). The exoskeleton (used
in this work) from each sex was separately blended
Extraction and Analyses
Extraction and the instrumentation analysis were carried out by
following AOAC method and Danka et al. [30,31].
The dried pulverized sample was made to be free of water by ensuring constant weight for a period of time in the laboratory. The sample of 10.0g was weighed into the 250ml conical flask capacity. The sample was defatted by extracting the fat content of the sample with 30ml of petroleum spirit three times with Soxhlet extractor that was equipped with thimble. The sample was hydrolyzed three times for complete hydrolysis to be achieved for the totality of amino acids recovery.
The pulverized and defatted sample was soaked with 30ml of 1M potassium hydroxide solution and was incubated for 48 hours at 110°C in hermetically closed borosilicate glass container. After the alkaline hydrolysis, the hydrolysate was neutralized to get pH in the range of 2.5-5.0. The solution was purified by cation-exchange solid-phase extraction. The amino acids in purified solutions were derivatised with ethylchloroformate by the established mechanism:
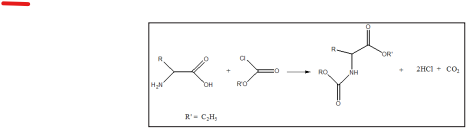
The derivatising reagent was removed by scavenging with nitrogen. The derivatized amino acid was made up to 1ml in a vial for gas chromatography analysis. The gas chromatographic conditions for the amino acids analysis were as follows: GC: HP6890 powered with HP ChemStation rev. A09.01 [1206] software; injection temperature: split injection; split ratio: 20:1; carrier gas: hydrogen; flow rate: 1.0ml/min; inlet temperature: 250°C; column type: EZ; column dimensions: 10m x 0.2mm x 0.25?m; oven programme: initial @ 110°C, first ramp @ 27°C/min to 320°C ; second constant for 5mins at 3200C; detector: PFPD; detector temperature: 320°C; hydrogen pressure: 20psi; compressed air: 35 psi.
Determination of Amino Acid Quality Parameters
(i) Estimation of isoelectric point ( pI): The estimation of
isoelectric point ( pI) for a mixture of amino acids was carried
out using the following equation [32].
(ii) Estimation of predicted protein efficiency ratio (P-PER): Computation of protein efficiency ratio (C-PER or P-PER) was carried out using the equations [33].
P-PER1 = -0.468 + 0.454 (Leu)-0.105 (Tyr) ------------ (2) P-PER2 = -0.684 + 0.456 (Leu)-0.047 (Pro) ------------ (3)
(iii) Leucine/isoleucine ratio: The leucine/isoleucine ratios, their differences and their percentage differences were calculated.
(iv) Determination of essential amino acid index (EAAI2): The method of EAAI1 calculation was due to Oser using the egg protein amino acids as the standard [34].
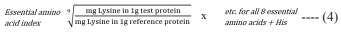
(v) Estimation of essential amino acid index (EAAI 1): The essential amino acid index was calculated by using the ratio of test protein to the reference protein for each eight essential amino acids plus histidine in the equation 4 [35]

(vi) Calculation of biological value (BV): Computation of biological value (BV) was calculated following the equation of Oser [34].
Biological value = 1.09 (EAAI1) - 11.73 ------------------ (5)(vii) Computation of Lys/Trp and Met/Trp: The ratios of Lys/ Trp (L/T) and Met/Trp (M/T) were computed.
(viii) Computation of amino acid scores: The amino acid scores were computed using three different procedures:
- Scores based on amino acid values compared with whole Hen’s
egg amino acid profile [36].
- Scores based on essential amino acid scoring pattern [37].
- Scores based on essential amino acid suggested pattern of
requirements for pre-school children [38].
(ix) Estimates of amino acid requirements at different ages
(mg/kg/day): These estimates were based on the essential amino
requirements in mg/kg/day of 30kg body weight of 10-12 years
school boys The proposed formula for this calculation could be
any of these two [37].
- Essential amino acid x 1000/100 x protein(g/100g) ----- (6) -Essential amino acid x 10 x appropriate corresponding protein ----- (7)
(x) Other calculations: Other determinations such as total amino acid (TAA), total essential amino acid (TEAA), total non-essential amino acid (TNEAA), total acidic amino acid (TAAA), total basic amino acid (TBAA), total essential aliphatic amino acid (TEAlAA), e.t.c. and their percentages were made. Total sulphur amino acid (TSAA), percentage of cystine in TSAA (% Cys in TSAA) were also calculated. The various amino acid groups into classes I-VII were also calculated [39].
Statistical Evaluation
Data results in this work were subjected to both descriptive and
inferential statistics. Results subjected to both types of statistics
were the raw data of the amino acid profiles and the various
amino acid scores.
Results and Discussion
The concentration of amino acids of Neopetrolisthes maculatus
heterosexual (dry weight) exoskeleton in g/100g protein is
depicted in Table 1. Among the amino acids (AA) investigated,
glutamic acid (Glu) was the most concentrated with range values
of 11.6-11.5g/100g protein (male/female) with percentage
difference of +1.03 and closely followed by aspartic acid (Asp)
with respective values of 10.3-11.5g/100g protein and percentage
difference of -11.0%. Both AA are acidic amino acids (AAA).
Whereas the Glu in these samples were lower than those in the
heterosexual flesh of N. maculatus (17.7-17.8g/100g protein),
the values of Asp in the flesh were lower than the present values,
the values being 10.0-9.90g/100g protein [25]. The observation
made in the present report for Glu and Asp also corroborated with
the observation in flesh of female West African fresh water crab
(Sudananautes africanus africanus) with Glu (130.2 mg/g protein)
> Asp (72.5mg/g protein) [40]. The most (third) concentrated
essential amino acid (EAA) was valine (Val) having values of
7.72-7.84g/100g protein (male/female) with percentage difference
of -1.62%. Other high concentrated EAA (g/100g protein) were:
Thr (5.41-5.60, % difference of -3.59), Leu (6.59-5.23, %
difference of + 20.7), His (4.43-4.01, % difference of +9.68) and
Phe (5.84-6.32, % difference of -8.28), whereas non-essential
amino acids (NEAA) of high concentrations were: Gly (5.81-
5.82, % difference of -0.1810; lowest difference value), Ala (3.62
- 3.94, % difference of -9.09), Ser (3.79-3.09, % difference of
+18.4), Pro (6.50-6.09, % difference of +6.29), Arg (4.10 - 5.22,
% difference of -27.2) and Tyr (6.36-6.29, % difference of +1.11).
The least concentrated AA in the two samples was Cys (5.71e-1
to 6.32e-1, % difference of -10.7). Both the total AA (90.4-91.0,
% difference of -0.7216) and protein (19.0-20.4, % difference of
-7.37) were close in both samples respectively. The Leu values in
these samples had close concentrated values when compared with
Leu in S. africanus africanus (66.0mg/g protein) [40].
The general concentration differences in the AA profiles of the two samples can also be seen in Table 1 in columns 5 and 6 (for differences and percentage differences respectively). Twenty parameters were evaluated for in Table 1. Out of these 20 parameters, 13 parameters or 13/20 (65.0%) were positive towards the female exoskeleton or to say that 65.0% of the parameters were more concentrated in the female than the male. It also showed that seven parameters or 7/20 (35.0%) were more positive towards the male exoskeleton. On the other hand, it was 60% (positive for female) and 40% positive for male in N. maculatus heterosexual flesh in the N. maculatus heterosexual innards, it was 10/19 (52.6%) positive towards the female AA concentration and 47.4% (9/19) positive towards the male [25,26].
| Amino acid | CID | Male exoskeleton | Female exoskeleton | Difference | % difference |
|---|---|---|---|---|---|
| Val | 6287 | 7.72 | 7.84 | -0.1247 | -1.62 |
| Thr | 6288 | 5.41 | 5.60 | -0.1943 | -3.59 |
| Ile | 791 | 2.62 | 2.49 | +0.1233 | +4.71 |
| Leu | 6106 | 6.59 | 5.23 | +1.36 | +20.7 |
| Lys | 5962 | 2.28 | 2.61 | -0.3309 | -14.5 |
| His | 6274 | 4.43 | 4.01 | +0.4294 | +9.68 |
| Met | 6137 | 2.03 | 2.11 | -0.0783 | -3.86 |
| Phe | 6925665 | 5.84 | 6.32 | -0.4835 | -8.28 |
| Trp | 6305 | 7.93e-1 | 7.95e-1 | -0.0020 | -0.2520 |
| Gly | 750 | 5.81 | 5.82 | -0.0105 | -0.1810 |
| Ala | 5950 | 3.62 | 3.94 | -0.3287 | -9.09 |
| Ser | 5951 | 3.79 | 3.09 | +0.6957 | +18.4 |
| Pro | 145742 | 6.50 | 6.09 | +0.4084 | +6.29 |
| Asp | 5960 | 10.3 | 11.5 | -1.13 | -11.0 |
| Glu | 33032 | 11.6 | 11.5 | +0.1191 | +1.03 |
| Arg | 6322 | 4.10 | 5.22 | -1.11 | -27.2 |
| Tyr | 6057 | 6.36 | 6.29 | +0.0704 | +1.11 |
| Cys | 67678 | 5.71e-1 | 6.32e-1 | -0.0612 | -10.7 |
| Total | 90.4 | 91.0 | -0.6521 | -0.7216 | |
| Protein | 19.0 | 20.4 | -1.40 | -7.37 |
In Table 2, we have the descriptive statistics of the data from Table 1. The standard deviation (SD) and the coefficient of variation (CV%) were both low. The CV% ranged between 0.0579-16.9. This showed that the parameter values were close and generally homogenous. In the flesh heterosexual N. maculatus the parameter values were less homogenous than the exoskeleton as the flesh CV% values ranged from 0.124-32.0 and observation in the innards as in the flesh: CV% of 0.295-30.1. The inferential statistics of data in Table 1 can be found in Table 3. The mean, SD and CV% were generally close in values between male and female samples. Also, the correlation coefficient (rxy) was significantly high at 0.9820; this was followed by high level (0.9648) of coefficient of determination (rxy 2). The regression coefficient (Rxy) showed that for every 1.00g/100g protein rise in the overall value of male exoskeleton AA, there was a corresponding increase of 1.01g/100g protein in the female concentration of AA; this further attested to the observation showing female AA > male AA. The coefficient of alienation or no relationship (CA) was low at 0.1877 (18.77%) whilst the index of forecasting efficiency (IFE) was high at 0.8123 (81.23%). Whereas the CA is an opposite of IFE but CA + IFE = 1.00 or 100%. Whilst the IFE is a reduction in the error of prediction of the relationship between two entities, the CA represents the value of the error of prediction between two relationships. When CA is high, the IFE is low and prediction of relationship is difficult, but if IFE is high or > CA then prediction of relationship is easy. In the samples under discussion their IFE value was high (0.8123 or 81.23%) and the error was just 18.77% (the CA value). Since IFE0.8123 >> CA0.1877, this means that male exoskeleton sample can conveniently carry out the biochemical functions of female exoskeleton and vice versa.
| Amino acid | CID | Mean | Standard deviation | Coefficient of variation (%) |
|---|---|---|---|---|
| Val | 6287 | 7.78 | 0.0882 | 1.13 |
| Thr | 6288 | 5.50 | 0.1374 | 2.50 |
| Ile | 791 | 2.55 | 0.0872 | 3.41 |
| Leu | 6106 | 5.91 | 0.9648 | 16.3 |
| Lys | 5962 | 2.45 | 0.2334 | 9.57 |
| His | 6274 | 4.22 | 0.3036 | 7.20 |
| Met | 6137 | 2.07 | 0.0554 | 2.68 |
| Phe | 6925665 | 6.08 | 0.3419 | 5.62 |
| Trp | 6305 | 0.7936 | 0.0014 | 0.1779 |
| Gly | 750 | 5.83 | 0.0034 | 0.0579 |
| Ala | 5950 | 3.78 | 0.2324 | 6.15 |
| Ser | 5951 | 53.44 | 5 0.4919 | 5 14.3 |
| Pro | 145742 | 5 6.29 | 50.2888 | 5 4.59 |
| Asp | 5960 | 510.9 | 50.8021 | 57.35 |
| Glu | 33032 | 11.5 | 0.0842 | 0.7303 |
| Arg | 6322 | 4.66 | 0.7881 | 16.9 |
| Tyr | 6057 | 6.32 | 0.0498 | 0.7876 |
| Cys | 67678 | 0.6015 | 0.0432 | 7.19 |
| Total | 90.7 | 0.4611 | 0.5084 | |
| Protein | 19.7 | 0.9899 | 5.03 |
| Statistics | Male exoskeleton | Female exoskeleton | |
|---|---|---|---|
| Total amino acid value | 90.4 | 91.0 | |
| Mean | 5.02 | 5.06 | |
| Standard deviation | 2.98 | 3.07 | |
| Coefficient of variation (%) | 59.4 | 60.7 | |
| Correlation coefficient (rxy) | 0.9820 | ||
| Variance (rxy 2) | 0.9648 | ||
| Regression coefficient (Rxy) | 1.01 | ||
| Coefficient of alienation (CA) | 0.1877 | ||
| Index of forecasting efficiency (IFE) | 0.8123 | ||
| Remark | * |
* = results significantly different at n-2 and r= 0.01 (critical value = 0.590). [NOTE: n-2 = 18-2 = 16 (df)]
The various AA have different types of functions in the human body. Phenylalanine, a precursor for neurotransmitters which helps in the production of other amino acids and their functioning. Valine helps in stimulating muscle growth, regeneration and it produces energy. Threonine is a principal component of structural proteins such as collagen and elastin which are present in skin and connective tissues, helps in fat metabolism and immune function. Tryptophan is a precursor to serotonin, a neurotransmitter that helps in appetite, sleep and mood regulation. Methionine plays a major role in metabolism, detoxification, helps in tissue growth and in the absorption of minerals such as zinc and selenium needed by the body. Leucine helps in regulating blood sugar levels, enhances wound healing and stimulates growth hormones. Isoleucine helps in muscle metabolism, immune function, haemoglobin production and energy regulation. Branched-chain AA are Val, Leu and Ile. Lysine helps in protein synthesis, calcium absorption, immune function, energy production, hormone production and in collagen production. Histidine, a neurotransmitter helps in maintaining the protective barrier called myelin sheath that surrounds the nerve cells, helps in digestion, immune response, sleep-wake cycles and sexual functions [41].
In Table 4 were reported the summary of parameters of essential, non-essential, acidic, neutral, sulphur, aromatic, etc. AA contents (g/100g protein) of the samples. The total AA (TAA) of 90.4-91.0g/100g protein (male/female exoskeleton) were lower than flesh AA at 96.6-97.1g/100g protein, lower than the innards of heterosexual N. maculatus at 95.4 (male)-96.5 (female) but higher than the value of 777.0mg/g protein in the S. africanus africanus female flesh. Columns in Table 4 included AA, members of AA, Class of AA in male and female exoskeleton and other quality parameters. Total non-essential amino acid (TNEAA) was 52.7-54.0 with corresponding percentage values of 58.3-59.4. Total essential amino (TEAA) was 37.7-37.0g/100g protein (with His) and percentage value of 41.7 - 40.6 whereas values of TEAA without His were 33.3 - 33.0 and the corresponding percentage values were 36.8 - 36.2 [25,26,40]
| Amino acid | Members | Class | Male exoskeleton | Female exoskeleton |
|---|---|---|---|---|
| Total amino acid (TAA) | Gly, Ala, Ser, Pro, Val, Thr, Ile, Leu, Asp, Met, Glu, Lys, Phe, His, Arg, Tyr, Trp, Cys | 90.4 | 91.0 | |
| Total non-essential amino acid (TNEAA) | Gly, Ala, Ser, Pro, Asp, Glu, Arg, Tyr, Cys | 52.7 | 54.0 | |
| % TNEAA | 58.3 | 59.4 | ||
| Total essential amino acid (TEAA) | Val, Thr, Ile, Leu, Lys, His, Met, Phe, Trp | |||
| -with His | 37.7 | 37.0 | ||
| -without His | 33.3 | 33.0 | ||
| % TEAA | ||||
| -with His | 41.7 | 40.6 | ||
| -without His | 36.8 | 36.2 | ||
| Total aliphatic amino acid (TAIAA) | Gly, Ala, Val, Leu, Ile | I [with aliphatic side chains (hydrogen and carbon)] | 26.4 | 25.3 |
| % TAIAA | 29.2 | 27.8 | ||
| Total essential aliphatic amino acid | Val, Leu, Ile | 16.9 | 15.6 | |
| % TEAIAA | 18.7 | 17.1 | ||
| Total aromatic amino acid (TArAA) | His, Phe, Tyr, Trp | VI [containing aromatic rings] | 17.4 | 17.4 |
| % TArAA | 19.3 | 19.1 | ||
| Total essential aromatic amino acid (TEArAA) | His, Phe, Trp | 11.1 | 11.1 | |
| % TEArAA | 12.2 | 12.2 | ||
| Total acidic amino acid (TAAA) | Glu, Asp | IV [with side chains containing acidic groups or their amides] | 21.9 | 22.9 |
| % TAAA | 24.3 | 25.2 | ||
| Total basic amino acid (TBAA) | Arg, Lys, His | V [with side chains containing basic groups] | 10.8 | 11.8 |
| % TBAA | 12.0 | 13.0 | ||
| Total neutral amino acid (TNAA) | Gly, Ala, Val, Leu, Tyr, Ser, Phe, Cys, Thr, Met, Pro | 51.0 | 55.5 | |
| %TNAA | 56.4 | 60.9 | ||
| Total hydroxylic amino acid (THAA) | Ser, Thr | II [with side chains containing hydroxylic (OH) groups] | 9.19 | 8.69 |
| % THAA | 10.2 | 9.55 | ||
| Cyclic amino acid (CAA) | Pro | VII [amino acid] | 6.50 | 6.09 |
| % CAA | 7.19 | 6.6 | ||
| Cystine + methionine (TSAA) | Cys, Met | III [with side chains containing sulphur atoms] | 2.60 | 2.74 |
| % TSAA | 2.88 | 3.01 | ||
| % Cys in TSAA | 22.0 | 23.1 | ||
| Leu/Ile ratio | 2.52 | 2.10 | ||
| Leu-Ile (difference) | 3.98 | 2.73 | ||
| %/Leu-Ile/Leu | 4.40 | 3.00 | ||
| %/Leu-Ile/TAA | 60.3 | 52.3 | ||
| P-PER1 | 1.86 | 1.24 | ||
| P-PER2 | 2.02 | 1.41 | ||
| Isoelectric point (pI) | 5.11 | 5.17 | ||
| Essential amino acid index (EAAI1) | 1.18 | 1.16 | ||
| Essential amino acid index (EAAI2) | 88.5 | 88.3 | ||
| Biological value (BV) | 84.7 | 84.5 | ||
| Crude protein | 19.0 | 20.4 | ||
| Lys/Trp | 2.88 | 3.29 | ||
| Met/Trp | 2.56 | 2.65 | ||
| Phe/Tyr | 0.9178 | 1.00 |
P-PER = predicted protein efficiency ratio
The predicted protein efficiency ratio (P-PER1) was 1.86-1.24 and (P-PER2) was 2.02-1.41. The in vivo P-PER is of the order of 2.2 [43]. Both P-PERs were lower than the report for the N. maculatus flesh where values of P-PER1 were 3.39-3.69 and P-PER2 were 3.82-4.14 and also lower than the report for the innards of N. maculatus heterosexuals with values of P-PER1 (2.83-3.01) and P-PER2 (2.89-2.96) [25,26]. Each of our present P-PER value was lower than 2.2. According to Friedman’s classification, the PER is poor (< 1.5), moderate (1.5-2) and superior (>2) [44]. On this classification, P-PER1 and P-PER2 were within the group of moderate in male sample but poor in the female sample. Further literature information had the following P-PER values: in the flesh of female S. africanus africanus , P-PER was 3.1 [40]. In Callinectes latimanus (a lagoon crab), P-PER1 was 1.21 and P-PER2 was 1.39 [45]. The present results showed male N. maculatus might be more physiologically utilized protein source than the female sample. In general, it has been found that the better the protein, the lower the level in the diet required producing the highest protein efficiency ratio. This emphasizes a clear reflection of the importance of the proper nutritive balance of all the amino acids to produce optimum metabolic efficiency. In the data in Table 4, Leu/Ile ratio range was 2.52 - 2.10, Leu-Ile (difference) was 3.98-2.73, %/Leu - Ile/Leu ranged from 60.3 - 52.3. In the flesh of N. maculatus Leu/Ile ratio had values of 1.60 - 1.63 in the flesh of S. africanus africanus, the ratio was 1.60 and the innards of N. maculatus heterosexual the ratios were 1.54 - 1.91 with the difference levels of 2.87-3.97g/100g protein and % (Leu - Ile)/ Leu values of 35.1 - 47.7 [25, 26, 40]. From literature, the most ideal Leu/Ile is 2.36 [46]. The values of 2.52 - 2.10 were close to 2.36, hence, we might not experience concentration antagonism in the samples when consumed as protein source in food. It has been suggested that an amino acid imbalance from excess Leu might be a factor in the development of pellagra [47]. A high Leu imbalance in the diet impairs the metabolism of Trp and niacin, and is responsible for the niacin deficiency in sorghum eaters [48]. Experiments in dogs have shown that animals fed sorghum proteins with less than 11g/100g protein Leu did not suffer from nicotinic acid deficiency [49]. The present Leu values of 6.59-5.23g/100g protein were less than 11g/100g protein and therefore considered safe and could be beneficially exploited to prevent pellagra in endemic areas [50].
The total sulphur amino acid (TSAA) in the samples were made of Met + Cys. Whilst the total TSAA was 2.60-2.74g/100g protein, the percentage Cys/TSAA values were 22.0-23.1 lower to both innards (26.7-33.0) and meat of N. maculatus at 31.9-33.1. The present Cys/TSAA values were very low compared with other literature values of animal protein amino acids: 27.3-32.8% in S. africanus africanus; 36.3% in Macrotermes bellicosus; 25.6% inZonocerus variegatus 35.5% in Archachatina marginata marginata; 38.8% in A. archatina and 21.0% in Limicolaria sp. (the last three are land snails consumed in Nigeria) [40,51,52,53]. The percentage of Cys in TSAA in the diet of rat, chick and pig is 50% but the standard value is unknown in man [46,38]. It should be noted that all the above literature results came from animal sources. It is however interesting to note that vegetable protein (e.g. coconut endosperm) has a percentage Cys/TSAA of 62.8% High percentage of Cys/ TSAA had also been reported in Anacardium occidentale with a value of 50.51%. From all these literature values, it is obvious that the N. maculatus heterosexuals exoskeleton behaved like typical animal in their %Cys/TSAA ratios. The presence of cystine and cysteine in the diet would reduce the needs for Met and since all the sulphur in the diet is derived from these three amino acids the sulphur content is sometimes used as an approximate assessment of the adequacy of protein. In the present results the values range for Met and Cys were 2.03 - 2.11g/100g protein and 5.71e-1 to 6.32e-1g/100g protein respectively [54,55,56].
The essential amino acid index (EAAI) calculated were reported in two different forms of EAAI1 and EAAI2. In the EAAI1, the values were 1.18-1.16. The EAAI under this mode has soybean as its standard for comparison. The value of EAAI in defatted soybean flour is 1.26 but lower than 1.55 in whole hen’s egg. In the amino acid composition of two fancy meats (liver and heart) of African giant pouch rat (Cricetomys gambianus), the EAAI ranged from 1.20-1.31 [57, 58]. It should be noted that the absence of Trp in EAAI calculation of this mode may bear no significance in the EAAI; for example EAAI without Trp in soy flour remained 1.26 whilst it reduced to 1.54 in the whole hen’s egg, i.e., a reduction of 0.01 or 0.645%. For the EAAI2, values were 88.5-88.3 with their corresponding biological values (BV) of 84.7-84.5 depicting the quality of the protein ofN. maculatus heterosexuals exoskeleton. In comparison, some literature values of EAAI and BV are as follows [34]. milk, cow (whole, nonfat, evaporated or dry), EAAI (88) and BV (84, predicted; 90, observed); human, EAAI (87) and BV (83); eggs, chicken (whole, raw or dried), EAAI (100), BV (97, predicted; 96, observed); whites (raw or dried), EAAI (95), BV (92, predicted; 93, observed); yolks (raw or dried), EAAI (93), BV (89, predicted); shellfish (shrimp, including prawns, raw or canned), EAAI (67), BV (61, predicted); also 86.9-89.9 (EAAI) and 83.0-86.3 (BV) in flesh of N. maculatus and 88.7-89.2 (EAAI) and 85.0-85.5 (BV) in innards of N. maculatus [25,26]. These literature results show the quality position ofN. maculatus exoskeleton under discussion. EAAI is useful as a rapid tool in the evaluation of food formulation for protein quality. The isoelectric point, pI, was 5.11-5.17 showing the samples to be in the acidic medium of the pH range. The pI calculation from amino acids would assist in the quick production of certain protein isolate of organic product without evaluating the protein solubility to arrive at the pI.
In Table 4 are results for Lys/Trp (L/T) and Met/Trp (M/T) in the two heterosexual exoskeleton N. maculatus samples. In infant’s protein requirements, a growth pattern of amino acid requirements was obtained by assigning value of unity to the Trp need [59]. Similar calculation of the amino acid content of mammalian tissue showed that there exists good agreement of growth needs and tissue amino acid patterns. This agreement is good for the L/T and M/T ratios of muscle proteins which constitute approximately 75% of the infant body proteins. The present results had L/T values of 2.88-3.29 and M/T of 2.56-2.65. The L/T values were less than those of innards as 3.00-5.01 and flesh as 3.31-4.27 but higher than their M/T values as: innards, 1.78-3.50 and flesh, 1.97-2.64.
Mammalian tissue patterns have the following values: L/T: muscle (6.3), viscera (5.3), plasma proteins (6.2). M/T: muscle (2.5), viscera (2.0), plasma proteins (1.1) [60]. The available evidence indicates that the utilization of dietary proteins increases as their Lys and Trp content approaches that of muscle tissues. In the present study, the male L/T value of 2.88 was less a half of virtually the standard L/T values of 6.3 (muscle), 5.3 (viscera) and 6.2 (plasma) proteins; however, L/T for the female (3.29) was above 50% of the various standard values. On the other hand, the M/T values of the present samples were all higher than the standard values of M/T of 2.5 (muscle), 2.0 (viscera), 1.1 (plasma) proteins which were all lower than the M/T values of 2.56-2.65 in the present results. The patterns of observations in the present results followed the trend as observed in the meat and innards of heterosexual N. maculatus for the L/T and M/T values. The mean minimum Phe requirement estimate in the presence of an excess of Tyr is 9.1 mg/kg/day. Hence Tyr can spare 78% of the dietary Phe need. Also the optimal proportions of dietary Phe and Tyr have been shown to be 60:40, respectively [61]. The Phe/Tyr in these results were low as seen in Table 4 and did not meet the optimal proportion of dietary Phe and Tyr of 60:40 respectively.
The amino acid groupings into classes I-VII are also depicted in Table 4 [39]. The concentration trend of the classes could be seen shown in g/100g protein: class I (26.4-25.3) > class IV (21.9-22.9) > class VI (17.4-17.4) > class V (10.8-11.8) > class II (9.19-8.69) > class VII (6.50-6.09) > class III (2.60-2.74). This trend was different in the flesh and innards of N. maculatus particularly classes V, VI, III and VII. A close observation would show that the percentages were close to their individual values with marginal differences; examples run thus: value (percentage): class I, 26.4-25.3 (29.2-27.8); class II, 9.19-8.69 (10.2-9.55); class III, 2.60-2.74 (2.88-3.01); class IV, 21.9-22.9 (24.3-25.2); class V, 10.8-11.8 (12.0-13.0); class VI, 17.4-17.4 (19.3-19.1) and class VII, 6.50-6.09 (7.19-6.69).
In Table 5, we presented the amino acid profile scores based on whole hen’s egg amino acid profile. The following male amino acid scores showed that the male sample was more concentrated in these amino acids as depicted by their scores: Val (1.03), Thr (1.06), Phe (1.14), His (1.85), Gly (1.94), Pro (1.71) and Tyr (1.59) whereas such AA were Val (1.05), Thr (1.10), Phe (1.24), His (1.67), Gly (1.94), Pro (1.60), Asp (1.07) and Tyr (1.57) in the female N. maculatus exoskeleton. The scores also showed that 7/19 (36.8%) were more concentrated in the male sample than the egg concentration values, 1/19 (5.26%) had equivalent value of 1.94 (Gly) in both sexes whereas in females, eight (8/19=42.1%) AA scores had values greater than 1.0. The limiting AA (LAA) in both samples was Cys with values of 0.3172 (male) and 0.3511 (female) whereas in flesh and innards Ser was limiting with values in flesh as 0.513 (male) and 0.516 (female) but 0.511 (male) and 0.487 (female) in innards [25,26]. In order to fulfill the day’s needs for all the AAs in N. maculatus exoskeleton samples, 100/31.72 or 3.15 times as male exoskeleton protein or 100/35.11 or 2.85 times as much female exoskeleton protein have to be consumed (or eaten) when they serve as the sole protein source in the diet. Table 6 contained the EAA scores (EAAS) ofN. maculatus exoskeleton based on FAO/WHO standards [37]. The following scores were greater than 1.00 in both samples: Val (1.54-1.57), Thr (1.35- 1.40), Phe + Tyr (2.03-2.10) and total AA (1.12-1.11). However, in the flesh of N. maculatus all the EAAS were greater than 1.00 whereas in the male and female innards five AA have EAAS greater than 1.00 each: Ile (1.09-1.33), Leu (1.17-1.19), Met + Cys (1.14-1.33), Phe + Tyr (1.27-1.35) and TEAA (1.09-1.10); but in addition, the female innards had Trp score of 1.50. In both present samples, Lys was limiting in both samples having scores of 0.4145 (male) and 0.4746 (female) with corresponding correction values of 100/41.45 (2.41) and 100/47.46 (2.11) respectively. In Table 7 was depicted the EAAS of the exoskeleton ofN. maculatus samples based on requirements of pre-school child (2-5y). In both sexes six EAAS in each case had the EAAS values greater than 1.00. Like the observation in Table 6, Lys was the EAAS of least value in the heterosexuals. Values and correction values were 0.3930 (100/39.30 = 2.54 in male) and 0.4501 (100/45.01 = 2.22 in female).
| Amino acid | Male exoskeleton | Female exoskeleton | Mean | SD | CV% |
|---|---|---|---|---|---|
| Val | 1.03 | 1.05 | 1.04 | 0.0118 | 1.13 |
| Thr | 1.06 | 1.10 | 1.08 | 0.0269 | 2.50 |
| Ile | 0.4672 | 0.4452 | 0.4562 | 0.0156 | 3.41 |
| Leu | 0.7942 | 0.6298 | 0.7120 | 0.1162 | 16.3 |
| Lys | 0.3677 | 0.4210 | 0.3944 | 0.0377 | 9.57 |
| Met | 0.6336 | 0.6581 | 0.6459 | 0.0173 | 2.68 |
| Phe | 1.14 | 1.24 | 1.19 | 0.0670 | 5.62 |
| His | 1.85 | 1.67 | 1.76 | 0.1265 | 7.20 |
| Trp | 0.4403 | 0.4414 | 0.4409 | 0.0008 | 0.1779 |
| Gly | 1.94 | 1.94 | 1.94 | 0.0025 | 0.1279 |
| Ala | 0.6695 | 0.7304 | 0.7000 | 0.0430 | 6.15 |
| Ser | 0.4792 | 0.3911 | 0.4352 | 0.0623 | 14.3 |
| Pro | 1.71 | 1.60 | 1.66 | 0.0760 | 4.59 |
| Asp | 0.9666 | 1.07 | 1.02 | 0.0750 | 7.35 |
| Glu | 0.9657 | 0.9558 | 0.9607 | 0.0070 | 0.7303 |
| Arg | 0.6724 | 0.8551 | 0.7637 | 0.1292 | 16.9 |
| Tyr | 1.59 | 1.57 | 1.58 | 0.0125 | 0.7876 |
| Cys | 0.3172 | 0.3511 | 0.3342 | 0.0240 | 7.19 |
| Total | 0.9047 | 0.9112 | 0.9079 | 0.0046 | 0.5084 |
| Amino acid | Male exoskeleton | Female exoskeleton | Mean | SD | CV% |
|---|---|---|---|---|---|
| Val | 1.54 | 1.57 | 1.56 | 0.0176 | 1.13 |
| Thr | 1.35 | 1.40 | 1.38 | 0.0344 | 2.50 |
| Ile | 0.6541 | 0.6233 | 0.6387 | 0.0218 | 3.41 |
| Leu | 0.9417 | 0.746 | 0.8442 | 0.1378 | 16.3 |
| Lys | 0.4145 | 0.4746 | 0.4446 | 0.0425 | 9.57 |
| Met + Cys | 0.7424 | 0.7830 | 0.0724 | 0.0282 | 3.70 |
| Phe + Tyr | 2.03 | 2.10 | 2.07 | 0.0487 | 2.35 |
| Trp | 0.7926 | 0.7946 | 0.7936 | 0.0014 | 0.1779 |
| Total | 1.12 | 1.11 | 1.11 | 0.0056 | 0.5004 |
| Amino acid | Male exoskeleton | Female exoskeleton | Mean | SD | CV% |
|---|---|---|---|---|---|
| Val | 2.20 | 2.24 | 2.22 | 0.0252 | 1.13 |
| Thr | 1.59 | 1.65 | 1.62 | 0.0404 | 2.50 |
| Ile | 0.9344 | 0.8904 | 0.9124 | 0.0311 | 3.41 |
| Leu | 0.9987 | 0.7920 | 0.8954 | 0.1462 | 16.3 |
| Lys | 0.3930 | 0.4501 | 0.4216 | 0.0403 | 9.57 |
| Met + Cys | 1.04 | 1.10 | 1.07 | 0.0395 | 3.70 |
| Phe + Tyr | 1.02 | 2.00 | 1.51 | 0.6960 | 46.1 |
| Trp | 0.7205 | 0.7224 | 0.7215 | 0.0001 | 0.1779 |
| His | 2.33 | 2.11 | 2.22 | 0.1598 | 7.20 |
| Total | 1.32 | 1.30 | 1.31 | 0.0149 | 1.14 |
Results on scores from Tables 5, 6 and 7 were subjected to statistical analyses. The scores compared were egg (Male/Female), pre- school child (Male/Female) and provisional scoring pattern (Male/Female). In all the comparisons, all rxy values were high and positively significant (0.8577-0.9890). These values were high: rxy2 (0.7357-0.9781); Rxy (0.8806-1.04); CV%1 (50.9-54.5); CV%2 (51.0-53.3); IFE for egg (0.8256) and provisional scoring pattern (0.8521).
The summary of the amino acid profiles into factors A and B could be seen in Table 9. Factor A means constituted AAs of the two samples along the vertical axis whilst Factor B means constituted the AAs values along the horizontal axis as shown in the Table 9: both containing the EAA and NEAA. It would be observed that the mean of Factor A means and Factor B means gave a value of 45.4g/100g protein.
In Table 10, we have estimates of amino acid requirements at ages 10-12 years in mg/kg/day at the body weight of 30 kg. The protein of the male exoskeleton had values greater than the estimates in Phe + Tyr to the tune of 186%, to the tune of 25.8% in Trp and to the tune of 48.1% in Val. In female protein excess EAAs were produced in Phe + Tyr (excess = 218%), Thr (excess = 8.86%), Trp (excess = 35.0%), Val (excess = 61.6%) and TEAAs (excess = 4.01%). On these observations, female was better in 5/9 (55.56%) parameters whereas male was better in 3/9 (33.33%).
| Statistics | Egg scores (Male/Female) | Pre-school child (Male/Female) | Provisional scoring pattern (Male/Female) |
|---|---|---|---|
| rxy | 0.9847 | 0.8577 | 0.9890 |
| rxy^2 | 0.9696 | 0.7357 | 0.9781 |
| Rxy | 0.9396 | 0.8806 | 1.04 |
| Mean1 | 0.9495 | 1.25 | 1.06 |
| SD1 | 0.5178 | 0.6594 | 0.5389 |
| CV%1 | 54.5 | 52.8 | 50.9 |
| Mean2 | 0.9510 | 1.33 | 1.06 |
| SD2 | 0.4941 | 0.6770 | 0.5654 |
| CV%2 | 52.0 | 51.0 | 53.3 |
| CA | 0.1744 | 0.5141 | 0.1479 |
| IFE | 0.8256 | 0.4859 | 0.8521 |
| Remark | Significantly diffrent | Significantly different | Significantly different |
Egg score is significantly different at n-2 and r= 0.01 (critical value = 0.590); preschool child score is not significantly different at n-2 and r= 0.01 (critical value = 0.798); provisional score is significantly different at n-2 and r= 0.01 (critical value = 0.834)
| Samples | (Factor A) | |||
|---|---|---|---|---|
| Amino acid composition | Male exoskeleton | Female exoskeleton | Factor B means | |
| Total essential amino acid | 37.7 | 37.0 | 37.4 | |
| Total non-essential amino acid | 52.7 | 54.0 | 53.4 | |
| Factor A means | 45.2 | 45.5 | 45.4 |
| Amino acid | School boys (10- 12y) = R | School boys 30kg x R = S | Male exoskeleton = T | S-T (%) | Female exoskeleton = U | S-U (%) |
|---|---|---|---|---|---|---|
| Ile | 30 | 900 | 497 | +403(+44.8) | 509 | +391(+43.4) |
| Leu | 45 | 1350 | 1253 | +97(7.19) | 1066 | +284(+21.0) |
| Lys | 60 | 1800 | 433 | +1367(+75.9) | 533 | +1267(+70.4) |
| Met+Cys | 27 | 810 | 494 | +316(+39.0) | 559 | +251(+31.0) |
| Phe+Tyr | 27 | 810 | 2317 | -1507(-186) | 2572 | -1762(-218) |
| Thr | 35 | 1050 | 1027 | +23(+2.19) | 1143 | -93.0(-8.86) |
| Trp | 4 | 120 | 151 | -31(-25.8) | 162 | -42.0(-35.0) |
| Val | 33 | 990 | 1466 | -476(-48.1) | 1600 | -610 (-61.6) |
| Total EAAs | 261 | 7830 | 7638 | +192(+2.45) | 8144 | -314(-4.01) |
+ = S > T or S > U; - = T > S or U > S; T or U was calculated as specific amino acid x 10 x appropriate corresponding protein
Conclusions
Neopetrolisthes maculatus exoskeleton samples in both male and
female samples were good sources of high quality amino acids
with the female total amino acids and the protein being more in
value than the total male amino acids and its protein. In quality
parameters, P-PER values were moderate; both EAAI and BV
values were high; Lys/Trp were moderate but Met/Trp were high.
The amino acid concentration levels had this class trend: class I
> class IV > class VI > class V > class II > class VII > class III.
In many parameter comparisons in the two heterosexual samples,
the male exoskeleton was found to show superiority in quality
than the female exoskeleton in these parameters: EAA in male
was 37.7g/100g protein > 37.0 for EAA in female sample; P-PER1
(male) was 1.86 > 1.24 in female; P-PER2 in male was 2.02 > 1.41
in female; EAAI1 male was 1.18 but female had 1.16; EAAI2, male
was 88.5 > 88.3 in female and BV value for male was 84.7 > 84.5
in female. According to the Department of Fisheries and Aquatic
Resources (DFAR) data published in 2014, annual Sri Lanka total
crab production is around 11,000 tons in 2012 [62]. This type of
information is also important for us in Nigeria.
References
1. PubChem and the American Chemical Society (2018)
Reshaping Scholarly Communication. USA: University of
Califonia, 2005-05-31. Retrieved p-10-15.
2. Moruf OR, Saba AO, Joy Chuckwu-Ozazua, Elegbede
IO (2019) Seasonal variation in macro-micronutrient
compositions of the flesh and shell of the portunid crab
Callinectes amnicola (De Rochebrune, 1883) from the coastal
waters of Southwest Nigeria. Agricutura Tropica et Subtropica
1: 109 -110.
3. FAO (1998) Food and Agriculture Organization Annual
Report. Rome, Italy.
4. Indufueke AD (1994) Nigerian move towards self-sufficiency
in animal protein production. Proceedings of the Nigerian
Veterinary medical Association Annual Conference, Lagos
p-13-16.
5. Onyia L, Adebayo EF, Adewuyi K, Ekwunife E, Ochokwu
I (2014) Comparative economics of fresh and smoked fish
marketing in some local government areas in Adamawa State,
Nigeria. IIFET 2014 Australia Conference Proceedings.
6. Fagbuaro O, Oso JA, Majolagbe FA, Oladapo AO (2013)
Quality analysis of freshwater crab Cardisoma armatum and
marine blue crab Callinectes ammicola collected from Yaba,
Lagos, Nigeria. Nature and Science 11: 22-29.
7. Oyekanmi A (1984) Outline of food analysis. First Edn.,
Macmillan, London.
8. Hall D, Lee SY, Meziane T (2006) Fatty acid as tropic tracer
in an experimental estuarine food chains. Tracer transfer. J.
Exptal. Marine Biol. Ecol 336: 42-53.
9. Ahyoung ST, Baba K, Macpherson E, Poore GCB (2010) A
new classification of the Galatheoidea (Crustacea: Decapoda:
Anomura), Zootaxa 2676: 57-68.
10. Milnes EH (1837) Histoire naturelle des Crustacés,
comprenant l’anatomie, la physiologie et al classification
de ces animaux, Librairie Encyclopédique de Roret, Paris.
11. Vine P (1986) Red sea invertebrates. Immel Publishing,
London.
12. Poupin J, Juncker M. (2010) Guide des Crustaces Decapodes
du Pacifique Sud/A Guide to Decapod Crustaceans of the
South Pacific. CRISP and CPS, Noumea.
13. Davie PJF (2002) Crustacea: Malacostraca: Eucarida (Part
2): Decapoda -Anomura, Brachyura, in: A. Wells, W. W. K.
Houston (Eds). Zoological Catalogue of Australia, 19(3B),
CSIRO Publishing, Melbourne.
14. Haig J (1965) The Porcellanidae (Crustacaea, Anomura) of
Western Australia with description of four new Australian
species. Journal of the Royal Society of Western Australia
48: 97-117.
15. King I, Childs MT, Dorsett C, Ostrander JG, Monsen ER
(1990) Shellfish: Proximate composition, minerals, fatty acid
and sterols. J. Amer. Dietic Ass 90: 677-685.
16. Skonberg DI, Perkins BL (2002) Nutrient composition of
green crab (Carcinus maenas) leg meat and claw meat. Food
Chem. 72: 401-404.
17. USDA (2003) US Department of Agriculture, National
nutrient data base for standard reference. Release 16: Nutrient
data laboratory Home page. Available http://www.nal.usda.
gov/fnic/foodcomp/search
18. Jayasingbe GDTM, Jinadasa BKKK, Nethmina NAAN
(2019) Determination of the fatty acid composition of blue
swimmer crabs (Portunus pelagicus) by gas chromatography.
Austin Journal of Nutrition and Food Science 7: 1124-1126.
19. Soundarapandian P, Varadharajan D, Jaganathan K,
Ravichandran S (2015) Fatty acid composition in long-eyed
swimming crab Podophthalmus vigil (Fabricius). Journal of
Nutrition and Food Sciences 5: 1.
20. Martino RC, Gracinda MC (2004) Proximate composition
and fatty acid content of the mangrove oyster Crassostrea
rhizophorae along the year seasons. Braz. Arch. Biol. Tech.
47: 6-11.
21. Natan G, Dlua K, Yerlikayaa P (2003) Determination of
proximate composition and mineral contents of blue crab
(Callinectes sapidus) and swim crab (Portunus pelagicus)
caught off the Gulf of Autlya. Food Chem 80: 495-498.
22. Kucukgulmez A, Celik M, Yanar Y, Ersoy B, Cikrikei M
(2006) Proximate composition and mineral contents of the
blue crab (Callinectes sapidus) breast meat, claw meat and
hepatopancreas. Int. J. Food Sci. and Technol 41: 1023-1026.
23. Omotoso OT (2005) Chemical composition and nutritive
significance of the land crabs, Cardisoma armatum
(Decapoda). Afr. J. Appl. Zoo. and Envital. Biol 7: 68-72.
24. Adeyeye EI, Olanlokun JO, Falodun TO (2010) Proximate
and mineral composition of whole body, flesh and exoskeleton
of male and female common West African fresh water crab
Sudananautes africanus africanus. Pol. J. Food Nutr. Sci 60:
213-216.
25. Adeyeye EI (2017) Amino acid profiles of the flesh of the
heterosexual pairs of Neopetrolisthes maculatus. International
Letters of Natural Sciences 61: 23-35.
26. Adeyeye EI (2019) Simultaneous identification and evaluation
of amino acid profiles of the male and female innards of
Neopetrolisthes maculatus. International Letters of Natural
Sciences 75: 13-26.
27. Moronkola BA, Olowu RA, Tovide OO, Ayejuyo OO (2011)
Determination of proximate and mineral contents of crab
(Callinectes amnicola) living on the shore of Ojo River,
Lagos, Nigeria. Sci. and Chem. Comm. 1: 1-6.
28. Jimmy UP, Arazu VN (2012) The proximate and mineral
composition of two edible crabs Callinectes amnicola and
Uca tangeri (Crustacea: Decapoda) of the Cross River Nigeria.
Pak. J. Nutr. 11: 78-82.
29. Haig J (1975) Expèdition Rumphius II. Crustacès parasites,
commonsaux, etc. (Th. Monod et R. Serene, Ed.). V.
Porcellanidae (Crustacea, Decapoda, Anomura). Bulletin
du Museum National d‘Histoire Naturelle, Paris, 4e section
A (1): 119-135.
30. AOAC (2006) Official Methods of Analysis, 18th ed.,
Association of Official Analytical Chemists, Washington,
DC, Method p-982-30
31. Danka PO, Dobrina DT, Kalin VI (2012) Simultaneous
identification and determination of total content of amino
acids in food supplements - tablets by gas chromatography.
Asian J. Pharm. Clin. Res 5: 57-68.
32. Olaofe O, Akintayo ET (2000) Prediction of isoelectric
point of legume and oil seed proteins from their amino acid
composition. The J. Technosci 4: 49-53.
33. Alsmeyer RH, Cunningham AE, Happich ML (1974)
Equations to predict PER from amino acid analysis, Food
Technol 2: 24-38.
34. Oser BL (1959) An Integrated essential amino acid index for
predicting the biological value of proteins, in: AA Albanese
(Ed.), Protein and Amino Acid Nutrition. Academic Press,
New York, pp. 281-295.
35. Steinke FH, Prescher EE, Hopkins DT (1980) Nutritional
evaluation (PER) of isolated soybean protein and combinations
of food proteins. Journal of Food Science 45: 323-327.
36. Paul AA, Southgate DAT, Russsel J (1978) First supplement
to McCance and Widdowson’s The Composition of Foods.
HMSO, London.
37. FAO/WHO (1973) Energy and protein requirements.
Technical Report Series No 522, WHO, Geneva.
38. FAO/WHO/UNU (1985) Energy and protein requirements.
Technical Report Series No 724, WHO, Geneva.
39. Nieman DC, Butterworth DE, Nieman CN (1992) Nutrition.
Wc Brown Publishers, Dubuque.
40. Adeyeye EI (2008) Amino acid composition of whole body,
flesh and exoskeleton of female common West African fresh
water crab Sudanautes africanus africanus. Pakistan Journal
on Nutrition 7: 748-752.
41. Walther B, Schmid A, Sieber R, Wehmuller K (2008) Cheese
in nutrition and health. Diary Science & Technology 88:
389-405.
42. FAO/WHO (1990) Protein quality evaluation. Report of Joint
FAO/WHO Consultation, Bethesda, MD, 4-8 December,
1989. FAO/WHO, Rome.
43. Muller HG, Tobin G (1980) Nutrition and food processing.
Avi Publishing, Westport, CT.
44. Friedman M (1996) Nutritional value of proteins from
different food sources - A review. Journal of Agriculture
and Food Chemistry 44: 6-29.
45. Adeyeye EI, Oyarekua MA, Adesina AJ (2014) Proximate,
mineral, amino acid composition and mineral safety index of
Callinectes latimanus. International Journal of Development
Research 4: 2641-2649.
46. FAO/WHO (1991) Protein quality evaluation. Report of Joint
FAO/WHO Expert Consultation. Food and Nutrition Paper
51, FAO, Rome.
47. FAO (1985) Sorghum and millets in human nutrition. FAO
Food Nutrition Series No 27, FAO/UN, Rome.
48. Belavady B, Srikantia SG, Gopalan C (1963) The effect of
oral administration of leuane on the metabolism of tryptophan.
Biochem. J 87: 652-655.
49. Belavady B, Rao PU (1979) Leucine and isoleucine content of
jowar and its pellagragenicity, Indian Exp. Biol 17: 659-661.
50. Deosthale YG (1980) Nutrition dimension of high yielding
and hybrid crop varieties: Locational and varietal differences
in nutritional value; in: FAO, FAO Food and Nutrition Series,
No. 27, Sorghum and Millets in Human Nutrition, FAO p- 82.
51. Adeyeye EI (2005a) Amino acid composition of variegated
grasshopper, Zonocerus variegatus. Tropical Science 45:
141-143.
52. Adeyeye EI (2005b) The composition of the winged termites,
Macrotermes bellicosus. Journal of Chemical Society of
Nigeria 30(2): 145-149.
53. Adeyeye EI (2004) The chemical composition of liquid
and solid endosperm of ripe coconut. Oriental Journal of
Chemistry 20: 471-476.
54. Adeyeye EI, Afolabi EO (2004) Amino acid composition
of three different types of land snails consumed in Nigeria.
Food Chemistry 85: 535-539.
55. Adeyeye EI, Asaolu SS, Aluko AO (2007) Amino acids
composition of two masticatory nuts (Cola acuminata and
Garcinia kola) and snack nut (Anacardium occidentale).
International Journal of Food Science and Nutrition 58:
241-249.
56. Bingham S (1977) Dictionary of Nutrition. Barrie and Jenkins,
London.
57. Cavins JC, Kwolek DF, Inglett GE, Cowen JC (1972) Amino
acid analysis of soybean meal: interlaboratory study. Journal
of Association of Official Analytical Chemists 55: 686-694.
58. Adeyeye EI, Aremu MO (2011) Amino acid composition of
two fancy meats (Liver and Heart) of African giant pouch
rat (Cricetomys gambianus). Oriental Journal of Chemistry
27: 1409-1419.
59. Albanese AA (1950) Protein and amino acid requirements of
mammals, Academic Press, New York.
60. Mitchell HH (1950) a method for determining the biological
value of protein, in: AA Albanese (Ed.), Protein and amino
acid requirements of mammals. Academic Press, New York
p- 1-32.
61. Pencharz PB, Hsu Jean. W-C, Ball RO (2007) Aromatic amino
acid requirements in healthy human subjects. The Journal of
Nutrition p-1-3.
62. Steve C (2014) Sri Lankan blue swimming crab fishery
assessment. Sri Lanka: Seafood exporters’ association of
Sri Lanka, Colombo.