Author(s): Gerald C Hsu
Abstract
The author uses GH-Method: math-physical medicine (MPM) approach to investigate his risk probability on metabolic disorder induced cardiovascular disease (CVD), stroke, or chronic kidney disease (CKD), as well as probability of pancreatic beta cells self-recovery. He addresses the damages caused by metabolic disorders affecting arteries and micro-vessels in terms of blockage, rupture, or leakage along with the probability assessment of pancreatic beta cells self-recovery. Furthermore, he uses mathematical correlations to distinguish the weighted impact by metabolism on heart, brain, kidney, and pancreas.
He further defined a new parameter, metabolism index (MI), as the combined score of the above 10 metabolism categories and 500 elements. He also defined another term, General Heath Status Unit (GHSU), as the 90-days moving average value of MI for indicating the trend of metabolism. This MI value is continuously and dynamically calculated whenever the patient has encountered some condition changes and their relevant data were collected regarding his medical conditions and lifestyle details. He has identified a mathematical normalized “break-even line” at 0.735 (73.5%) to separate his metabolism conditions between healthy (below 0.735) and unhealthy (above 0.735).
He started to collect his above- mentioned personal detailed data on 1/1/2012. Thus far, he has collected and stored ~2 million data of his own body health and personal lifestyle.Through his developed four prediction models of weight and glucose (FPG, PPG, and HbA1C), he has successfully reduced his glucose level from 280 mg/dL (A1C 10%) in 2010 to 113 mg/ dL (A1C 6.4%) in 2020. It should be noted that, for the period of 2016-2020, he did not take any diabetes drugs or insulin injections.
In 2017-2018, he developed two similar but rather different mathematical models to calculate risk probability of having a CVD/Stroke and CKD, respectively.In 2019-2020, he further conducted a special research on probability and improvement rate of his pancreatic beta cells self-recovery situation.
At first, he built a baseline model, including genetic factors such as steady state and unchangeable conditions (race, gender, family history, and personal medical history), semi-permanent factors such as weight and waistline, and bad habits such as hard to change conditions (smoking, alcohol drinking, and illicit drugs).Next, he developed a risk probability calculation model for
estimating the following three scenarios:
For CVD and CKD, his calculation results are further divided into
the following three groups:
(A) Medical conditions (individual M1 through M4: i.e. weight,
glucose, blood pressure, lipid, and ACR).
(B) Lifestyle details (individual M5 through M10).
(C) MI scores (a combined score of M1 through M10).
With these mathematical risk probability assessment models, he can obtain three separate percentages of risk probability (i.e. medical-based, lifestyle-based, and MI-based, but these three results are quite close to each other) to offer a range of the risk prediction of having cardiovascular diseases, stroke, or chronic kidney diseases resulted from metabolic disorders, unhealthy lifestyles, and their combined impact on the human body.
For self-recovery of pancreatic beta cells, he examined annual change rate of FPG, PPG, and HbA1C, (its outcome, “glucose” only). However, there is a data reliability issue associated with existing medical testing and measurement community, including finger-piercing glucose devices, continuous glucose monitoring (GM) sensor devices, and lab-tested HbA1C devices and process. Sometimes, their output data’s deviation could be in the range of 25% or more. Therefore, the author decided to derive the following three sets of simple formulas for his “Beta-cells %” calculation which are used in his calculation table (Figure 5).(1) Average glucose = (FPG + PPG) / 2
(2) Average HbA1C = (Lab A1C + math A1C) / 2
(3) Beta cell % = (Average glucose + (Average HbA1C * 17.1931))
/ 4; where 17.1931 is the glucose conversion factor he has used
in his mathematical daily predicted HbA1C value. The reason of
“dividing by 4” is for a purpose of better viewing for his data or
curve that it would give a final number within the general data
range of other three datasets. After all, all of these data or curves
are “relative”, not “absolute”, and for serving the porpoise of
investigating their relative relationship.
During the past 8+ years, all of his measurements of weight, glucose and blood pressure were performed using home-based devices. However, to obtain his tested data of HbA1C, albumin, creatinine, and albumin-creatinine ratio (ACR), these were done in a laboratory or hospital.
Finally, it should be noted here that the risk probability percentages and pancreatic beta cells self-recovery rate are expressed on a “relative” scale, not on an “absolute” scale.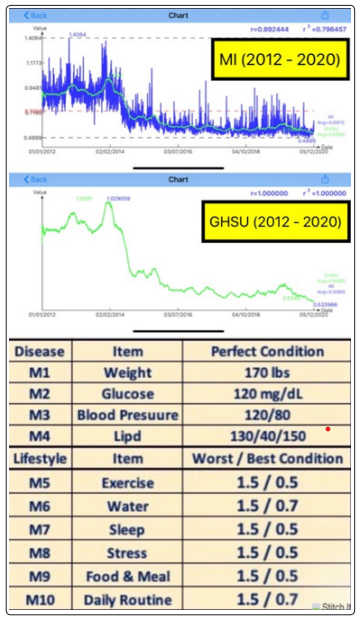
Figure 1: Metabolism Index (2012-2020) & measurement standards (M1-M10)
Figures 2 shows his risk probability % of having a CVD or stroke (heart or brain). It is obvious that his CVD risk % is decreasing from 82% in 2012 gradually down to 51% in 2020 with a linear decreasing speed of 4.3% per year. The year of 2014 is the turning point.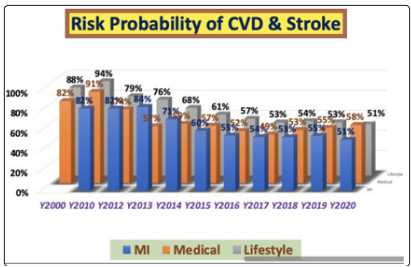
Figure 2: Probability Risk % of having a CVD or Stroke (2012- 2020)
Figures 3 depicts his risk probability % of having a CKD (kidney). His CKD risk % is decreasing from 69% in 2012 gradually down to 35% in 2018 through 2020 with a linear decreasing speed of 5.8% per year. The year of 2013 as the turning point.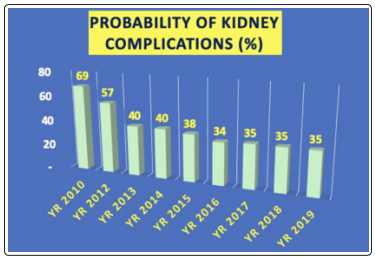
Figure 3: Probability Risk % of having a CKD (2012-2020)
Figure 4 depicts a table which lists all of numerical values of MI %, CVD risk %, CKD risk %, and Beta cells %.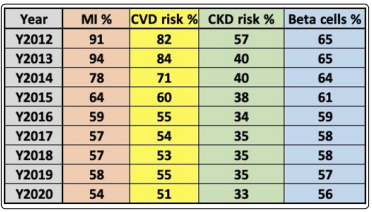
Figure 4: Table of MI %, CVD Risk %, CKD Risk %, & Beta cells (2012-2020)
Figure 5 shows the calculation table of beta cells % from both glucose and HbA1C.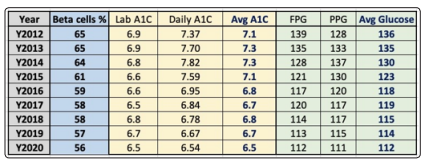
Figure 5: Calculation Table of Beta cells from both Average Glucose and Average HbA1C
Furthermore, in Figure 6, three additional interesting discoveries are observed: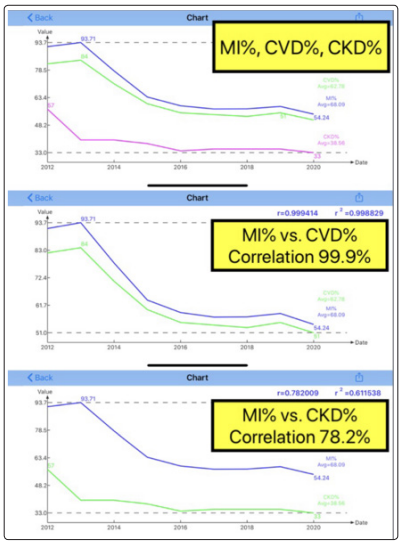
Figure 6: Correlation of MI % vs. CVD %, MI % vs. CKD %, and MI % vs. Beta cells (2012-2020)
(A) The correlation between MI % and CVD % is 99.9% while the correlation between MI % and CKD % is 78.2%. Both correlations are quite high (greater than 50%) which indicates that metabolism conditions indeed causing the risk probabilities of having both heart/brain and kidney complications.
(B) He further delves into the question of why there is a gap between these two correlation coefficients. It is obvious that the 99.9% of the damage on the heart and brain’s arteries is 21.7% higher than the 78.2% of the damage on the kidney’s microvessels. This difference probably indicates a closer and stronger relationship between MI and CVD than MI and CKD. In order to provide more confirmation regarding this hypnoses, more clinical data analyses will be needed.(C) The correlation between MI % and beta cells % is 95.1%, but the actual difference between the beta cell value of 65 in 2012 and 56 in 2020 is only 13.85% over 8.5 years. This difference provides 1.6% reduction rate per year which is close to his prior findings of possible self-recovery rate of pancreatic beta cells around 2.3% per year. The small difference of 0.7% is due to many simplification steps used in beta cells % formation in this paper with its main objectives being “trend” and “relationship”.
In Figure 7, we can see the combined four curves of these different cases.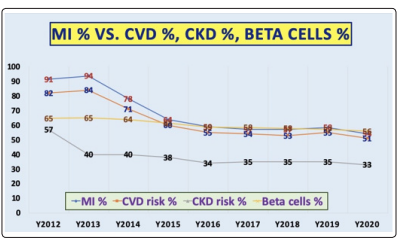
Figure 7: Four curves of MI %, CVD Risk %, CKD Risk %, Beta cells (2012-2020)