Author(s): Yaser Hamdouna
Background: CF is a chronic, multisystem genetic disease with a wide variability in clinical severity. CF is a disease of exocrine gland function that involves multiple organ systems but chiefly results in chronic respiratory infections, pancreatic enzyme insufficiency, and associated complications in untreated patients. Many studies explained the lower QOL among adults with CF. in GS there is no previous studies concerned with measuring QOL among CF children
Aim of the Study: The aim of this study was to assess the QOL among children with CF.
Methodology: The study was descriptive, analytical and cross sectional studies. The study involves all 36 children with CF (less than 12 years old) who attained CF friends center; community based center in Gaza. The researchers uses the questionnaire which included demographic & illness related variables and Quality of life domains (physical, emotional, social and school). Reliability coefficient for the questionnaire was good (Cronbach alpha =0.833).
Results and Conclusion: About 61% of the study population were males and 39% were females. Approximately 47% of them were less than 9 years and 53% were more than 9 years. About 41.7% of the study population from Gaza, 25.0% from middle zone, 13.9% from Rafah, 11.1% from Khanyounis and 8.3% from North of Gaza. Housing classification was 38.9%, 33.3% and 27.8 % for property house, renting house and family house respectively. Most of their parents had low educational levels and the majority of them were unemployed and have a monthly income less than 1200 NIS. About 61% of them have another sibling with CF. the majority of them receive Creon at a regular basis. The most common disease associated with them was Respiratory problem with 43.2%, 38.3% had gastrointestinal disease, 14.8% had heart disease and 3.7% had Diabetes Mellitus. The overall perception of the children regarding QOL was low (55%). The social functions was the highest (61.6%), physical functions (55.2%), school function (50.6%), and emotional function (48.8%). The result presented below show that no significant difference in QOL between socio-demographic data (p-value > 0.05) except the difference for QOL between age groups) p-value =0.001). Children older than 9 years old (2.95±0.3) have QOL more than children under nine years of age (2.53±0.4) and this difference was statistically significant as (P value = 0.02 < 0.05). It is also clear that QOL in males are more than female but this difference was not statistically significant. There is a positive correlation with a highly significant difference between QOL and the 4 domains and between domains with each other. Social performance was high correlated with school performance (r = 0.706) while the lowest correlation was between physical and school performance with no significant (p-value =0.065).
Recommendations: The study recommend the importance of initiating a program to enhance the QOL for children with CF and focusing on the emotional health for those children as it was the least one perceived.
Cystic fibrosis (CF) is a chronic, multisystem genetic disease with a wide variability in clinical severity [1]. CF is an inherited disorder that causes severe damage to the lungs, digestive system and other organs in the body [2]. CF is a disease of exocrine gland function that involves multiple organ systems but chiefly results in chronic respiratory infections, pancreatic enzyme insufficiency, and associated complications in untreated patients. The natural course of CF is one of progressive deterioration in health as the disease proceeds, decrements in physical functioning become more apparent placing greater limitations on the individual (National Heart, Lung, and Blood Institute (NHLBI), 2016). CF requires daily care, people with this condition are usually able to attend school and work, and often have a better quality of life (QOL) than people with cystic fibrosis had in previous decades (NHLBI, 2016). Due to improved symptomatic therapies, survival periods have increased dramatically in recent decade. Improvements in screening and treatments mean people with cystic fibrosis now may live into their mid- to late 30s, on average, and some are living into their 40s and 50s (NHLBI, 2016). This study tries to investigate the quality of life for children with CF in Gaza governorates in order to focus the light on the needs for these chronically ill children.
Life expectancy for individuals with CF has increased dramatically in the last few decades. Twenty years ago, individuals with CF survived into adolescence, but today earlier diagnosis and more aggressive treatments have extended life expectancy into adulthood. In 2017, the median life span for individuals with CF is approximately 37 years (Cystic Fibrosis foundation (CFF), 2017). As mentioned above, life expectancy was increased dramatically, so the focus should be on the quality of life for those with CF. the patient’s quality of life is one of the most important priorities in nursing care. This reflects a positive perspective on nursing service. If the patient has a good quality of life, this gives a good impression and a good background on the care provided to him.
The idea of this research arise during my training in Al-Nasr pediatric ‘s hospital when a child with CF was admitted to general department, the child was suffering from underweight, complaining from respiratory infections with respiratory distress, so I planned to perform a research to measure the quality of life for patients with CF in GS. GS complain from prolonged siege which affect the drug supply specially for those with chronic diseases including CF. By reviewing the CF friend’s center, the only non-profit community center helping CF in GS, the number of cases increased in the last years with deteriorated health care and economics. For the above reasons we are interested to study the QOL for CF children as this study was the first in GS according to best knowledge of researcher.
The aim of this is to assess the quality of life for children diagnosed with CF in Gaza strip.
Palestine is an Arabic Country, relatively small one. The total surface area of the historical Palestine is about 27.000 Km^2 (Palestine, MOH, 2017). Palestine has been occupied in 1948 by Israel and the two remaining parts are separated geographically (West Bank and Gaza Strip) after the war in 1967 (Palestine, MOH, 2017). Palestine is surrounded by Lebanon, Syria, Gordon, Egypt, and Mediterranean Sea. The total area of the Gaza Strip (GS) and West Bank is about 6020 Sq. Km with total population living in is about 4,781,248 individuals (1,899,291 in GS and 2,881,957 in West Bank) with a population density of 794 capita per sq. Km (Palestinian Central Bureau of Statistics-PCBS, 2017). GS is a narrow piece of land lying in the coast of Mediterranean Sea. The total area of GS is about 365 square kilometer (PCBS, 2011). GS is overcrowded area with total population about 1,899,291 with population density of 5203 inhabitants/ Km2 (PCBS, 2017). GS is divided into five governorates: Gaza Governorates, North Governorates, Mid-zone Governorate, Khan-Younis Governorate, and Rafah Governorate. This high population density in GS increases the overload on the hospitals care.
Health care system in Palestine is complex [3]. Health service delivery in Palestine is divided into five types of health care providers: two public providers (the Ministry of Health and the Ministry of Interior - Military health services-), multiple private providers (hospitals, clinics) and numerous NGO providers (the United Nations Relief and Works Agency-UNRWA and other local NGOs). UNWRA operates an extensive network of outpatient services for the registered refugee population following 1948 [4]. MOH provides a package of primary, secondary, and tertiary health care services. The main roles and responsibilities of the MOH according to the Palestinian Public Health Law are: providing, regulating and supervising the provision of health care in Palestine. Also, MOH is responsible about planning the health care services in coordination with different stakeholders, enhancing health promotion to improve the health status, developing human resources in health sector, managing and disseminating health information, and others (Palestine, MOH, 2016).
CF friends center is non-profit health center which has a companionship with the Cystic fibrosis worldwide (CFW) that provide multi-disciplinary health services to patients with CF lived in the 5 governorates of GS. This center was established in 2008 in Gaza city which aimed to provide health services for all patients with CF who need ongoing medical evaluation and treatment. According to health information center of the Palestinian MOH there are lack of statistics regarding CF in GS because the patients take medical supervision in pulmonary diseases department and don’t have a specialized center in MOH. (Table 1) illustrates the number of registered CF patients in the CF friends center in GS according to the statistics of CF friend center.
Table 1: Registered cases in CF friends center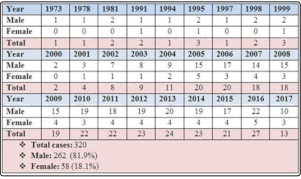
Child: Every human being below the age of 18 years unless under the law applicable to the child, majority is attained earlier (UNICEF, 2013).
Health: a state of complete physical, mental, and social well-being and not only the absence of disease or infirmity (WHO, 1948).
Quality Of Life (QOL): Individual’s perception of their position in life in the context of the culture and value systems in which they live and in relation to their goals, expectations, standards and concerns, It is a broad ranging concept affected in a complex way by the person’s physical health, emotional state, level of independence, social relationships, personal beliefs and their relationship to salient features of their environment [5].
Cystic Fibrosis (CF): a disease of exocrine gland function that involves multiple organ systems but chiefly results in chronic respiratory infections, pancreatic enzyme insufficiency, and associated complications in untreated patients.
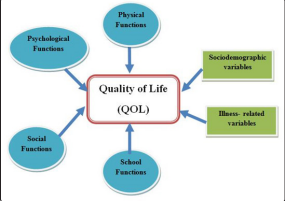
Figure 1: Conceptual Framework
The above figure illustrates factors that affect the QOL for children with CF. these factors are:
1. Physical functions: implies energy and fatigue, Pain and discomfort, Sleep and rest (WHO, 1994) 2. Emotional functions implies bodily image and appearance, Negative feelings, Positive feelings, Self-esteem, Thinking, learning, memory and concentration (WHO, 1994). 3. Social functions implies personal relationships, Social support, Sexual activity. 4. School functions: which implies school performance, attendance, achievement…etc.
All these domains or function of QOL affect the overall QOL for children with CF in addition to the sociodemographic variables (age, gender, place of residence, family income, parents education) and illness related variables (follow up facility, therapeutic regimen, co-morbidity). This study aimed to assess the level of QOL and its relationship with QOL domains and sociodemographic variables and illness related variables in order in investigate this issue deeply.
CF is a common severe genetic disease that affects the exocrine glands and is characterized by the production of abnormal secretions, leading to mucus buildup that impairs the pancreas and, lung, and intestine [4]. CF is a metabolic disorder of the exocrine glands, usually developing during early childhood and affecting mainly the pancreas, respiratory system, and sweat glands. It is maked by the production of abnormally viscous mucus by the affected glands, usually resulting in chronic respiratory infections and impaired pancreatic function [5]. CF is a chronic, multisystem genetic disease with a wide variability in clinical severity. The measurement of quality of life in CF provides additional information about the impact of this disease.
CF is one of the most lethal, autosomal recessive, monogenic disorders affecting over 70,000 individual s worldwide (Cystic Fibrosis Foundation, 2014). CF has been reported to have the highest prevalence among Caucasians, with incidence at birth ranging from 1 in 2500 (newborn in Finland) to 1 in 1800 (newborn in Slovakia). CF is the second most common life- shortening, inherited disorder occurring in childhood in the United States (US), after sickle cell anemia (American Lung Association, 2010). Data from the 2013 (US Cystic Fibrosis Foundation Registry) annual report estimate 28103. CF patients in the United States, and 70 000 patients worldwide [6]. CF prevalence in the Middle East ranges from 1 in 2,500 to 1 in 16,000 with different mutation frequencies depending on the population ethnic descent. The incidence rate of CF among the Arab population is ranged from very rare to as prevalent as among Caucasians. However, reliable information about the frequency of CF among the Palestinians is still lacking and the spectrum and nature of mutations have not been documented yet, hampering molecular diagnostics [7].
In cystic fibrosis, the CFTR mutation causes alterations in epithelial ion transport on mucosal surfaces, resulting in generalized dysfunction of the exocrine glands. The epithelial cells fail to conduct chloride, and water transport abnormalities occur. This results in thickened, tenacious secretions in the sweat glands, gastrointestinal tract, pancreas, respiratory tract, and other exocrine tissues. The increased viscosity of these secretions makes them difficult to clear. The sweat glands produce a larger amount of chloride, leading to a salty taste of the skin and alterations in electrolyte balance and dehydration. The pancreas, intra hepatic bile ducts, intestinal glands, gallbladder, and sub maxillary glands become obstructed by viscous mucus and eosinophilic material [8]. Pancreatic enzyme activity is lost and mal-absorption of fats, proteins, and carbohydrates occurs, resulting in poor growth and large, malodorous stools. Excess mucus is produced by the trachea bronchial glands. Abnormally thick mucus plugs the small airways, and then bronchiolitis and further plugging of the airways occur. Secondary bacterial infection with such as Staphylococcus aureus & Pseudomonas are often occurs [8]. This contributes to obstruction and inflammation, leading to chronic infection, tissue damage, and respiratory failure. Nasal polyps and recurrent sinusitis are common. Boys have tenacious seminal fluid and experience blocking of the vas deferens, often making them infertile and in girls, thick cervical secretions might limit penetration of sperm (Hazle, 2010).
CF is a chronic progressive disease that can present with protein and fat malabsorption (failure to thrive, hypoalbuminemia, steatorrhea), liver disease (cholestatic jaundice), or chronic respiratory infection. Meconium ileus is considered as early neonatal manifestation of CF [2].
Airway obstruction, chronic cough, Barrel Shape chest, Decrease Pulmonary functions, Clubbing Finger Shape, Recurrent pneumonia, Hemoptysis, pneumothorax, Nasal polyps, Difficult Clearing Secretion [8].
include Meconium ileus, Gallstone, failure to thrive (FTT), Hyperglycemia and Development of Diabetic later in life, Obstructive Cirrhosis With esophageal Varices and Splenomegaly, Gastroesophageal reflex Disease, intussusceptions, rectal prolapsed , Bowel Obstruction , Mal absorption of iron and Vitamin (A, D, E, K) [8].
Readily available commercial DNA tests detect many CF mutations, but because there are more than 1500 identified mutations (and others yet to be identified), DNA analysis will not detect all cases of CF, therefore, the diagnostic test of choice is still the sweat test [2].
The presence of one or more typical clinical features of CF (chronic pulmonary disease, characteristic gastrointestinal and nutritional abnormalities, salt loss syndromes, or obstructive azoospermia) AND
For those identified by positive newborn screening or because a sibling has CF, positive sweat chloride testing or the presence of known disease-causing DNA mutations are the only criteria required for diagnosis, as clinical symptoms may not be manifested early in life [2].
The treatment of CF is multifactorial, but it is primarily directed toward the gastrointestinal and pulmonary complications. Presently, there is no effective single cure for cystic fibrosis. The management of CF is complex and is best coordinated by personnel at accredited CF centers. As with other severe chronic diseases, management of CF patients requires a multidisciplinary team working with patients and their families to maintain an optimistic, comprehensive, and aggressive approach to treatment. Therapies targeted at correcting the underlying CFTR defect are under investigation. Recently, a landmark medication known as small-molecule potentiators targeted to improve function of defective CFTR has been approved for a small subset of CF patients who have an abnormal gating mechanism of their CFTR protein. Management of pulmonary complications is directed toward facilitating clearance of secretions from the airways and minimizing the effects of chronic bronchial infection. Airway secretion clearance techniques (chest physiotherapy) help remove mucus from the airways, and aerosolized DNAse and 7% hypertonic saline, both delivered by nebulizer, decrease the viscosity of mucus. Antibiotic therapy is important in controlling chronic infection [2].
Monitoring pulmonary bacterial flora via airway cultures and providing aggressive therapy with appropriate antibiotics (oral, aerosolized, and IV) help to slow the progression of lung disease. Patients often require 2- to 3-week courses of high dose intravenous antibiotics and aggressive chest physiotherapy to treat pulmonary exacerbations. Antibiotics are selected based on organisms identified by sputum culture. If patients are unable to provide sputum, then a throat culture for CF pathogens can be used to direct therapy. Common infecting organisms are Pseudomonas aeruginosa and Staphylococcus aureus [2].
Exocrine pancreatic insufficiency is treated with enteric- coated pancreatic enzyme capsules, which contain lipase and proteases. Patients with CF are encouraged to follow high-calorie diets, often with the addition of nutritional supplements. Even with optimal pancreatic enzyme replacement, stool losses of fat and protein may be high. Fat should not be withheld from the diet, even when significant steatorrhea exists. Rather, pancreatic enzyme doses should be titrated to optimize fat absorption, although there is a limit to the doses that should be used. Lipase dosages exceeding 2500 U/kg/ meal are contraindicated because they have been associated with fibrosing colonopathy. Fat-soluble vitamins (A, D, E, and K) are recommended, preferably in a water-miscible form. Newborns with meconium ileus may require surgical intervention, but some can be managed with contrast (Gastrografin) enemas [2].
Intestinal obstruction in CF patients beyond the neonatal period is often due to distal intestinal obstruction syndrome (DIOS), which may need to be treated with courses of oral laxatives (polyethylene glycol) or, in more refractory cases, with balanced intestinal lavage solutions. Pancreatic enzyme dosage adjustment, adequate hydration, and dietary fiber may help prevent recurrent episodes. Patients with CF-related diabetes are treated with insulin, primarily to improve nutrition and prevent dehydration, as ketoacidosis is rare. Although transaminase elevation is common in patients with CF, only 1% to 3% of patients have progressive cirrhosis resulting in portal hypertension. Cholestasis is treated with the bile salt ursodeoxycholic acid. Portal hypertension and esophageal varices due to cirrhosis of the liver are managed, when necessary, with portal vein shunting procedures or liver transplantation. Patients with symptomatic sinus disease and nasal polyps may require sinus surgical procedures [2].
Management of CF focuses on minimizing pulmonary complications, promoting growth and development, and facilitating coping and adjustment by the child and family [8].
Chest physiotherapy is often used as an adjunct therapy in respiratory illnesses, but for children with cystic fibrosis it is a critical intervention. Chest physiotherapy involves percussion, vibration, and postural drainage, and either it or another bronchial hygiene therapy must be performed several times a day to assist with mobilization of secretions. For older children and adolescents, the flutter-valve device, positive expiratory pressure therapy, or a high-frequency chest compression vest may also be used. The flutter valve device provides high-frequency oscillation to the airway as the child exhales into a mouthpiece that contains a steel ball. Positive expiratory pressure therapy involves exhaling through a flow resistor, which creates positive expiratory pressure. The cycles of exhalation are repeated until coughing yields expectoration of secretions. The vest airway clearance system provides high-frequency chest wall oscillation to increase airflow velocity to create repetitive cough-like shear forces and to decrease the viscosity of secretions. Breathing exercises are also helpful in promoting mucus clearance. Encourage physical exercise, as it helps to promote mucus secretion as well as provides cardiopulmonary conditioning. Ensure that Pulmozyme is administered, as well as inhaled bronchodilators and antiinflammatory agents if prescribed [8].
Vigorous pulmonary hygiene for mobilization of secretions is critical to prevent infection. Aerosolized antibiotics can be given at home as well as in the hospital. Children with frequent or severe respiratory exacerbations might require lengthy courses of intravenous antibiotics [8].
Pancreatic enzymes must be administered with all meals and snacks to promote adequate digestion and absorption of nutrients. The number of capsules required depends on the extent of pancreatic insufficiency and the amount of food being ingested. The dosage can be adjusted until an adequate growth pattern is established and the number of stools is consistent at one or two per day. Children will need additional enzyme capsules when high-fat foods are being eaten. In the infant or young child, the enzyme capsule can be opened and sprinkled on cereal or applesauce. A Well-balanced, high-calorie, high-protein diet is necessary to ensure adequate growth. Some children require up to 1.5 times the recommended daily allowance of calories for children their age. A number of commercially available nutritional formulas and shakes are available for diet supplementation. In infants, breastfeeding should be continued with enzyme administration. Some infants will require fortification of breast milk or supplementation with high-calorie formulas. Commercially available infant formulas can continue to be used for the formula-fed infant and can be mixed to provide a larger amount of calories if necessary. Supplementation with vitamins A, D, E, and K is necessary. Administer gavage feedings or total parenteral nutrition as prescribed to provide for adequate growth [8].
Cystic fibrosis is a serious chronic illness that requires daily interventions. It can be hard to maintain a schedule that requires pulmonary hygiene several times daily as well as close attention to appropriate diet and enzyme supplementation. Adjusting to the demands that the illness places on the child and family is difficult. Continual adjustments within the family must occur. Children are frequently hospitalized, and this may place an additional strain on the family and its finances. Children with cystic fibrosis may express fear or feelings of isolation, and siblings may be worried or jealous. Encourage the family to lead a normal life through involvement in activities and school attendance during periods of wellness.
Defines QOL as the degree of need and satisfaction within the physical, psychological, social, activity, material, and structural areas. QOL is defined as subjective evaluation of good and satisfactory character of life as a whole [9,10]. QOL is individuals’ perception of their position in life in the context of the culture and value systems in which they live, and in relation to their goals, expectations, standards and concerns [3]. QOL reflects an individual’s overall perception of and satisfaction with how things are in their life [11]. WHO (2006) defines QOL as an individual’s perception of their position in life in the context of the culture and value system in which they live and in relation to their goals, expectations and standards and concerns. It is a broad ranging concept affected in a complex way by the person’s physical health, emotional state, and level of independence, social relationships, and their relationship to their environment. QOL Research Unit, University of Toronto (2006) defines QOL as the degree to which a person enjoys the important possibilities of his/her life. Possibilities result from the opportunities and limitations each person has in his/her life and reflect the interaction of personal and environmental factors. Quality-of-Life Research Center, Denmark (2006) defines QOL as feeling good and being satisfied with things in general. Objective QOL is fulfilling the societal and cultural demands for material wealth, social status, and physical well-being.
1. Physical health: implies energy and fatigue, Pain and discomfort, Sleep and rest (WHO, 1994)
2. Emotional health implies bodily image and appearance, Negative feelings, Positive feelings, Self-esteem, Thinking, learning, memory and concentration. (WHO, 1994)
3. Level of Independence implies mobility, Activities of daily living, Dependence on medicinal substances and medical aids, Work Capacity. (WHO, 1994)
4. Social relationships implies personal relationships, Social support, Sexual activity.
Environment implies financial resources, freedom, physical safety and security, health and social care accessibility and quality home environment Opportunities for acquiring new information and Skills Participation in and opportunities for recreation/leisure Physical environment (pollution/noise/ traffic/climate) Transport (WHO, 1994)
6. Spirituality/Religion/Personal beliefs
This is a cross-sectional, quantitative, descriptive study. Cross sectional study investigate the cause and effect at the same time. This method is used due to limited time and resources.
The study was conducted on children with cystic fibrosis children aged from 6 to 12 who receive health care at the CF Friends center (CFFC).
The study was conducted between the period of 5, 2018 until 10, 2018
All CF children (50 cases) aged 6-12 years who make follow up visits at CFFC
The age-specific cases (6-12 years) were all included in the study. After that the cases were informed by CFFC to fulfill the questionnaire
Thirty six case from the 50 cases were interviewed which made the response rate of 72% which is considered accepted rate.
• Children from 6-12 years old with confirmed diagnosis of CF.
• Male and female.
Cases with CF under the age of 6 years and above 12 years
A Face to face interviewed questionnaire with children and their parents was used in this study, the following area included in questionnaire:
Socio demographic variables including age, sex, educational level, living area, family income.
The Pediatric Quality of Life Inventory generic core (version 4.0) scale Arabic versions [12]. It is a brief, 23-item multidimensional instrument designed by for measuring pediatric health-related quality of life [13].
1. Physical Functioning, 2. Emotional Functioning, 3. Social Functioning, and 4. School Functioning.
For this study, the researcher interview the children and their parents to fulfill the questionnaire. The instructions ask how much of a problem each item has posed over the past month. The response scale uses a 5-point Likert-type format, ranging from 0 (never a problem) to 4 (almost always a problem). The parent was asked about how much of a problem a specific function has been for their child in the past 4 weeks. The response to each item is based on a five-point Likert category, ranging from “never”, “almost never”, “sometimes”, “often”, and “almost always” having a problem.
Data collection was done by face-to-face interview with all children and his/her parents, the average of time to filling questionnaire was 15-20 minutes.
Data analysis was made utilizing (SPSS 20). The researchers utilize many statistical tools such as Frequencies and Percentile, Alpha- Cronbach’s Test, Pearson correlation coefficients, Chi square, t test and one way ANOVA. The test statistics for normality distribution of the study was done. Two tests for normality were run, we use the Shapiro-Wilk test, otherwise, the KolmogorovSmirnov test was used. And the p-value is > 0.050 which mean that the data comes from a normal distribution.
Reliability refers to the consistency of a measure. A test is considered reliable if we get the same result repeatedly. To measure the internal consistency of the instruments, the researcher conducted “Cronbach alpha coefficient”. Cronbach’s alpha reliability coefficient normally ranges between 0 and 1. However, there is actually no lower limit to the coefficient. The closer Cronbach’s alpha coefficient is to 1.0, the greater the internal consistency of the items in the scale. Provide the following rules of thumb: If the Cronbach’s alpha coefficient > 0.9 = Excellent, - > 0.8 = Good, - > 0.7 = Acceptable, - > 0.6 = Questionable, - > 0.5 = Poor, and - < 0.5 = Unacceptable [14]. Cronbach’s Alpha equation was used to compute the reliability coefficient, it was 0.833. It is considered as good reliability coefficient. Table 2 shows the reliability estimated of the domains of the study
Table 2: Reliability for study domains| Domains | # of cases | # of items | Cronbach's Alpha |
|---|---|---|---|
| Physical Functions |
36 | 8 | 0.694 |
| Emotional Functions |
36 | 5 | 0.726 |
| Social Functions | 36 | 5 | 0.505 |
| School Functions | 36 | 5 | 0.434 |
| Overall Functions | 36 | 23 | 0.833 |
• An official approval was obtained from the nursing and health sciences department at UCAS before conducting the study. • Approval from CFFC was also obtained to facilitate data collection. • Informed consent from parents was obtained to gain acceptance and guarantee of confidentiality was assured
• Lack of national statistic regarding CF in Palestine especially in GS. • Limited time for study urge the researcher to use cross sectional design rather than other designs such as case control study • Long time for data collection because of low socioeconomic status for the patient which delay questionnaire fulling when patient come to take care from CFFC.
Figure 2 illustrates the gender of the study population (male = 61.1%, female = 38.9%).
Figure 2: Distribution of Cases by Gender
Table 3 shows that the age of the study population ranged between 5 to 13 years old with mean of 9.4±2.1. The distribution of the two groups represented by percentage was as follows 47.2% for those who are < 9years and 52.8% for >9 years.
Table 3: Distribution of the study population according to age| Age | Number | Percent |
|---|---|---|
| < 9 years | 17 | 47.2 |
| >9 years | 19 | 52.8 |
| Age mean ± SD | 9.4 ± 2.1 | |
Figure 3 shows that 41.7% of the study population from Gaza, 25.0% from middle zone, 13.9% from Rafah, 11.1% from Khanyounis and 8.3% from North of Gaza.
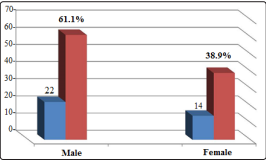
Figure 3: Distribution of cases according to geographical location of residence
Figure 4 illustrates that 55.6% of the study population live in city, 33.3% in camps and 11.1% in villages.
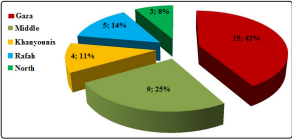
Figure 4: Distribution of cases according to type of residence location
Housing classification was 38.9%, 33.3% and 27.8 % for property house, renting house and family house respectively (figure 5).
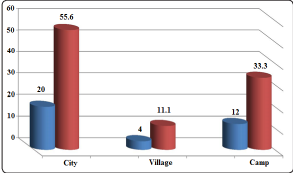
Figure 5: Distribution of cases according to type of housing
The results show that most of cases’ fathers without work (47.2%), (27.8%) work as worker while (25.0%) were employee (figure 6).
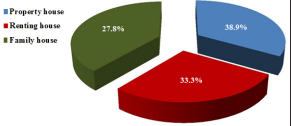
Figure 6: Distribution of cases according to fathers’ job
Indeed, most of the fathers with low educational level 38.9%, 27.8% and 13.9% for secondary, preparatory and primary education level while 19.4% for university degree (figure 7).
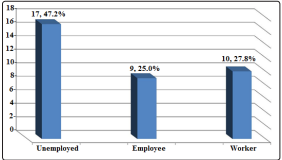
Figure 7: Distribution of cases according to fathers’ educational level
On the other side figure 8 Show that 91.7% of study population mothers work as housewife, 5.6% employee and 2.8% as worker. The highest level of education for mothers was secondary level with 41.7%, 27.8% for preparatory, 16.7% for university and 13.9% for primary (figure 9).
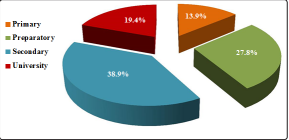
Figure 8: Distribution of cases according to mothers’ job
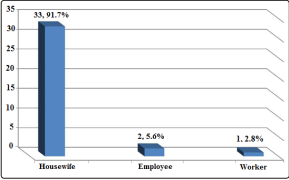
Figure 9: Distribution of mothers according to level of education
Figure 10 illustrates the level of family income 77.8% of them illustrated it was less than 1200 NIS, 16.7% from 1201 to 2000 NIS and 5.6% up of 2001 NIS.
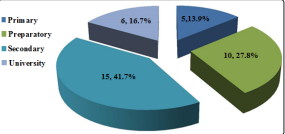
Figure 10: Distribution of cases according to family income
Figure 11 Show that 61.1% of the children being taught in UNRWA schools, 25% in governmental school and 13.9% in special schools.
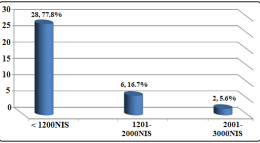
Figure 11: Distribution of cases according to type of school
| Disease history | Number (n=36) | Percent (%) |
|---|---|---|
| Is there another family member suffer from this disease | ||
| Yes | 22 | 61.1 |
| No | 14 | 38.9 |
| If yes number of member | ||
| One | 14 | 38.9 |
| Two | 5 | 13.9 |
| Three | 2 | 5.6 |
| Five | 1 | 2.8 |
| If any of family member died from this disease: | ||
| Yes | 14 | 38.9 |
| No | 22 | 61.1 |
| Health center for follow up | ||
| Al Rantisi hospital | 31 | 86.2 |
| Al Shifa hospital | 2 | 5.5 |
| others centers | 3 | 8.3 |
| Regularly take of Creon therapy: | ||
| Yes | 32 | 88.8 |
| No | 2 | 5.6 |
| Sometimes | 2 | 5.6 |
| Regular physiotherapy sessions | ||
| Yes | 2 | 5.6 |
| No | 34 | 94.4 |
Family history with disease presented above in table 4 Which show 61.1% of the population study mentioned that there another member of family suffering from the same disease and 38.9% did not. And these 61.1% classify as 38.9% had one other member, 13.9% had two, 5.6% had three and 2.8% had one. 38.9% of all study population had family member died by this disease. All our study population mentioned that they follow up the disease with regularly time at one of health center, 86.1 % in AL Rantisy hospital, 5.5% in AlShifa hospital. The results of the study showed that there is a high commitment to take treatment Creon, where the proportion of committed was 88.9% usually, 5.6% sometimes and 5.6% none. 94.4% of the study population did not take physiotherapy.
Figure 12 list the other disease associated with cystic fibrosis that our cases suffer from it. Whereas the most common disease associated with them with high percent was Respiratory problem with 43.2%, 38.3% had gastrointestinal disease, 14.8% had heart disease and 3.7% had Diabetes Mellitus
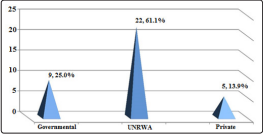
Figure 12: Distribution of diseases associated with CF
The following table looks at four main domains that demonstrate the frequency of quality life rate of the study samples, these results were classified according to five categories (never, rarely, sometimes, frequently and all time).
Table 5: Distribution of quality of life according to the four functions| Quality of life domain | # of items | Mean | SD | Percent |
|---|---|---|---|---|
| Physical Functions | 8 | 2.76 | 0.50 | 55.2 |
| Emotional Functions | 5 | 2.44 | 0.55 | 48.8 |
| Social Functions | 5 | 3.08 | 0.50 | 61.6 |
| School Functions | 5 | 2.53 | 0.45 | 50.6 |
| Overall Functions | 23 | 2.75 | 0.40 | 55.0 |
Table 5 shows that the overall functions that reflect the quality of life among children with CF is relatively low as overall mean of functions was 2.75 or the patients perceive the quality of their life with a 55%. The social functions was the highest (mean: 3.08, 61.6%), then physical functions, school function and emotional functions respectively.
As illustrated in table 6 about 77.8% of the child sometimes could walk for more than ten minutes while 11.1%, 5.6% and 2.8% for all time, never, rarely and frequently respectively. 55.6% of children could run sometimes, 19.4% rarely, 13.9% frequently, 8.3% never and 2.8% all time. 69.4% of study population sometimes could participate in sports activities or exercises, other percent were 16.7% for rarely, 5.6% for all time and never while 2.8% for frequently.52.8% were rarely, 19.4% were never, 13.9% were sometimes and frequently could carry something heavy. 41.7% sometimes, 30.6% rarely, 11.1% frequently and 8.3% all time and never could shower themselves. 44.4% sometimes could perform duties like picking up their toys, 22.2% frequently and rarely while 5.6% were all time and never could do that. 41.7% sometime suffered from aches and wounds, 38.9% frequently, 8.3% rarely and all-time while 2.8% never suffer like that. The percent to feel low power level were 55.6%, 30.6%, 8.3% and 5.6% for sometimes, frequently, rarely and all time respectively.
Table 6: Distribution of cases according to physical functions| Physical functions | Never | Rarely | Some times | Frequently | All time |
|---|---|---|---|---|---|
| I can walk for more than ten minutes | 2 (5.6) | 1(2.8) | 28(77.8) | 1(2.8) | 4(11.1) |
| I can run | (8.3) | 7(19.4) | 20(55.6) | 5(13..9) | 1(2.8) |
| I can participate in sports activities or exercises | 2 (5.6) | 6(16.7) | 25(69.4) | 1(2.8) | 2(5.6) |
| I can carry something heavy | 7 (19.4) | 19(52.8) | 5(13..9) | 5(13..9) | 0 (0.0) |
| I can shower myself | 3 (8.3) | 11(30.6) | 15(41.7) | 4(11.1) | 3 (8.3) |
| I can perform duties like picking up his / her toys | 2 (5.6) | 8(22.2) | 16(44.4) | 8(22.2) | 2(5.6) |
| I can suffer from aches and wounds | 1 (2.8) | 3 (8.3) | 15(41.7) | 14(38.9) | 3 (8.3) |
| Low power level | 0 (0.0) | 3(8.3) | 20(55.6) | 11(30.6) | 2(5.6) |
58.2% of the child sometimes were feel fear or terror while 27.8%, 11.1% and 2.8% for frequently, all time and never respectively. 47.2% of children feel sad or unhappy sometimes, 36.1% frequently, 13.9% all time and 2.8% never. 55.6% of study population sometimes feel angry, other percent were 30.6% for frequently, 8.3% for all time, 2.8% for rarely and never. For had trouble sleeping 50.0% were frequently, 33.3% were sometimes, 11.1% were all time and 5.6% rarely.44.4% of Childs sometimes concerned about what will happen to them, 33.3% frequently, 19.4% all time and 2.8% rarely.
Table 7: Distribution of cases according to emotional functions.| Emotional functions | Never | Rarely | Some times | Frequently | All time |
|---|---|---|---|---|---|
| I feel fear or terror | 1(2.8) | 0(0.0) | 21(58.2) | 10(27.8) | 4(11.1) |
| I feel sad or unhappy | 0(0.0) | 1(2.8) | 17(47.2) | 13(36.1) | 5(13.9) |
| I feel angry | 1(2.8) | 1(2.8) | 20(55.6) | 11(30.6) | 3(8.3) |
| I have trouble sleeping | 0(0.0) | 2(5.6) | 12(33.3) | 18(50.0) | 4(11.1) |
| I am concerned about what will happen to | 0(0.0) | 1(2.8) | 16(44.4) | 12(33.3) | 7(19.4) |
55.6% of study population sometimes Engage with other children, other percents were 25.0% for frequently, 8.3% for rarely, 5.6% for never and all time. About feeling that Other children do not want them companion 61.1% were sometime, 16.7% were frequently, 11.1% were never, 8.3% rarely and 2.8% rarely.55.6% of Childs feel sometimes Other children provoke them, 19.4% rarely, 11.1% frequently, 8.3% rarely and 5.6 all-time feel that. The results showed that the highest rate of feeling among the children of the study that they could not do what their peers do was sometimes at a percentage level 63.9%, 19.4% for frequently, 11.1% for rarely and 2.8% for all time and never. 52.8% sometime could keep children playing, 22.2% frequently, 16.7% rarely 5.6% all time and 2.8% never did that.
Table 8: Distribution of cases according to social functions| Social functions | Never | Rarely | Some times | Frequently | All time |
|---|---|---|---|---|---|
| Engage with other children | 2(5.6) | 3(8.3) | 20(55.6) | 9(25.0) | 2(5.6) |
| Other children do not want my companion | 4(11.1) | 3(8.3) | 22(61.1) | 6(16.7) | 1(2.8) |
| Other children provoke me | 3(8.3) | 7(19.4) | 20(55.6) | 4(11.1) | 2(5.6) |
| I cannot do what my peers do | 1(2.8) | 4(11.1) | 23(63.9) | 7(19.4) | 1(2.8) |
| I can keep children playing | 1(2.8) | 6(16.7) | 19(52.8) | 8(22.2) | 2(5.6) |
47.2% sometimes observed during Quotas, 30.6% frequently, 11.1% all time, 8.3% rarely and 2.8% never observed. 47.2% of study children frequently forget many things, 27.8% forget sometimes, 13.9% rarely, 8.3% all time and 2.8% never forget. 58.3% sometimes Kept others in school activities, 22.2% frequently, 8.3% all time, 5.6% rarely and 5.6% never do that. 47.2% and 55.6% frequently went out of school by illness and to see a doctor, 33.3% and 41.7% all time went out of school and 19.7% and 2.8% sometime. Respectively.
Table 9: Distribution of cases according to school functions| Social functions | Never | Rarely | Some times | Frequently | All time |
|---|---|---|---|---|---|
| Observe during Quotas | 1(2.8) | 3(8.3) | 17(47.2) | 11(30.6) | 4(11.1) |
| Forget many things | 1(2.8) | 5(13.9) | 10(27.8) | 17(47.2) | 3(8.3) |
| Keep others in school activities | 2(5.6) | 2(5.6) | 21(58.3) | 8(22.2) | 3(8.3) |
| I’m out of school because of illness | 0(0.0) | 0(0.0) | 7(19.4) | 17(47.2) | 12(33.3) |
| I go out of school to go to the doctor or | 0(0.0) | 0(0.0) | 1(2.8) | 20(55.6) | 15(41.7) |
The result presented below show that no significant difference in QOL between socio-demographic data (p-value > 0.05) except the difference for QOL between age groups (p-value=0.001). Children older than nine years old (2.95±0.3) have QOL more than children under nine years of age (2.53±0.4) and this difference are statistically significant as (P value= 0.02 < 0.05). It is also clear that QOL in males are more than female but this difference was not statistically significant. The residents of the middle zone of the study samples were higher than their counterparts in the other areas and had the lowest rate of quality of life among the residents of the Rafah area. For house status the table also shows that the urban population of the study samples is higher than the inhabitants of the villages and camps. As for individuals who live in homes owned by them, they are higher in quality of life than those who live in prostitution or with their families. No difference among fathers employment. While the study showed that parents who have a university degree of their children enjoy a quality of life from children to less parents in their education. Children for mothers are employed employees with higher quality of life than children of mothers, housewives or workers. Low-income families have lower quality of life for their children than high-income earners. Children receiving UNRWA education are higher in quality of life than children who receive their education in private or government schools.
Table 10: Relationship between QOL and socio-demographic variables| Socio-demographic | Mean ±SD | test | p-value |
|---|---|---|---|
| Gender | |||
| Male (22) | 2.8±0.4 | T=1.125 | 0.269 |
| Female (14) | 2.7±0.4 | ||
| Location | |||
| Gaza | 2.8±0.3 | F= 0.815 | 0.525 |
| Middle | 2.9±0.5 | ||
| Khanyounis | 2.6±0.4 | ||
| Rafah | 2.5±0.5 | ||
| North | 2.8±0.1 | ||
| Housing status | |||
| City | 2.8±0.4 | F= 0.718 | 0.495 |
| Village | 2.6±0.7 | ||
| Camp | 2.7±0.3 | ||
| House classification | |||
| property house | 2.9±0.6 | F= 1.444 | 0.251 |
| Renting house | 2.8±0.2 | ||
| Family house | 2.6±0.3 | ||
| Father’s job | |||
| Unemployed | 2.8±0.4 | F=0.123 | 0.885 |
| Employee | 2.8±0.6 | ||
| Worker | 2.7±0.2 | ||
| Father’s education level | |||
| Primary | 2.6±0.4 | F=0.429 | 0.733 |
| Preparatory | 2.7±0.5 | ||
| Secondary | 2.8±0.3 | ||
| University | 2.8±0.5 | ||
The following tables show the rank of the questions of the axes according to their impact on the quality of life in the study sample. Grade 3 has been adopted, which sometimes means the approved rating to see the significant difference (p-value < 0.05) between sample study. When the result is less than that, the signal (t) is negative and when it is higher than 3 the value of t is positive.
By looking at the following table shows that the physical functions of sample study is low and with significant difference (p-value =0.007). This was influenced by the performance of the study members in the following activities; carry something heavy (p-value=0.000) (rank=7), suffer from aches and wounds (p-value =0.007) (rank=6), low power level (p-value=0.008) (rank=5). While the highest physical performance rank with no significant difference (p-value > 0.05) was walk for more than ten minutes, perform duties like picking up his / her toys, participate in sports activities or exercises, running and shower myself.
| Physical functions | Mean ±SD | t-test | p-value | Rank |
|---|---|---|---|---|
| I can walk for more than ten minutes | 3.1±0.86 | 0.780 | 0.441 | 1 |
| I can run | 2.8±0.88 | -1.139 | 0.263 | 4 |
| I can participate in sports activities or exercises | 2.9±0.80 | -1.044 | 0.304 | 3 |
| I can carry something heavy | 2.2± 0.93 | -5.022 | 0.000 | 7 |
| I can shower myself | 2.8±1.0 | -1.125 | 0.268 | 4 |
| I can perform duties like picking up his / her toys | 3.0±0.96 | 0.000 | 1.000 | 2 |
| I can suffer from aches and wounds | 2.6±0.87 | -2.860 | 0.007 | 6 |
| Low power level | 2.7±0.72 | -2.789 | 0.008 | 5 |
| Total | 2.8±0.40 | -2.878 | 0.007 |
By looking at the following table shows that the emotional performance of sample study is low (mean=2.4±0.55) and with significant difference (p-value=0.000). This was influenced by the performance of the study members in the all emotional feelings, and this gives them a sense of anxiety and fear.
Table 12: Ranking of questions of the emotional performance affecting on QOL for the study population| Emotional Function | Mean ±SD | t-test | p-value | Rank |
|---|---|---|---|---|
| I feel fear or terror | 2.6±0.81 | -3.298 | 0.002 | 1 |
| I feel sad or unhappy | 2.4±0.77 | -4.785 | 0.000 | 2 |
| I feel angry | 2.6±0.80 | -2.907 | 0.006 | 1 |
| I have trouble sleeping | 2.3±0.76 | -5.292 | 0.000 | 3 |
| I am concerned about what will happen to me | 2.3±0.82 | -5.070 | 0.000 | 3 |
| Total | 2.4±0.55 | -6.157 | 0.000 |
This axis show good effect on quality life rate through high mean 3.1±0.50 and this become from high performance in questions like Engage with other children (rank=1, p-value=0.263), Other children do not want my companion (rank=2, p-value=0.585), Other children provoke me (rank=2, p-value=0.377), can keep children playing (rank=2, p-value=0.441), the lowest performance was through cannot do what their peers do (rank=3, p-value=0.499).
Table 13: Ranking of questions of the social functions affecting on QLR for the study population| QOL domains | Mean ±SD | t-test | p-value | Rank |
|---|---|---|---|---|
| Physical functions | 2.8±0.40 | -2.878 | 0.007 | 2 |
| Emotional functions | 2.4±0.55 | -6.157 | 0.000 | 4 |
| Social functions | 3.1±0.50 | 1.000 | 0.324 | 1 |
| School functions | 2.5±0.45 | -6.277 | 0.000 | 3 |
| Total | 2.8±0.40 | -3.714 | 0.001 |
Table below shows that the school performance of sample study is low and with significant difference (p-value=0.007). This was influenced by the performance of the study members in the following activities; go out of school to go to the doctor or hospital (p-value=0.000) (rank=5), out of school because of illness (p-value=0.000) (rank=4), Forget many things (p-value=0.007) (rank=5). while the highest school performance rank with significant difference (p-value=0.014) was Observe during Quotas (rank=1), Keep others in school activities (rank=2, p-value=0.134).
Table 14: Ranking of questions of the school functions affecting on QLR for the study population| School Function | Mean ±SD | t-test | p-value | Rank |
|---|---|---|---|---|
| Observe during Quotas | 3.4±0.90 | 2.583 | 0.014 | 1 |
| Forget many things | 2.6±0.94 | -2.839 | 0.007 | 3 |
| Keep others in school activities | 3.2±0.90 | 1.485 | 0.147 | 2 |
| I'm out of school because of illness | 1.9±0.72 | -9.449 | 0.000 | 4 |
| I go out of school to go to the doctor or hospital | 1.6±0.55 | -15.174 | 0.000 | 5 |
| Total | 2.5±0.45 | -6.277 | 0.000 |
This relationship is shown in the following table where the social functions in the sample of the study was the highest (rank=1, p-value=0.324) followed by physical functions (rank=2, p-value=0.007) and then the school functions (rank=3, p-value= 0.000) and lowest rate the quality of life is emotional functions (rank=4, p-value=0.000) and all domains was effect negatively significant on QOL except social functions.
Table 15: Ranking of domains of the QLR for the study population| QOL domains | Mean ±SD | t-test | p-value | Rank |
|---|---|---|---|---|
| Physical functions | 2.8±0.40 | -2.878 | 0.007 | 2 |
| Emotional functions | 2.4±0.55 | -6.157 | 0.000 | 4 |
| Social functions | 3.1±0.50 | 1.000 | 0.324 | 1 |
| School functions | 2.5±0.45 | -6.277 | 0.000 | 3 |
| Total | 2.8±0.40 | -3.714 | 0.001 |
The relationship between QOL and four domains is demonstrated in Table 14. In general the table shows that there is a positive correlation with a highly significant difference between QOL and the domains and between domains with each other. Social performance was high correlated with school performance (r = 0.706) while the lowest correlation was between physical and school performance with no significant (p-value =0.065).
Table 16: The Correlation between QLR and Axles among study population| Physical function | Emotional function | Social function | School function | ||
|---|---|---|---|---|---|
| QOL domains | Person correlation | 0.727 | 0.708 | 0.838 | 0.779 |
| p-value | 0.000 | 0.000 | 0.000 | 0.000 | |
| Physical function | Person correlation | 1/td> | 0.529 | 0.591 | 0.311 |
| p-value | 0.000 | 0.000 | 0.065 | ||
| Emotional function | Person correlation | 0.529 | 1 | 0.331 | 0.377 |
| p-value | 0.000 | 0.049 | 0.023 | ||
| Social function | Person correlation | 0.591 | 0.331 | 1 | 0.706 |
| p-value | 0.000 | 0.049 | 0.000 | ||
| School function | Person correlation | 0.311 | 0.377 | 0.706 | 1 |
| p-value | 0.065 | 0.023 | 0.000 |
The aim of this study was to assess the QOL among children with CF in Gaza strip. The study was descriptive, analytical and cross sectional one. The total number of the study population was 36 patients who have attended to CFFC. About 61% of the study population were males and 39% were females. Approximately 47% of them were less than 9 years and 53% were more than 9 years. About 41.7% of the study population from Gaza, 25.0% from middle zone, 13.9% from Rafah, 11.1% from Khanyounis and 8.3% from North of Gaza. Housing classification was 38.9%, 33.3% and 27.8 % for property house, renting house and family house respectively. Most of their parents had low educational levels and the majority of them were unemployed and have a monthly income less than 1200 NIS. About 61% of them have another sibling with CF. the majority of them receive Creon at a regular basis. The most common disease associated with them was Respiratory problem with 43.2%, 38.3% had gastrointestinal disease, 14.8% had heart disease and 3.7% had Diabetes Mellitus. The overall perception of the children regarding QOL was low (55%). The social functions was the highest (61.6%), physical functions (55.2%), school function (50.6%), and emotional function (48.8%).
The result presented below show that no significant difference in QOL between socio-demographic data (p-value > 0.05) except the difference for QOL between age groups) p-value =0.001). Children older than 9 years old (2.95±0.3) have QOL more than children under nine years of age (2.53±0.4) and this difference was statistically significant as (P value = 0.02 < 0.05). It is also clear that QOL in males are more than female but this difference was not statistically significant.
There is a positive correlation with a highly significant difference between QOL and the 4 domains and between domains with each other. Social performance was high correlated with school performance (r = 0.706) while the lowest correlation was between physical and school performance with no significant (p-value =0.065).
• Programs to enhance the QOL for children with CF are
important to implement which focus on the four domain
(physical, social, emotional and school)
• Emotional and emotional support are essential in caring with
CF children as emotional function was the lower perceived
domain
• Community based therapy for primary, secondary and
rehabilitative therapy should be strengthened in GS to provide
holistic care for children with CF
• More concern with CF children should be prioritized in
schools to improve the school performance
• Using other study designs to compare QOL for CF children
and other well children
• Assessment of level of depression and anxiety and its
relationship with QOL.
• The effect of psychological program among children with CF
To all healthcare worker who spend their times in serving patients
and alleviation of their suffering.
The Cystic Fibrosis Friend Center and operative team
Special thanks to the Cystic Fibrosis Friend Center and operative team for their help, coordination and collaboration.