Author(s): Fondzenyuy Vitalis Fonfo*, Kengni Lucas and Njuedou Kupa
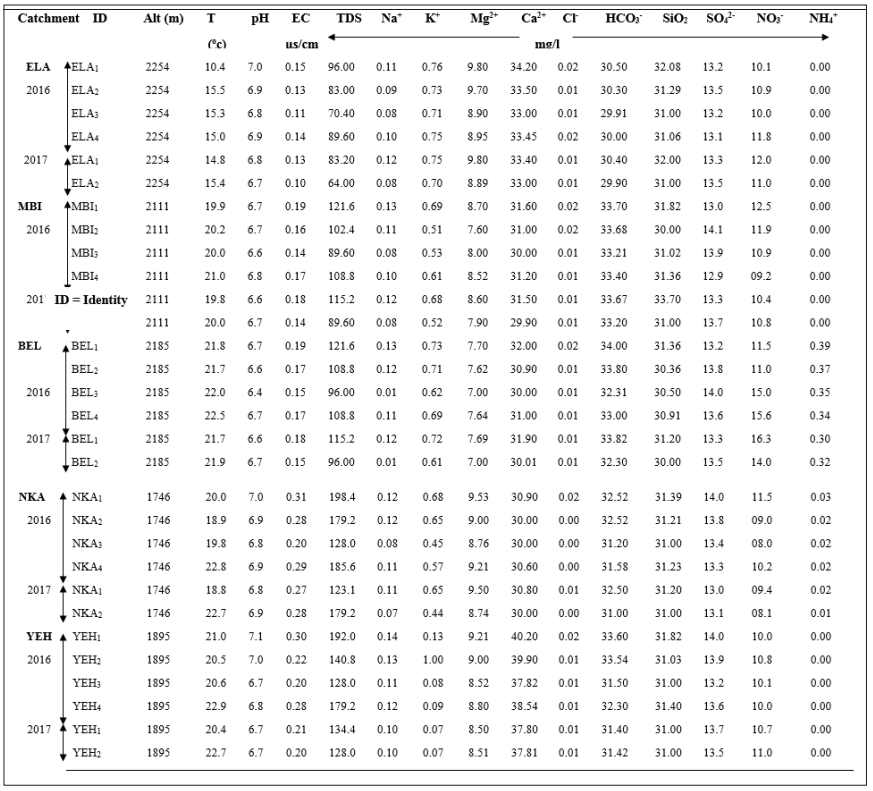
Principal Component Analysis (PCA) helps in interpreting data and simplifies the complexity in high-dimensional or multivariate data while retaining trends and patterns. This is done by transforming the data into fewer dimensions that act as summaries of characteristics. The multivariate or high-dimensional data was prevalent in the physico- chemical analysis of samples from some water catchments in Bui division, North West Region of Cameroon. The water catchments were in Elak (ELA) Oku subdision, Mbiame (MBI) Mbven subdivision, Belem (BEL) Nkum subdivision, Nkar (NKA) Jakiri subdivision and YEH in Kumbo subdivision. This type of data presents several challenges that PCA mitigates. With the application of SPSS (Software Package for Social Sciences) it transformed the multivariables obtained in the physico-chemical analysis from the water catchments into a correlation matrix either Pearson’s or Spearman’s matrix. In this work I Pearson’s correlation matrix was used. It reduced the data by geometrically projecting onto lower dimensions in correlation circles.
Pearson’s correlation matrix for the water catchments between the variables had a medium or moderate correlation with most of the coefficient values between -/+ 0.39 and +/- 0.49. Nonetheless, some strong positive correlations existed between Mg2+ / pH, TDS / EC, HCO3-/ T°C, and SiO2/ Mg2+, while a strong negative correlation existed between, Mg2+/ T°C, and Mg2+/ NO3-. Generally, a weak correlation was observed between most of the variables.
Eighty-seven variables were correlated from the catchments with 51 having a positive correlation, whereas 36 were negative. Positive correlation values indicated a common source with the ions evolving concomitantly by similar weathering processes or inputs from a common source. This concomitant correlation was expressed between Ca2+ and HCO3- within the catchments. The negative values revealed that the ions evolve in an antagonistic manner. Consequently, in the water catchments, 58.62 % of the variables had a positive correlation while. 42.48 % had a negative correlation with antagonistic behaviour.
This work had as objective; an evaluation and monitoring of the origin of the ions and other variables within water catchments in Bui division with establishment of a correlation between the analysed variables. Prior to this study, no recorded works were available for this evaluation, presenting a data vacuum intended to be filled with this work.
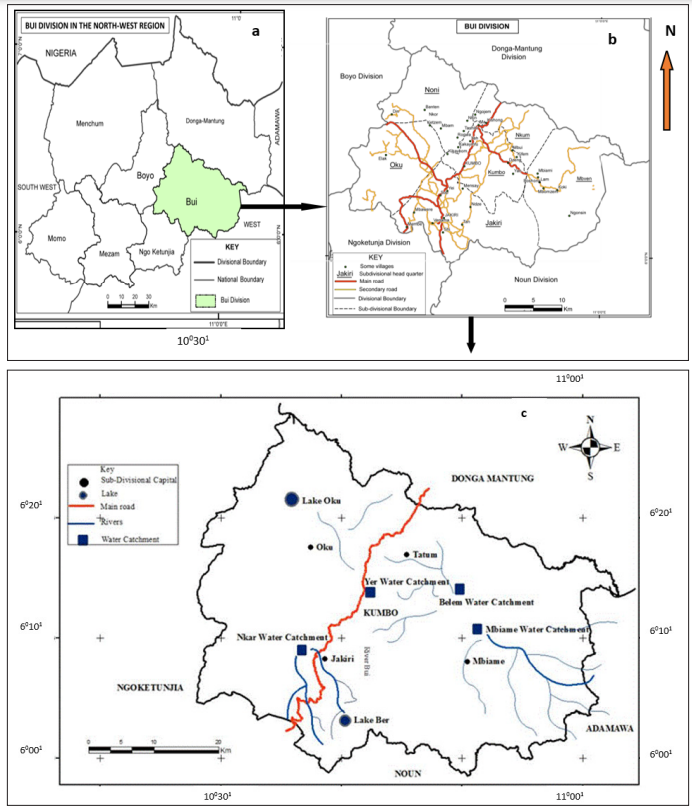
Figure 1: Position of study area: (a) The NWR (b) Bui in the NWR (c) Location of sites
| Water point | Time | Date | Rock type | Sample/Reference |
|---|---|---|---|---|
| Elak (Water tank) | 8.15 am | 11-02-16 | Trachyte | ELA 1 |
| 8.30 am | 31-05-16 | Trachyte | ELA 2 | |
| 8.20 am | 06-08-16 | Trachyte | ELA 3 | |
| 8.45 am | 18-11-16 | Trachyte | ELA 4 | |
| Mbiame catchment | 11.20 am | 11-02-16 | Basalt | MBI 1 |
| 11.46 am | 31-05-16 | Basalt | MBI 2 | |
| 11.40 am | 06-08-16 | Basalt | MBI 3 | |
| 11.52 am | 18-11-16 | Basalt | MBI 4 | |
| Belem catchment | 12.31 pm | 11-02-16 | Basalt | BEL 1 |
| 12.50 pm | 31-05-16 | Basalt | BEL 2 | |
| 12.55 pm | 06-08-16 | Basalt | BEL 3 | |
| 13.02 pm | 18-11-16 | Basalt | BEL 4 | |
| Nkar (catchment) | 14.03 pm | 11-02-16 | Basalt | NKA 1 |
| 14.15 pm | 31-05-16 | Basalt | NKA 2 | |
| 14.25 pm | 06-08-16 | Basalt | NKA 3 | |
| 14.51 pm | 18-11-16 | Basalt | NKA 4 | |
| Yeh (catchment) | 15.30 pm | 11-02-16 | Basalt | YEH 1 |
| 15.45 pm | 31-05-16 | Basalt | YEH 2 | |
| 15.55 pm | 06-08-16 | Basalt | YEH 3 | |
| 16.00 pm | 18-11-16 | Basalt | YEH 4 |
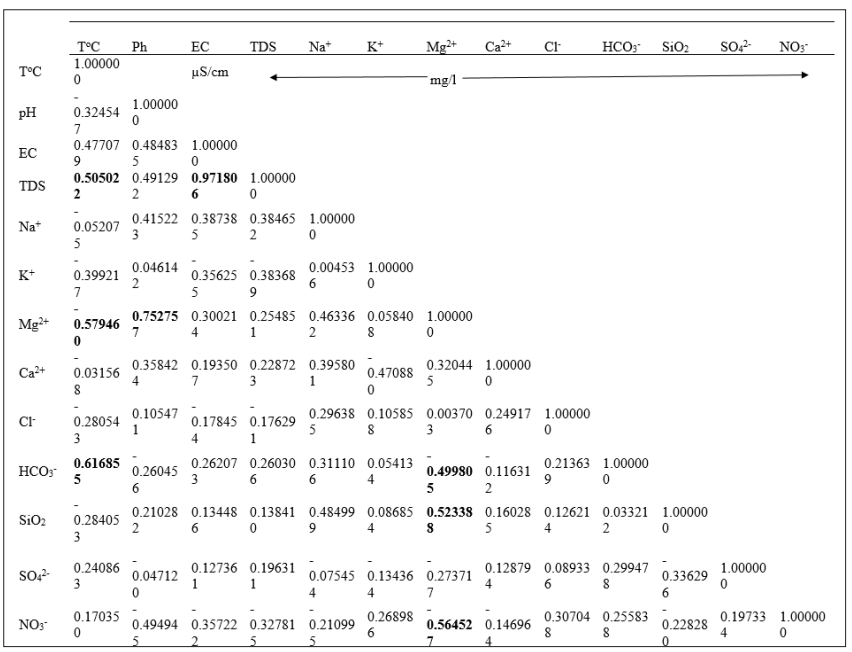
The Principal Components Analysis for Catchments Pearson?s correlation matrix between the variables had a medium or moderate correlation with most of the coefficient values between -/+ 0.39 and +/- 0.49. Nonetheless, some strong positive correlations indicated in bold existed between Mg2+ / pH, TDS / EC, HCO3-/ ToC, and SiO2/ Mg2+, while a strong negative correlation existed between, Mg2+/ ToC, and Mg2+/ NO3-. Generally, a weak correlation was observed between most of the variables.
Eighty-seven variables were correlated from the catchments with 51 having a positive correlation, whereas 36 were negative. Positive correlation values indicated a common source with the ions evolving concomitantly by similar weathering processes or inputs from a common source. This concomitant correlation was expressed between Ca2+ and HCO3- within the catchments. The negative values revealed that the ions evolve in an antagonistic manner. Consequently, in the water catchments, 58.62 % of the variables had a positive correlation while. 42.48 % had a negative correlation with antagonistic behaviour. pH and EC had a positive correlation indicating a constant and predominant source of mineralization within the catchments. Equally, all the pairs of exchangeable bases; Na+-Ca2+; Na+- Mg2+; Na+- K+, had positive correlations which indicated that; increasing or decreasing of the concentration of cations was probably a combination of anthropogenic inputs and other processes governed by chemical reactions. Table 4 gave the contribution the variables in determination of the principal factors. Tables 5 (a) and 5 (b), gave the variables and factors respectively that led to a determination of their percentage contribution in a correlation circle on to which the variables were projected. Fig.2 gave the proper values and total % variance for catchments. The projections were on a reduced space with two principal components; Fig. 3. In the catchments, contributions were from 13 factors. Consequently, projections were made in many reduced spaces each with its two components, and the circle with the highest percentage contribution from the factors was considered most significant; F1 + F2 = 51.93%, with F1= 29.01% and F2=22.92% in Fig. 3 (a). All the others had lower percentages. From the corresponding graph ; Fig. 2, five factors that expressed 84.29 % of factors from catchments were used in the construction of the correlation circles, based on Kaiser?s criteria [12]. A representation of the results in a reduced space for all the variables from the catchments revealed a low dispersion and variability of the chemical composition of the water. As evident in the projection space in Fig.3, the low dispersal of the variables in space had no particular trend or pattern.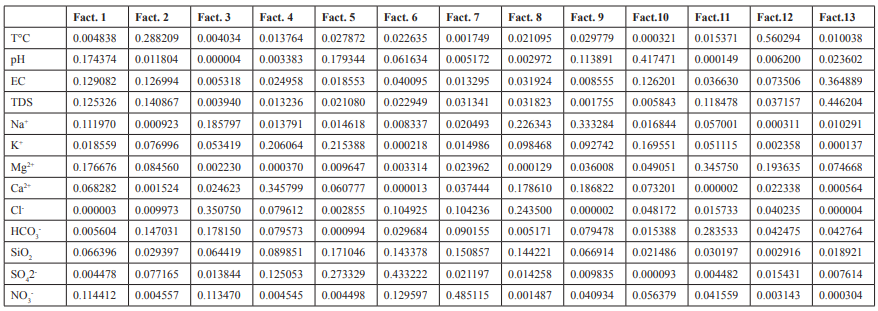
| Proper value | Total % variance | Cumulated Proper value | Cumulated % | |
|---|---|---|---|---|
| 1 | 3.771860 | 29.01431 | 3.77186 | 29.0143 |
| 2 | 2.979952 | 22.92271 | 6.75181 | 51.9370 |
| 3 | 1.791871 | 13.78362 | 8.54368 | 65.7206 |
| 4 | 1.373240 | 10.56339 | 9.91692 | 76.2840 |
| 5 | 1.041056 | 8.00812 | 10.95798 | 84.2922 |
| 6 | 0.579713 | 4.45933 | 11.53769 | 88.7515 |
| 7 | 0.504552 | 3.88117 | 12.04224 | 92.6326 |
| 8 | 0.439804 | 3.38311 | 3.38311 | 96.0158 |
| 9 | 0.261013 | 2.00779 | 12.74306 | 98.0236 |
| 10 | 0.109472 | 0.84209 | 12.85253 | 98.8656 |
| 11 | 0.072676 | 0.55904 | 12.92521 | 99.4247 |
| 12 | 0.063236 | 0.48643 | 12.98845 | 99.9111 |
| 13 | 0.011555 | 0.08888 | 13.00000 | 100.0000 |
| Variables | Fact. 1 | Fact. 2 | Fact. 3 | Fact. 4 | Fact. 5 |
|---|---|---|---|---|---|
| T°C | 0.004838 | 0.288209 | 0.004034 | 0.013764 | 0.013764 |
| pH | 0.174374 | 0.011804 | 0.000004 | 0.003383 | 0.179344 |
| EC | 0.129082 | 0.126994 | 0.005318 | 0.024958 | 0.018553 |
| TDS | 0.125326 | 0.140867 | 0.003940 | 0.013236 | 0.021080 |
| Na + | 0.111970 | 0.000923 | 0.185797 | 0.013791 | 0.014618 |
| K + | 0.018559 | 0.076996 | 0.053419 | 0.206064 | 0.215388 |
| Mg2 + | 0.176676 | 0.084560 | 0.002230 | 0.000370 | 0.009647 |
| Ca2 + | 0.068282 | 0.001524 | 0.024623 | 0.345799 | 0.060777 |
| Cl- | 0.000003 | 0.009973 | 0.350750 | 0.079612 | 0.002855 |
| HCO 3 | 0.005604 | 0.147031 | 0.178150 | 0.079573 | 0.000994 |
| SiO 2 | 0.066396 | 0.029397 | 0.064419 | 0.089851 | 0.171046 |
| SO 4 2- | 0.004478 | 0.077165 | 0.013844 | 0.125053 | 0.125053 |
| NO 3 - | 0.114412 | 0.004557 | 0.113470 | 0.004545 | 0.004498 |
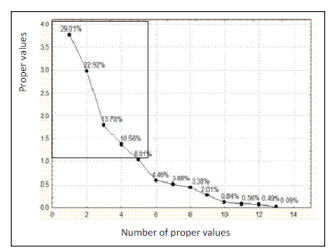
Figure 2: Proper values & Total % variance for catchments
Principal component analysis enabled us to see the five factors that permitted to express 84.3 % of the total variation of the data. Factors 1 and 2 predominantly expressed 51.93 % evaluation of the relation between variables. In the correlation circles for the catchments the bold values in Table 4 (b) represented the contribution of the variables in the definition of each factor, within an acceptable correlation value above 0.5 for the variables. Factor 1 had the variables Mg2+, pH, TDS, EC and Na+ strongly correlated, with positive values above 0.6 while Ca2+ and SiO2 equally showed a correlation with value 0.5. The positive correlations revealed that in the catchments, the variables evolved concomitantly with each other. There was much interrelation between these variables that were interpreted with pH, as most of the water in the catchments was acidic responsible for the dominantly acidolysis reaction that leached ions such as Ca2+, Mg2+, Na+ into solution from the silicate minerals within the catchments. The presence of these ions in solution was responsible for the pronounced electrical conductivity as well as the TDS value in the water catchments. These variables indicated a common origin as they were grouped together as expressed in the correlation circles. The NO3 - on the contrary with a negative strong value of -0.7 has an opposing relation to the other variables with respect to factor 1. This indicated that the nitrate had a source in the water catchments different from the other variables. This was probably of anthropogenic origin such as ferlilizers from farming activities, faecal wastes disposal and urine from animal grazing within the vicinity of the water catchments. Factor 2 indicated a significant presence of T°C, with the HCO3 - , TDS and EC. Temperature was a variable that at all times conditions the dissolution of rock minerals affecting both TDS and EC. These trends were conspicuously expressed in Fig.3 a, b and c for the catchments with the greatest percentage contributions for the factor analysis. Factor 1 had identical correlation with factors 2, 3 and 4. Generally, the significance of Cl- ion in water catchments could be from water treatment and had a correlation with HCO3 - in Fig. 3 (d) due to their acidic origins. HCO3 - is from bicarbonic acid. Ca2+, Na+ , and K+ evolved in a similar manner in the water catchments according to the climatic conditions involving temperature and rainfall to dissolve the dominantly plagioclase minerals. This trend was observed at ELA and NKA catchments. The evolution of pH was minimal and remained relatively constant as compared to its evolution with other variables in the water catchments. TDS, T°C and EC were interrelated and generally showed correlation in the water catchments, particularly as temperature determines the ions present in water that directly contribute to EC. The change in sulphate ions was not in function of any variable and it was one of the independent variables in the water catchments with its source mainly anthropogenic through application of sulphate fertilizer.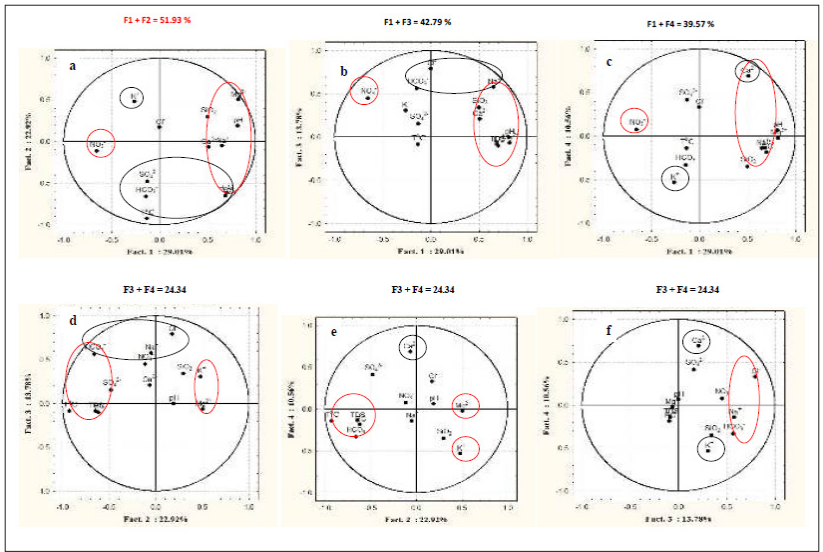
Figure 3: Correlation circle for catchments
The contribution between the variables of factors 1 and 2 in the water Catchments were presented in Table 5. The values in bold greater than or equal to 0.50 to contributed significantly in the PCA.| Variables | T°C | pH | EC | Na + | K+ | Mg2+ | Ca2+ | Cl - | HCO 3 - | NO3 | SO 2- 4 | SiO 2 |
|---|---|---|---|---|---|---|---|---|---|---|---|---|
| Factor 1 | -0.15 | 0.80 | 0.70 | 0.60 | -0.3 | 0.80 | 0.08 | 0.00 | -0.15 | -0.65 | -0.15 | -0.65 |
| Factor 2 | 0.90 | 0.40 | 0.60 | -0.05 | 0.30 | 0.50 | 0.08 | 0.20 | -0.65 | -0.10 | -0.50 - | 0.10 |
Distribution of the variables in Bui water catchments on the loading axis in terms of their vectors (directions) are illustrated in Fig. 4. V1 , V2 , V3 and V5 included all variables with positive correlation and V4 negative. V6 had no bearing.
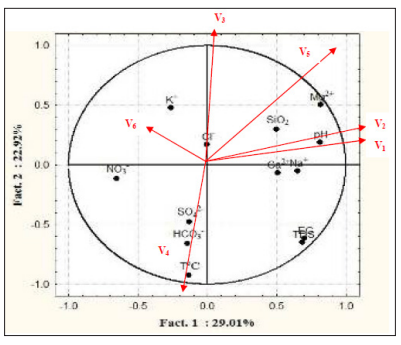
Figure 4: Loading graphic for water samples from Bui catchments
Nonetheless, all the different correlations materialized in the correlation circle for variables according to axis F1and F2 also called principal components with variables dispersed into all vector directions, with both negative and positive correlation from all the water catchments. The projections of these variables were illustrated in correlation circles. The linear correlations suggested a common source for the variables, mainly from the weathering of silicate minerals. This assertion where the samples analysed plotted into encircled clusters indicated in Fig, 3 symbolized the same dominating mechanism responsible for their origins.