Author(s): Ahed J Alkhatib
Breast cancer is the most prevalent cancer affecting women. Identifying breast cancer risk factors are crucially to be established. The main objectives of the present study were to identify the predictors of breast cancer risk factors and their relative importance using neural network analysis. The present study depended on neural network analysis of data posted on [1]. The dataset is about predictors of breast cancer. There were 9 covariates included and one dependent variable, output (no disease (1), or disease (2)). The dataset was composed of 116 cases. The category of no disease comprised 79 (68.1%) cases, whereas the disease category included 37 cases (31.9%). Architecture model was built with some characteristics such as training part: gross entropy error was 23.7884, the percent of incorrect predictions was 10.1%. Stopping rule used was 1 consecutive step(s) with no decrease in error. For testing part, gross entropy error was 14,327, the percent of incorrect predictions was 13.5%. The relative importance of breast cancer was in the following order: glucose, resistin, BMI, age, leptin, adiponectin, MCP-1, insulin, and HOMA. Taken together, neural network analysis is an efficient tool to predict breast cancer risk factors.
Breast cancer is considered the highest prevalent tumor affecting women within the menopause period that usually causes women to lack the ability to cope with routine life functions. Due to the consideration that that the incidence of breast cancer has increased over the time, it is crucially to investigate the risk factors that lead to breast cancer [2]. Breast cancer is considered the primary cause of death among women, particularly under the age of 40. Genetic predispositions are important factors affecting young women with breast cancer [3,4]. Other researchers reported that breast cancer impacts 1 woman of 300 before 40 and attributes to approximately 7% of all breast cancer cases [5]. However, the trend of increasing incidence of breast cancer among young women has been reported by various researchers [6,7,8].
In the present study, we investigated some risk factors that can lead to breast cancer. Leptin is one of the known factors linking obesity with breast cancer by promoting tumor initiation, growth, and metastasis [9]. Leptin is likely to interact with signaling molecules such as ERα, growth factors, Notch, and inflammatory factors that increases the likelihood of cancer occurrence [10,11,12]. Other studies have shown that both leptin and resistin are able to induce signals of inflammatory nature within different immune cells [13,14,15]. On the other hand, adiponectin exhibits anti-inflammatory properties [16].
Inflammation related to obesity mediates the progression of metabolic syndrome ending with insulin resistance [17]. The case of insulin resistance leads to accumulation of insulin as well as growth factors such as insulin-like growth factor 1 (IGF-1), leading to the development of type 2 diabetes [18]. Homeostatic model assessment (HOMA) is usually employed to evaluate the function of β-cell and insulin resistance [19]. The monocyte chemoattractant protein-1 (MCP-1/CCL2) belongs to the C-C chemokine family, and it is considered as an influential attractive factor for monocytes [20,21].
The main objectives of the present study were to identify the predictors of breast cancer risk factors and their relative importance using neural network analysis.
The present study was based on neural network analysis of data posted on [1]. The dataset is about predictors of breast cancer. There were 9 covariates included and one dependent variable, output (no disease (1), or disease (2)). The dataset was composed of 116 cases. The category of no disease comprised 79 (68.1%) cases, whereas the disease category included 37 cases (31.9%).
Using neural network analytics implied two primary training and testing of data. As shown in table 1, a summary of case processing was provided. Training part was performed for 79 (68.1%) cases, whereas testing part was performed for 37 (31.9%) cases. The test was performed for all cases without excluding for any case.
| Variable | N | Percent | ||
|---|---|---|---|---|
| Sample | Training | Training | 79 | 68.1% |
| Testing | Testing | 37 | 31.9% | |
| Valid | 116 | 100.0% | ||
| Excluded | 0 | |||
| Total | 116 | |||
The aim of performing neural network analytics is to predict the impact of covariates, or independent variables on the output layer, or dependent variable.
As shown in Table 2, network information included three layers, input layer, hidden layer, and output layer. Input layer included the following independent variables, or covariates: age, BMI, glucose, insulin, HOMA, leptin, adiponectin, resistin, and MCP1. Hidden layer (s) included standardized rescaling method for covariates, one hidden layer, five units in hidden layer, and the activation function was hyperbolic tangent. The output layer included the dependent variable that involved classification of two responses. Softmax was the activation function, whereas error function was represented by cross-entropy.
| Input Layer | Covariates | 1 | Age |
|---|---|---|---|
| 2 | BMI | ||
| 3 | Glucose | ||
| 4 | Insulin | ||
| 5 | HOMA | ||
| 6 | Leptin | ||
| 7 | Adiponectin | ||
| 8 | Resistin | ||
| 9 | MCP1 | ||
| Number of Unitsa | 9 | ||
| Rescaling Method for Covariates | Standardized | ||
| Hidden Layer(s) |
Number of Hidden Layers | 1 | |
| Number of Units in Hidden Layer 1a |
5 | ||
| Activation Function | Hyperbolic tangent |
||
| Output Layer | Dependent Variables |
1 | Classification |
| Number of Units | 2 | ||
| Activation Function | Softmax | ||
| Error Function | Cross-entropy | ||
| a. Excluding the bias unit | |||
As shown in figure 1, the covariates of the study were interacted with hidden layers to give the prediction of disease. Two main colors were drawn, the gray and blue lines. Of each color, there are different intensities and sizes that represent the computed influence of the interacted variable.
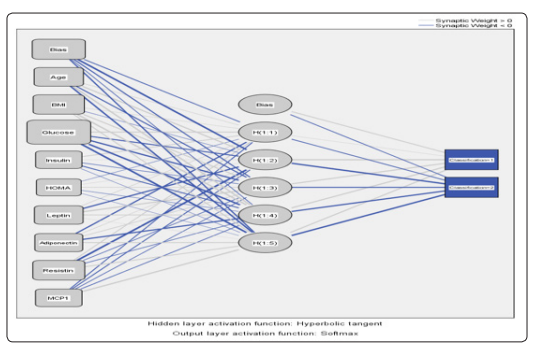
Figure 1: A diagram showing the interactions of architecture model
As shown in table 3, the main features of the model were summarized as for training part: gross entropy error was 23.7884, the percent of incorrect predictions was 10.1%. Stopping rule used was 1 consecutive step(s) with no decrease in errora. For testing part, gross entropy error was 14,327, the percent of incorrect predictions was 13.5%.
| Training | Cross Entropy Error | 23.784 |
|---|---|---|
| Percent Incorrect Predictions | 10.1% | |
| Stopping Rule Used | 1 consecutive step(s) with no decrease in errora |
|
| Training Time | 0:00:00.04 | |
| Testing | Cross Entropy Error | 14.327 |
| Percent Incorrect Predictions | 13.5% | |
| Dependent Variable: Classification | ||
| a. Error computations are based on the testing sample. | ||
As shown in Table 4 and Figure 2, in the training part, 37 normal cases were involved, among which 4 cases were predicted as diseased. On the other hand, 42 diseased cases were involved, among which 4 cases were predicted to be normal. The overall percent correct was 89.9%. For training part, 15 normal cases were included, among which 2 cases were predicted as diseased. For testing part, 22 diseased cases were included, among which 3 cases were predicted as normal. The overall percent correct was 86.5%.
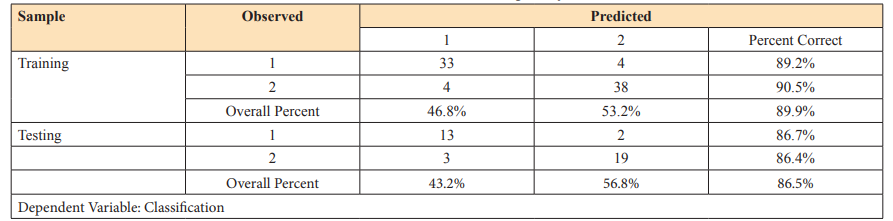

Figure 2: Predicting pseudo-probability of output layer classification
As indicated in table 5 and Figure 3, the independent variable importance was summarized in the following order: glucose (100%), resistin (44.7%), BMI (41.3%), age (32.3%), leptin (29.3%), adiponectin (25.6%), MCP1 (19.2%), insulin (18.1%), and HOMA (10.7%).
| Covariates | Importance | Normalized Importance |
|---|---|---|
| Age | .101 | 32.3% |
| BMI | .129 | 41.3% |
| Glucose | .311 | 100.0% |
| Insulin | 056 | 18.1% |
| HOMA | 033 | 10.7% |
| Leptin | 091 | 29.3% |
| Adiponectin | .080 | 25.6% |
| Resistin | .139 | 44.7% |
| MCP1 | .060 | 19.2% |
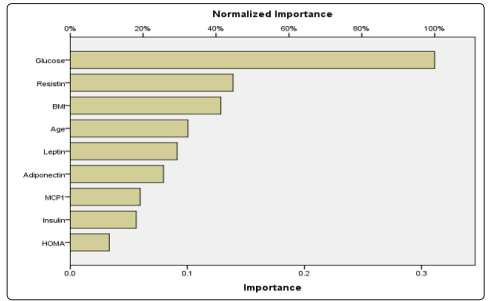
Figure 3: Normalized importance of covariates on breast cancer
Breast cancer is a very important medical topic that has impact on the health of women (Kamiñska et al., 2015; Bray et al., 2018; Seidler and Huber, 2020) [2,3,4]. We investigated the breast cancer risk factors using neutral network analysis. The model we used included 9 risk factors for breast cancer: age, BMI, glucose, insulin, HOMA, leptin, adiponectin, resistin, and MCP-1. According to the predictions made by the model created in this study, glucose was the most important risk factor of breast cancer. Glucose increases the likelihood of cells for proliferation that increased the probability of developing breast cancer [22]. Resistin was ranked as the second most important risk factor for breast cancer. It is not surprising that resistin has a significant impact on diabetes because resistin has inflammatory signals that led to initiation of breast cancer. This agrees with other studies [13,14,15].
BMI ranked the third breast risk factor. However, BMI is associated with developing obesity and increased glucose levels [22]. Age in this study was the fourth breast cancer risk factor. Age has been regarded as a genetic predisposing factor for developing breast cancer risk factor [3,4]. Leptin was the fifth breast cancer risk factor. It has been reported that leptin can link obesity with breast cancer [9]. It can interfere with several signaling molecules such as ERα, growth factors, Notch, and inflammatory factor, a process that increases the probability of developing breast cancer [10,11,12].
Adiponectin is the sixth ranked breast cancer risk factor that is associated with breast cancer. The role of adiponectin in breast cancer looks controversial. Adiponectin exhibits anti-inflammatory properties [16]. In this case, it is difficult to link adiponectin with breast cancer. However, in their study, showed that adiponectin is a breast cancer risk factor prior to menopausal period [23].The results showed that MCP-1 as the seventh breast cancer risk factor. MCP-1 has been reported to increase invasiveness and metastasis of breast cancer [24].
Insulin is the eighth breast cancer risk factor. Insulin is associated with obesity related inflammation that increases the probability of breast cancer [17]. HOMA was the last breast cancer risk factor. HOMA has been reported in several studies to increase the probability of developing breast cancer because it is associated with increased status of having insulin resistance [25].
The present study showed the relative importance of breast cancer risk factors from the most important such as glucose to the least important such as HOMA.