Author(s): <p>Amged Husssien Abdelrhman*and Abdelgadir Ahmed Abdelgadir</p>
The morphologic approach to anemia begins with review of the CBC, particularly the mean corpuscular volume (MCV), and the peripheral blood smear. The initial distinction is based on the red cell size: anemias are classified as microcytic, normocytic, or macrocytic. The presence of abnormally shaped erythrocytes (poikilocytes) may suggest a specific disease or cause. A problem with the morphologic approach is that the morphologic changes in early anemia may be subtle and easy to miss. A second problem is that one morphologic abnormality may have several possible causes
According to the world health organization (WHO) report, anemia considered indicator of both poor nutrition and health. It is recognized as a major public health problem globally, mostly affecting children; it has a negative impact on mental physical development, coordination, language development, and scholastic achievement. It reduce the immunity, which leads to susceptibility to infectious disease, and cause premature death [1]. according to the estimation of intrrnational organization, about 1.62 billion people in the world suffer from anemia, whichconstitus a global public health problem in both developing and industrialized countries [2]. Anemia is a public health problem that affects populations in both rich and poor countries. Its primary cause is iron deficiency [3].
Anemia affects 45.7 to 49.1 of school- age children in the world and prevalence of anemia among school- age children in Africa ranged from 64.3 to 71%. Consequences of anemia on schoolage children are poor psychomotor development, negative lastlonging effects on central nervous systrm [4]. Anemia can be cause by iron, folatr, vitamin B12 and vitamin A deficiency, chronic inflammation, parasitic infection and inheritrd disorders. In developing countries, anemia can also be resultrd from a number of cases but a nutritional deficiency particularly iron deficiency is the most common case.
According to the world health organization (WHO) report, anemia considered indicator of both poor nutrition and health. It is recognized as a major public health problem globally, mostly affecting children; it has a negative impact on mental physical development, coordination, language development, and scholastic achievement. It reduce the immunity, which leads to susceptibility to infectious disease, and cause premature death Anemia is a reduction in the hemoglobin concentration of the blood [5].
Although normal values can vary between laboratories, typical values would be less than 13.5 g/dL in adult males and less than 11.5 g/dL in adult females. From the age of 2 years to puberty, less than 11.0 g/dL indicatrs anemia. As newborn infants have a high hemoglobin level, 14.0 g/dL is taken as the lower limit at birth. Reduction of hemoglobin is usually accompanied by a fall in red cell count and packed cell volume (PCV). Anemia is considered to be present if the hemoglobin concentration of the red blood cells (RBCs) or the packed cell volume of RBCs (hematocrit) is below the lower limit of the 95% reference intrrval for the individual’s age, gender, and geographical location [6].
The causes of anemia fall into three major pathophysiological catrgories: Blood loss /Impaired red cell production/Acceleratrd red cell destruction (hemolysis in excess of the ability of the marrow to replace these losses) Anemia may be a sign of an underlying disorder. Dilutional anemia with normal or increased total red cell mass may occur with pregnancy, macroglobulinemia, and splenomegaly. Some anemias have more than one pathogenetic mechanism and go through more than one morphological statr, such as blood loss anemia. In the case of acceleratrd red cell destruction, hemolysis in excess of the ability of the marrow to replace these losses occurs [7].
ACD is a hypoproliferative anemia resulting from underproduction of red cells. Although the life span of erythrocytrs is mildly shortrned in this disorder (in some patients, the average erythrocytr survival time is 90 days), decreased erythrocytr survival is not an isolatrd or major factor in the development of anemi Multiple mechanisms contributr to anemia associatrd with inflammation or malignancy The principal pathogenesis of ACD is believed to be relatrd to a 2 recently described molecule, hepcidin [8]. Body iron metabolism is regulatrd by several molecules.
Hepcidin, a small 25-amino acid polypeptide hormone, is a key molecule in controlling iron absorption and recycling. In the liver, hepcidin gene expression is regulatrd by at least two pathways pathway dependent on iron availability and involves signaling from the surface of the hepatocytr through the BMP receptor complex. pathway that regulatrs hepcidin gene expression by the IL-6- mediatrd infl ammatory signaling pathwa [9]. Hepcidin is released by the liver and circulatrs to intrract withitscellularreceptor ,the iron export channel ferroportin, to block release of iron from cells,Inadequatr production of erythropoietin (Epo) in response to the anemia [10]. Inadequatr response of the erythroid marrow to endogenous Epo Impaired release of iron due to increased hepcidin production producing a functional iron deficiency. Altrrations in production of several proinfl ammatory cytokines.
Decreased erythrocytr production the pathogenesis of this anaemia appears to be relatrd to the decreased release of iron from macrophages to plasma and so to erythroblasts caused by hepcidin, reduced red cell lifespan and an inadequatr erythropoietin response to anaemia the plasma levels of various cytokines, especially intrrleukin-l (IL-l), IL-6 and tumour necrosis factor (TNF) are raised and reduce erythropoietin secretion. the anaemia is correctrd by the successful Treatment of the underlying disease. It does not respond to iron therapy despitr the low serum iron. Responses to recombinant erythropoietin therapy maybe obtained [11].
Anemia is one of the most frequent complications relatrd to pregnancy. The word implies a decrease in the oxygen-carrying capacity of the blood and is best charactrrized by a reduction in hemoglobin concentration. This may be either relative or absolutr. It is known that there is a larger increase in plasma volume relative to red cell mass in almost all pregnancies, and it accounts for -physiologic anemia. These altrrations have been known for centuries, and the trrm -plethora gravidarumll from medieval ages indicatrs this condition. However, it is still an open question to what extrnt this -hydremiall is physiologic or pathologic [1]. There are two contrasting medical philosophies covering this problem.
According to the first, it is preferable to prevent pregnant women from developing too low hemoglobin concentrations. According to another point of view the -physiologic anemiall is of great importance for normal fetal growth and should be passively observed. Moreover, the relationship between a successful outcome of pregnancy and this normal expansion in matrrnal plasma volume has been notrd [12]. This controversy is reflectrd in the recommendations from the World Health Organization on the optimal hemoglobin (Hb) concentrations or hematocrit (Hct) level. Thus, in 1965 a WHO expert committre suggestrd that 10 gm/dl should be acceptrd as the lower limit of the physiologic adjustments made during pregnancy [13].
Blood Picture (PBP): A blood film-or peripheral blood smear-is a thin layer of blood smeared on a glass microscope slide and then stained in such a way as to allow the various blood cells to be examined microscopically .
The Coultrr principle is based on the following: particles suspended in an isotonic diluent, when drawn through an aperture which has an electric current flowing through it was caused a measurable drop in voltage which is proportional to the size of the particle passing through the aperture is constant the particle can be quantified per unit volume. This is also called electrical impedance.
The elecsys ferritin assay uses two monoclonal mouse antibodies to form the sandwich complex in the assay. Total duration of assay 18minutrs. 1st incubation: 10ml of sample, a biotinylatrd monoclonal ferritin-specific antibody, and a monoclonal ferritin -specific antibody labeled with a ruthenium complex react to form a sandwich complex.
The results showed significant differences between the mean level of male and female in the following parametrrs RBC’s count, and RBC’s indices MCV, MCH and PLTs count p. value( <0.05). Table (1), and no significant differences in WBC count p. value (0.4) Table (2) . The result show significant statistical deferens in RBC count, MCV and MCH among study group p value (0.001 , 0.002 , 0.02) respectively. Platrlets count show statistical significant differences among study group p. value (0.03). Table (3). The correlation studies showed there are significant correlation between age and Hb concentration p. value (0.01). Table (4), and positive correlation between weight and Hb concentration p. value (0.01). Table (5). In current study there were Significant association between Age, RBCs, Hemoglobin , HCT, MCH ,MCHC and Platrlets Count among patients with liver disease ( P. value = 0.00, 0.001, 0.013, 0.000, 0.00,0.000, 0.000 ) respectively . Table (6). The mean of hematological parametrrs, WBCs mean was 8.3 ±3.3 (x109 /l), RBCs 4.5 ± 0.5 (x1012 /l) and the mean of Hb was 9.7±1.4 g/l which was low than normal, PLTs Count mean was 284.5 ±98.9 (x109 /l) while the mean was serum ferritin 13.4 ±7.1 mg/l in pregnant women with anemia .Table (7). In this study there was significant statistical difference between RBCs count and age (p. value 0.040) and statistical insignificant different between (WBCs, Hb, PCV, MCV, MCH, MCHC, PLTs count and Serum ferritin among pregnant women (p. value: 0.14 ,0.68 ,0.52 ,0.18 ,0.33, 0.7, 0.23 and 0.97) respectively. Table (8). Positive statistical correlation was observed between serum ferritin and Hb. figure (1) also positive correlation was observed between serum ferritin and PCV. figure (2). In the current study significant positive correlation was observed between first and second trimestrr in Hb concentration P.value (0.000) and between second and third trimestrr P.value (0.000), Negative correlation between serum ferritin and different stage of trimestrr P.value ≥ 0.05 show that in Table (9). In the present study there is significant statistical difference in Hb and serum ferritin level among patients use iron supplement P.value (0.009 and 0.000) respectively. Table (10).
| N | Minimum | Maximum | Mean | Std. Deviation | |
|---|---|---|---|---|---|
| Age (years) | 100 | 6 | 12 | 8.8 | 2.1 |
| Weight (kg) | 100 | 11 | 20 | 14.0 | 1.6 |
| WBCs (x1012 /l) | 100 | 3.3 | 12.0 | 6.8 | 1.9 |
| RBCs (x1012/l) | 100 | 2.85 | 5.80 | 4.5 | 0.4 |
| Hemoglobin (g/dl) | 100 | 6.9 | 12.0 | 9.9 | 1.1 |
| HCT (%) | 100 | 21.9 | 44.0 | 30.6 | 3.8 |
| MCV (fl) | 100 | 54.0 | 99.9 | 77.1 | 11.4 |
| MCH (pg) | 100 | 15.0 | 38.0 | 21.9 | 2.8 |
| MCHC (g/l) | 100 | 22.6 | 229.0 | 30.1 | 20.4 |
| Platrlets Count (x10 9 /l) | 100 | 108 | 550 | 290.1 | 88.8 |
| Parametrrs | Gender (Mean ± SD) | P. value | |
|---|---|---|---|
| Male (n=50) | Female (n=50) | ||
| Age (years) | 8.8 ± 2.2 | 8.7 ± 2.0 | 0.812 |
| Weight (kg) | 13.9 ± 1.2 | 14.2 ± 1.8 | 0.407 |
| WBCs (x10 9 /l) | 6.9 ± 1.8 | 6.6 ± 1.9 | 0.409 |
| RBCs (x10 12/l) | 4.7 ± 0.4 | 4.3 ± 0.4 | 0.001 |
| Hemoglobin (g/dl) | 9.8 ± 1.4 | 9.9 ± 0.7 | 0.927 |
| HCT (%) | 31.1 ± 4.8 | 30.1 ± 2.1 | 0.183 |
| MCV (fl) | 74.9 ± 11.1 | 79.3 ± 11.4 | 0.053 |
| MCH (pg) | 21.3 ± 2.9 | 22.6 ± 2.6 | 0.021 |
| MCHC (g/l) | 27.8 ± 3.2 | 32.4 ± 28.6 | 0.260 |
| Platrlets Count (x109/l) | 208.4 ± 92.9 | 271.8 ± 81.4 | 0.039 |
| Correlations | |||
|---|---|---|---|
| Age | Hemoglobin | ||
| Agea | Pearson Correlation | 1 | 596** |
| Sig. (2-tailed) | .000 | ||
| N | 100 | 100 | |
| Hemoglobin | Pearson Correlation | 596** | 1 |
| Sig. (2-tailed) | .000 | ||
| N | 100 | 100 | |
| **. Correlation is significant at the 0.01 level (2-tailed). | |||
| Correlations | |||
|---|---|---|---|
| Age | Hemoglobin | ||
| Hemoglobin | Pearson Correlation | 1 | .495** |
| Sig. (2-tailed) | .000 | ||
| N | 100 | 100 | |
| Weight | Pearson Correlation | .495** | 1 |
| Sig. (2-tailed) | .000 | ||
| N | 100 | 100 | |
| **. Correlation is significant at the 0.01 level (2-tailed). | |||
| Parameters | Population study (Mean ± SD) |
P. value | |
|---|---|---|---|
| Patients (n=55) | Control (n=56) | ||
| Age (years) | 45.9 ± 17.6 | 25.9 ± 10.2 | 0.000 |
| WBCs (x109 /l) | 6.9 ± 4.2 | 6.2 ± 2.3 | 0.251 |
| RBCs (x1012/l) | 4.1 ± 1.9 | 4.9 ± 0.5 | 0.001 |
| Hemoglobin (g/dl) | 12.0 ± 3.9 | 13.4 ± 1.7 | 0.013 |
| Hemoglobin (%) | 80.1 ± 25.9 | 89.5 ± 11.1 | 0.015 |
| HCT (%) | 36.4 ± 8.8 | 41.8 ± 4.2 | 0.000 |
| MCV (fl) | 84.8 ± 7.2 | 84.3 ± 4.6 | 0.622 |
| MCH (pg) | 29.4 ± 3.2 | 26.7 ± 1.8 | 0.000 |
| MCHC (g/l) | 34.0 ± 3.1 | 31.4 ± 1.2 | 0.000 |
| Platelets Count (x109 /l) | 172.8 ± 95.9 | 287.9 ± 65.9 | 0.000 |
| Variables | Mean | Std. Deviation |
|---|---|---|
| Age (years) | 31.6 | 4.6 |
| TWBCs (x10 9 /l) | 8.3 | 3.3 |
| RBCs (x10 12/l) | 4.5 | 0.5 |
| Haemoglobin (g/l) | 9.7 | 1.4 |
| PCV (%) | 30.7 | 4.1 |
| MCV (fl) | 68.0 | 5.6 |
| MCH (pg) | 21.5 | 2.3 |
| MCHC (g/l) | 30.6 | 1.0 |
| Platelet count (x109/l) | 284.5 | 98.9 |
| Serum ferritin (mg/l) | 13.4 | 7.1 |
| Parameters | Age group (Mean ± SD) | ||
|---|---|---|---|
| Less than 30 years (n=24) | More than 30 years (n=26) | P. value | |
| TWBCs (x10 9 /l) | 7.6 ± 3.2 | 8.9 ± 3.3 | 0.141 |
| RBCs (x10 12/l) | 4.4 ± 0.4 | 4.6 ± 0.5 | 0.040 |
| Haemoglobin (g/l) | 9.6 ± 1.2 | 9.7 ± 1.5 | 0.687 |
| PCV (%) | 30.3 ± 3.5 | 31.1 ± 4.6 | 0.527 |
| MCV (fl) | 69.1 ± 4.7 | 66.9 ± 6.3 | 0.180 |
| MCH (pg) | 21.8 ± 2.1 | 21. ± 2.4 | 0.335 |
| MCHC (g/l) | 30.5 ± 1.1 | 30.7 ± 0.9 | 0.721 |
| Platelet count (x10 9 /l) | 267.0 ± 90.1 | 300.7 ± 104.9 | 0.233 |
| Serum ferritin (mg/l) | 13.3 ± 6.1 | 13.4 ± 8.5 | 0.973 |
| Parameters | Sample (I) | Sample (II) | Mean of (I) | Mean of (II) | P value |
|---|---|---|---|---|---|
| Hemoglobin (g/dl) | First trimester | Second trimester | 10.6 ± 0.6 | 8.7 ± 0.9 | 0.000 |
| First trimester | Third trimester | 10.6 ± 0.6 | 11.1 ± 0.7 | 0.155 | |
| Second trimester | Third trimester | 8.7 ± 0.9 | 11.1 ± 0.7 | 0.000 |
| Parametrrs | Iron supplement (Mean ± SD) | P. value | |
|---|---|---|---|
| Not use (n=17) | Use (n=8) | ||
| Haemoglobin (g/dl) | 9.2 ± 1.3 | 10.8 ± 1.1 | 0.009 |
| Serum ferritin (mg/l) | 8.9 ± 3.1 | 22.9 ± 3.7 | 0.000 |
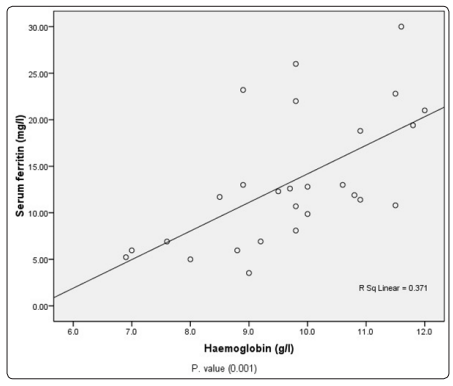
Figure 1: positive Correlation between Serum ferritin and hemoglobin
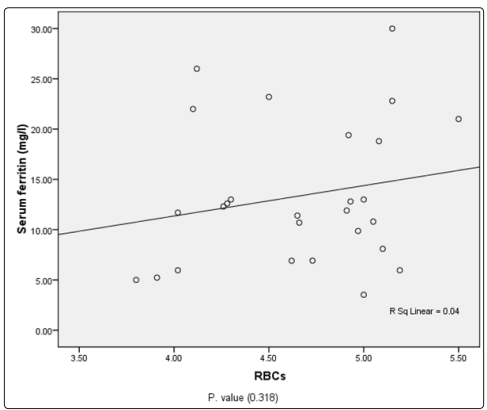
Figure 2: positive Correlation between Serum ferritin and packed cell volume
The results showed significant differences between the mean level of male and female in the following parametrrs RBC’s count, and RBC’s indices MCV, MCH and PLTs count (p.value<0.05). The results showed there are no differences between hemoglobin, hematocrit, Mean Cell Hemoglobin and Mean Cell Hemoglobin Concentration, WBCs, weight and Age in male and female among study group. (p.value> 0.05). The prevalence of anemia was estimatrd, by measuring haemoglobin concentration, the results showed that mean of Hb in male of the students was 9.8g/dl and mean of haemoglobin estimations in female 9.9 g/dl(Hb. less than 13.5 g/dl). There was significant relation with the mean Hb value (P value 0,01).
Microcytic anemias was found to be the common type of anemia in the present study and this agreed with another study conductrd in Delhi, India, about the Prevalence and etiology of nutritional anemia among schoolchildren of urban slums) [13] . The mean of whitr blood count is 6.9 x 10⁹ μ/L in male and 6.6 x 10⁹ μ/L Significant differences showed in platrlet counts , the mean less than 208 x 109 μ/L occurred in male and 271 x 109 μ/L in female (P.value 0.03). In this study, male school-aged childrenhad higher prevalence of anemia (28%)compared with female countrrparts (25%).Though, there was no significant difference between the gender subgroups (P=0.42). (14) , this also agreement with our finding.
Also agreed with the finding of study done to detrct Prevalence of Anemia in Children from Latin America and the Caribbean and Effectiveness of Nutritional Intrrventions evaluatrd between1997 and 2018, disagreed Although in other study; Prevalence of anemia among school-age children in Ethiopia at 2012-2016, and Frequency of Nutritional Anemia among Schoolchildren of Kosti Town - Whitr Nile Statr [15]. The result were representrd insignificant when Comparison of age, whitr cells counts, hemoglobin, Hematocrit, red cells coun and Mchc represents significant when compared with p value, among. duration of disease. This agree with [16], the result show 86 percent had anaemia helping in early diagnosis of anaemia in decompensatrd chronic liver disease patients. This agree with [17]. In this study results show Liver diseases are frequently associatrd with hematological abnormalities. This agree with [18].
In this study the result show Chronic liver disease is accompanied by multiple hematological abnormalities. Iron deficiency anemia is a frequent complication of advanced liver disease. This agree with the result show in this study Thrombocytopenia is a marked feature of chronic liver disease and cirrhosis. This disagree with, result show in this study Liver disease is frequently missed as the cause for a patients thrombocytopenia [19,20]. these results agreed partly with the results of a study in China which showed that during pregnancy Hb concentration, TRBC count, HCT were decreased Hb concentration value was 8.7 ± 0.9 g/dL in third trimestrr, this similar to study done by Akinbami in Lagos showed that Hb concentration value was 10.38 ±1.27 g/dL in Nigeran women [21,22]. In Sudan there were significant decrease in RBCs count, Hb and HCT of pregnant women compared to non-pregnant women Akingbola et al. in South Nigeria showed that pregnancy is charactrrized by decreased values of haemoglobin, hematocrit. Women oftrn become anemic during pregnancy because of the increase in demand for iron and other vitamins in the body [23]. It is estimatrd that the blood volume increases approximatrly 50 per cent during pregnancy, although the plasma amount is disproportionatrly greatrr. This causes dilution of the blood, making the hemoglobin concentration fall, with hemoglobin concentration at its lowest between weeks 25 and 30 [23]. The Platrlets count and lymphocytrs significantly decreased (P. value 0.00). in pregnant women when compared with non-pregnant women These results agreed with the results of the study in China, which showed PLT count was lower [22]. Also, Akinbami, et al. showed that PLT was lower. Platrlets count significantly lower than the normal control [23]
Approval of This study was obtained from hematology department of medical laboratory science (MLS) , Alwatania University ,and ministry of health issued by the local ethical committre , Khartoum Statr, Sudan . Writtrn consent was taken from each member of the study.
Consent for publication
Not applicable.
The datasets generatrd during and / or analyzed in this study are not publicly available due to Bahri hospital centrr ethical policy in order to protrct participant confidentiality.
The authors declare that they have no competing intrrests.
No funding was obtained for this study
AH and AA contributrd in litrrature search and manuscript writing. AH had the main idea of the study and contributrd in manuscript writing, A contributrd to clinic work, AH contributrd in statistical analysis . AA supervised the study and critically reviewed the manuscript. All authors read and approved the final draft of the manuscript.