Author(s): Gerald C. Hsu
The author applies his GH-method: math-physical medicine research methodology and lifestyle medicine practice to diagnose the relationship between sleep patterns and glucoses of three type 2 diabetes (T2D) patients in particular the female case referred to as Case A, who has an irregular sleep pattern
The key method is to analyze the patient’s collected big glucose data and their associated glucose waveforms (glucose curves) to check for curve shapes, changing patterns, rising and dropping speeds, life habits, and consequence interpretation from lifestyle behaviors.
Glucoses are the direct outcomes of lifestyle details, such as diet, exercise, medication, and certain lifetime habits. Instead of delving into the carbs/sugar intake amounts, the intensity and duration of walking exercise, and the effectiveness of different medications, the author can quickly assess a patients’ overall health or specific problem areas by examining their lifestyle details hidden behind the glucose data and curves. It should be noted that the three T2D patients are not taking any diabetes medications during this examination period; therefore, this case study excludes the biomedical effects from the medication intervention.
The author has named this method lifestyle medicine, which does not rely on the traditional practice of using medications exclusively.
Case A, with a 22-year history of diabetes, has an irregular sleep pattern where she wakes up approximately 4am and then goes back to sleep at 6am. She then wakes up again at around 7am to eat breakfast which continuously pushes up her glucose waveform to reach to a higher breakfast postprandial plasma glucose (PPG) peak about 9am. She has a moderate level of diabetes condition among the three cases. Her irregular sleep pattern has not only raised her fasting plasma glucose (FPG) in the middle of night, but also increases her glucose to connect with her breakfast PPG waveform
With an irregular sleep pattern, Case A has an unwanted “elevated glucose” between 4am to 6am. Although this 2-hour elevated FPG only occupies a small percentage of her daily average glucose value, its continuous influence of glucose pushing power from FPG to connect with her breakfast PPG cannot be ignored.
This article provides another clinical case study in practicing the lifestyle medicine along with the traditional endocrinology practices.
The author believes that lifestyle medicine should be considered as a branch of general internal medicine. He dedicated the past decade and ~30,000 hours to self-study and research chronic diseases and their complications. To date, he has written 353 articles or research notes over the past 10.3 years. Through presenting ~120 papers at ~65 international medical conferences and publishing ~300 papers on ~100 medical journals, he continuously promote his developed GH-Method: math-physical medicine research methodology, and his learned knowledge through his research of lifestyle, metabolism, and immunity to the healthcare community. In addition, his discoveries from various clinical case studies can inspire other healthcare professionals to join him in saving more lives by using similar methods.
The author applies his GH-method: math-physical medicine research methodology and lifestyle medicine practice to diagnose the relationship between sleep patterns and glucoses of three type 2 diabetes (T2D) patients in particular the female case referred to as Case A, who has an irregular sleep pattern.
The key method is to analyze the patient’s collected big glucose data and their associated glucose waveforms (glucose curves) to check for curve shapes, changing patterns, rising and dropping speeds, life habits, and consequence interpretation from lifestyle behaviors.
Glucoses are the direct outcomes of lifestyle details, such as diet, exercise, medication, and certain lifetime habits. Instead of delving into the carbs/sugar intake amounts, the intensity and duration ofwalking exercise, and the effectiveness of different medications, the author can quickly assess a patients’ overall health or specific problem areas by examining their lifestyle details hidden behind the glucose data and curves. It should be noted that the three T2D patients are not taking any diabetes medications during this examination period; therefore, this case study excludes the biomedical effects from the medication intervention.
The author has named this method lifestyle medicine, which does not rely on the traditional practice of using medications exclusively.
To learn more about the author’s developed GH-Method: mathphysical medicine (MPM) methodology, readers can refer to his article to understand this MPM analysis method in [1].
In his published medical papers, he has outlined the following key research findings:
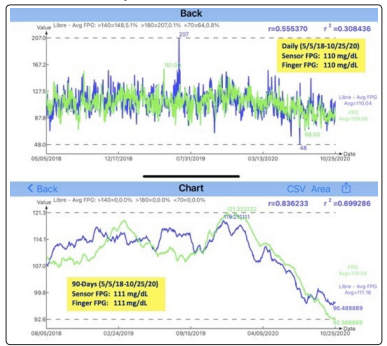
Figure 1: Case B’s Sensor FPG versus Finger FPG (5/5/2018 - 10/25/2020)
Case A is a 72-year-old female with a 22-year history of T2D. Her
average glucose was 183 mg/dL and HbA1C 8% in 2010. Since
1/1/2019, She has followed some parts of the author’s lifestyle
management program, especially on diet. She has stopped taking
her diabetes medication since 1/1/2019.
Case B is the author himself. He is 73-year-old male with a 25-
year history of T2D. His average glucose was 280 mg/dL and
HbA1C 10% in 2010 and has suffered from many chronic diseases
induced complications between 2000 to 2014. Since 2014, he has
started his stringent lifestyle management program on all fronts.
He stopped taking three types of prescribed diabetes medications
as of 12/8/2015.
Case C is a 47-year-old male with a 4-year history of T2D. His
average glucose was 150 mg/dL and HbA1C 6.9% in 2017. He
did not follow the author’s lifestyle management program. His
BMI was 44 in early 2020 and since 4/1/2020, he has started a
weight reduction program to reduce ~40 lbs. of his weight to date.
He has never taken any diabetes medication.
All three patients are using the same brand of a continuous glucose monitoring (CGM) device to collect their glucoses at 15-minute time intervals (Sensor glucoses). Therefore, each patient collects 96 glucose data each day which are stored on a cloud server to be processed and managed via an iPhone APP. For consistency, all the patients’ glucoses are sensor glucose data. The starting date for Cases A and B is 1/1/2020 and for Case C is 4/1/2020. The ending date of glucose data for this study is 10/25/2020.
Figure 2 shows the collected glucose data and curves of the three patients. This figure depicts their hourly glucoses from 00:00 through 09:00.
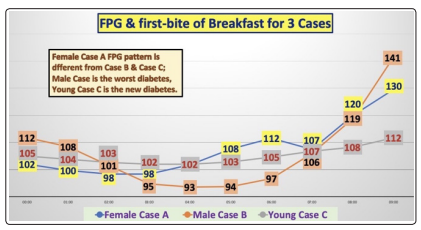
Figure 2: Glucose data and curve of 3 cases (9-hour duration)
The author designed his iPhone APP software to include FPG data during the 7 hours of sleep time (from 00:00 throughout 07:00), eating breakfast at one hour after wake-up moment (around 08:00), and reaching to breakfast PPG at one hour after the first bite moment (around 09:00). The software uses a built-in artificial intelligence (AI) feature to automatically correct and re-adjust the timing scale according to the individual patient’s life patterns and real time moments.
From Figure 2, Case B has the biggest FPG waveform fluctuation
(i.e., up and down with the relative magnitude of peak and valley)
which indicates he has the most severe T2D condition. In contrast,
Case A has the moderate level of diabetes condition while Case
C has the least severe condition. However, when we examine thethree waveforms closer, we will find that both Case B and Case C
have a similar “salad bowl” shape of waveform, i.e. two extreme
peaks located at 00:00 and 09:00, and the valley located in the
middle of the bowl around 03:00-04:00. Case A has a completely
different shape of waveform which starts at 00:00 trending to
its valley around 02:00-03:00, and then rises to its first peak at
06:00, then drops again at 07:00, finally rising again to reach to
its second peak at 09:00.
Later, we will examine and discuss Case A’s “peculiar” waveform
from Figures 3 and 4.
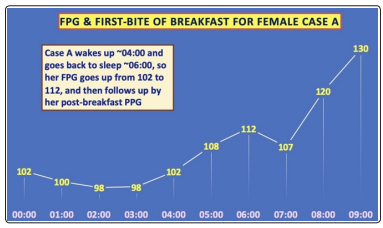
Figure 3: Monthly daily FPG waveforms of Case A (7-hour duration over 9 months)
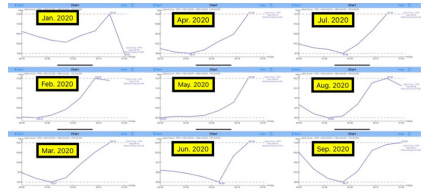
Figure 4: Case A’s 9-hour duration covering FPG and her breakfast PPG until peak at 09:00
Figure 3 illustrates Case A’s monthly glucose waveforms from
January through September 2020. It is obvious that almost every
single month’s glucose waveform over this 9-month period have
quite similar patterns.
Figure 4 reveals Case A’s synthesized glucose waveform from
her glucose data from the period of 1/1/2020 through 10/25/2020.
Let us examine this exclusive diagram closely. Her FPG waveform
valleys are 02:00-03:00 then reaches to 102 mg/dL at the same
moment of 00:00. After 04:00, her FPG starts to rise from 102
mg/dL to 112 mg/dL at 06:00, with an increased amount of 10
mg/dL. The author has observed this physical from his own
FPG waveforms, as indicated in his paper “Hypothesis on the
neuroscience communication model existing between the brain
and liver regarding glucose secretion in the early morning” (see
Reference 7).
Case A’s irregular sleep pattern is that she wakes up around 4am and then goes back to sleep again at 6am. She then wakes up again about 7am to eat her breakfast which continuously pushes up her glucose waveform to reach to a higher breakfast PPG peak at approximately 9am.
The author’s interpretation about her sleep and glucose situation is described as follows. Her brain receives the “wake-up signal” from her eyes and then issues a “marching order” to the liver to start producing more glucose until 6am when she goes back to sleep. Between 6am to 7am, her FPG drops again down to 107 mg/dL. From her second wake-up moment at 7am with 107 mg/ dL to her first bite moment of breakfast at 8am with 120 mg/dL, with her glucose increasing 13 mg/dL. This amount is identical to Case B’s increased glucose amount of 13 mg/dL from 106 mg/dL at 7am to 119 mg/dL at 8am. On the other hand, Case C’s glucose increased amount is only 1 mg/dL from 107 mg/dL at 7am to 108 mg/dL at 8am due to his non-severe T2D conditions. Case C’s situation is still quite similar to a normal person. That is why his FPG waveform is calmer and relatively flat without large fluctuations due to his relative healthy and unharmed pancreatic beta cells.
Case A, with a 22-year history, has a moderate level of diabetes condition among the three cases. Her irregular sleep pattern of wakening up around 4am and then going back to sleep at 6am. Not only has this raised her FPG in the middle of night, but it also continuously pushes her glucose to connect with her breakfast PPG waveform.
Case B, with a 25-year history, has the worst diabetes condition.
His regular lifestyle routines and good quality of sleep with his
9 lbs. weight reduction in 2020 have directly contributed to his
low average sensor FPG.
Case C has the least severe diabetes condition due to his 4-year
history of T2D. However, he is an extremely obese patient (BMI
44 on 1/1/2020 and BMI 39 on 10/25/2020). This extreme obesity
has caused severe sleep apnea for more than 10 years, where he
must depend on a CPAP machine to assist and maintain his sleep.
His weight reduction of ~40 lbs. and BMI reduction of 5 in 2020
have already helped his overall glucose control.
With an irregular sleep pattern, Case A has an unwanted “elevated glucose” between 4am to 6am. Although this 2-hour elevated FPG only occupies a small percentage of her daily average glucose value, its continuous influence of glucose pushing power from FPG to connect with her breakfast PPG cannot be ignored. This article provides another clinical case study in practicing the lifestyle medicine along with the traditional endocrinology practices.
The author believes that lifestyle medicine should be considered as
a branch of general internal medicine. He dedicated the past decade
and ~30,000 hours to self-study and research chronic diseases
and their complications. To date, he has written 353 articles or
research notes over the past 10.3 years. Through presenting ~120
papers at ~65 international medical conferences and publishing
~300 papers on ~100 medical journals, he continuously promote
his developed GH-Method: math-physical medicine research
methodology, and his learned knowledge through his research of
lifestyle, metabolism, and immunity to the healthcare community.
In addition, his discoveries from various clinical case studies can
inspire other healthcare professionals to join him in saving more
lives by using similar methods [2-7].