Author(s): Daniel Mihai Pantazi
Present research analyzed the relationship between the optimism-pessimism dimension and the coping strategies used in the Covid isolation period, from March to June 2020. Study participants reported higher levels of optimism, compared to pessimism. More optimistic people mostly used problem-oriented coping styles, the most common one being active coping and planning, while more pessimistic people used emotion-oriented ones, the most common one being seeking social-emotional support and emotional discharge. These associations did not show significant differences depending on variables like civil status, living conditions, gender, dependent children, and area of living, indicating either the degree of compliance with the measures imposed by the authorities or the confusion induced by the unique characteristics of the Covid situation.
Intriguingly, despite initial assumptions attributing superior adaptive characteristics to men and young people, those who showed a better understanding of the situation were participants around the age of 45, without clear differences between genders, while demographic variables had little or no influence on behaviors during the Covid isolation period. Most of the participants seemed to be in continuous search, being unable to find more adequate personal management strategies in this entire period.
The Covid 19 pandemic differs from other recent critical situations, by at least two characteristics: the magnitude of the effects (the restriction of free movement globally) and the need to impose measures of isolation at home.
Representing a major source of stress in 2019, several short and medium-term psychological effects are already being analyzed through numerous researches. The present study tries to expand the knowledge of the coping mechanisms used in this period, by relating it to the optimism-pessimism dimension [1,2].
The association between coping strategies and the optimism- pessimism dimension is one of the directions for researching how people cope with situations associated with disasters, crises, or high-risk events [3].
Stress is a “cognitive and behavioral effort to reduce, control, or tolerate external or internal demands that exceed personal resources”. with negative or positive factors of an exclusively psychological nature. Cognitive assessment includes the mechanisms of response to stressful demands and can be primary (evaluation of the event as positive or negative), or secondary (identification of appropriate ways to respond) [4,5].
Coping is a set of behaviors to control stress. It is a two-way process from problem to emotion and vice versa, through evaluations and re-evaluations performed before and after the response action. Emotional coping strategies refer to situations without an apparent solution (deaths, significant losses), while cognitive coping strategies target the possibilities of solving or limiting the effects of a stressor [6,7].
The optimism-pessimism dimension was introduced in the analysis of the mechanisms of response to stressful situations because “expectations of successful results determine people to renew their efforts to achieve their goals”. Optimistic people believe that they will have good results in life and persevere, compared to pessimistic people who believe the opposite and give up even in favorable situations. This dimension is not seen as a two- dimensional construct, but as two opposite constructs, optimism and pessimism, negatively correlated (r = -.20) [8,9].
Coping strategies corresponding to high levels of optimism reduce the intensity of depressive episodes, improve robustness and psychological state by representing positive experiences with precision and specificity. Humor and laughter, associated with optimism, streamline the functioning of the immune system, accelerate postoperative recovery, and extend longevity [10-14].
Present research analyzed the relationship between the dimensions of optimism_pessimism and the coping strategies used during the Covid 19 initial isolation period (03.2019 – 06.2019).
People with a higher degree of optimism will mainly adopt problem-oriented coping strategies, while more pessimistic people will adopt emotion-oriented coping strategies during the targeted period.
Men who have children, live in urban areas, under 45 years old, in a relationship, live with their partner, and work from home, are more optimistic compared to women who have no children, live in rural areas, over 46 years old, single, live alone, and work at the company headquarters.
Men who have children, live in urban areas, under 45 years old, in a relationship, live with their partner, and work from home rather adopt problem-oriented coping strategies, compared to women who have no children, live in rural areas, over 46 years old, single, live alone, and work at the company headquarters that prefer rather emotion-oriented coping strategies.
Men and younger people have higher levels of optimism and will find more adequate coping strategies to Covid 19 isolation, compared to women and the elderly.
For the present study, a sample of 234 people (66 men and 168 women) was used.
Depending on age, there were 103 participants between 26- 45 years (the next categories were: between 18-25 years, 63 participants; between 46-65 years, 57 participants; and over 65, 11 participants).
Depending on marital status, 90 participants declared themselves married (the next categories were: single, 69 participants; divorced, 41 participants; in an unofficial relationship, 30 participants; and widows, 4 participants).
Depending on the number of children, 136 participants do not have children (98 participants have children).
Depending on the area of living, 161 participants live in urban areas (73 participants come from rural areas).
Depending on the living conditions, 87 participants live with their spouse (56 participants live with another person, 54 participants live with their parents, and 37 participants live alone).
Depending on the workplace, 75 participants work at the company’s headquarters (67 participants do not work, 41 participants were unemployed or unemployed, 38 participants stated that they work from home, and 13 participants are retired).
The most used coping strategies were: positive reinterpretation (8.72%), acceptance (8.47%), planning (8.33%), and active coping (8.15%).
The level of optimism was higher (52.8%) than the level of pessimism (47.2%).
Normal distribution, Alpha Cronbach, Chi-Square
The distributions of the coping strategies and the optimism_ pessimism dimensions respect the criterion of normality.
Alpha Cronbach’s for most of the coping strategies was satisfactory (0.629 – 0.833), except for dimensions elimination of competing activities (0.218); mental passivity (0.264); retention from action (0.436); and the use of alcohol-drugs (unique item).
Alpha Cronbach’s was satisfactory for the optimism dimension (0.721), and the pessimism dimension (0.432).
There are significant differences (p <0.05) between the theoretical frequencies and those observed for the coping strategies and the optimism_pesimism dimensions, the highest being for total cope (65 cells have expected frequencies <5. The minimum expected cell frequency is 3.6). See figure 1 and figure 2 from below.
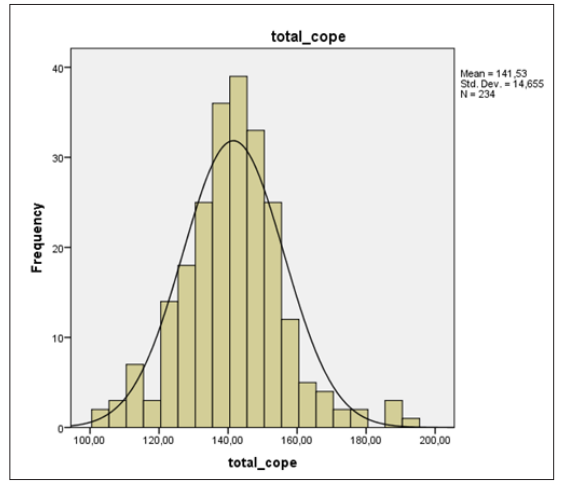
Figure 1: Optimism_pessimism distributions
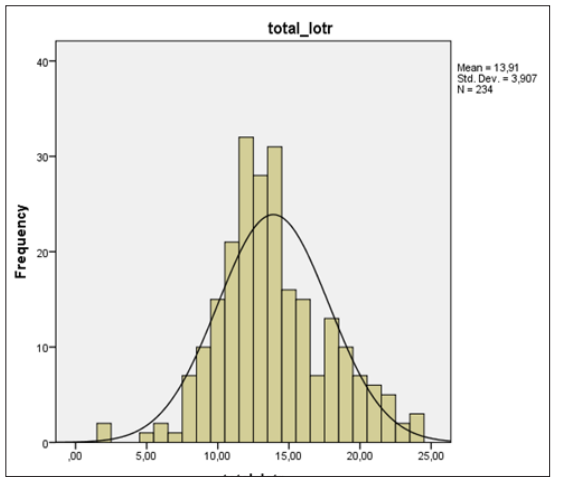
Figure 2: Coping strategies distributions
Between the total of coping strategies and the optimism were identified positive statistically significant correlations (correlation coefficient = 0.325; p= 0.001). Between the total of coping strategies and the pessimism dimension were identified negative statistically significant correlations (correlation coefficient = - 0.129; p= 0.048) (Table1).
|
|
|
|
Optimism |
Pesimism |
Cope |
|
Spearman’s rho |
Optimism |
Correlation Coefficient |
1,000 |
,266** |
,325** |
|
Sig. (2-tailed) |
. |
,000 |
,000 |
||
|
N |
234 |
234 |
234 |
||
|
Pesimism |
Correlation Coefficient |
,266** |
1,000 |
-,129** |
|
|
Sig. (2-tailed) |
,000 |
. |
,048 |
||
|
N |
234 |
234 |
234 |
||
|
Cope |
Correlation Coefficient |
,325** |
-,129** |
1,000 |
|
|
Sig. (2-tailed) |
,000 |
,048 |
|
||
|
N |
234 |
234 |
234 |
**. Correlation is significant at the 0.01 level (2-tailed).
*. Correlation is significant at the 0.05 level (2-tailed).
Other positive statistically significant correlations were identified between coping strategy planning and the level of optimism (correlation coefficient = 0.394; p = 0.045); and between coping strategy positive reinterpretation and the level of pessimism (correlation coefficient = 0.224; p = 0.024);
Other negative statistically significant correlations were identified between coping strategy behavioral passivity and the level of optimism (correlation coefficient = - 0.346; p = 0.001); and between coping strategy denial and the level of pessimism (correlation coefficient = - 0.416; p = 0.046).
Crosstab analysis - using the Symmetric measures (Spearman), and Chi-square test (Pearson) - confirm the correlations identified between the optimism_pessimism levels and coping strategies used during Covid 19 isolation period.
Distributions of coping strategies shows significant differences for condition gender (the results of women are higher than those of men; p = 0.027, t (232) = 2.413)/ Mean 142.96 > Mean 137,87); but shows no significant differences for condition dependent children (p = 0.374), and area of living (p = 0.244) (Table 2).
|
Number of children |
|
N |
Mean |
Std. Deviation |
Std. Error Mean |
|
Coping styles |
I have children |
98 |
141,051 |
13,64829 |
1,37869 |
|
I do not have childern |
136 |
141,875 |
15,37937 |
1,31877 |
|
|
Area of living |
|
N |
Mean |
Std. Deviation |
Std. Error Mean |
|
Coping styles |
Urban |
161 |
140,9503 |
14,9749 |
1,18019 |
|
Rural |
73 |
142,8082 |
13,93702 |
1,6312 |
|
|
Gender (*) |
|
N |
Mean |
Std. Deviation |
Std. Error Mean |
|
Coping styles |
Women |
168 |
142,9643 |
13,25787 |
1,02287 |
|
Men |
66 |
137,8788 |
17,30230 |
2,12977 |
Significant p at the 0.05 level (2-tailed).
Distribution of optimism_pesimism levels shows no significant differences for any of the analised conditions ( p = 0.181 for the gender condition; p = 0.161 for dependent children condition; and p = 0.078 for the area of living condition) (Table no.3).
|
Number of children |
|
N |
Mean |
Std. Deviation |
Std. Error Mean |
|
Optimism_pessimism |
I have childern |
98 |
13,4082 |
3,49915 |
,35347 |
|
I do not have childern |
136 |
14,2647 |
4,15128 |
,35597 |
|
|
Area of living |
|
N |
Mean |
Std. Deviation |
Std. Error Mean |
|
Optimism_pessimism |
Urban |
161 |
14,2484 |
4,06975 |
,32074 |
|
Rural |
73 |
13,1507 |
3,42649 |
,40104 |
|
|
Gender |
|
N |
Mean |
Std. Deviation |
Std. Error Mean |
|
Optimism_pessimism |
Women |
168 |
14,0476 |
3,86107 |
,29789 |
|
Men |
66 |
13,5455 |
4,02753 |
,49575 |
Anova >One-Way >Variance >Analysis
There were significant differences in used coping strategies between the participants’ results according to the age condition (in the sense that the results of those over 65 years are significantly higher than the results of those in the other categories: p = 0.033).
There were no significant differences of used coping strategies between the participants’ results according to the conditions: civil status (p = 0.835), living conditions (p = 0.487), and working place (p = 0.069) (Table 4).
|
Age |
Sum of Squares |
df |
Mean Square |
F |
Sig. |
|
Between Groups |
1855,825 |
3 |
618,608 |
2,953 |
,033 |
|
Within Groups |
48182,466 |
230 |
209,489 |
|
|
|
Total |
50038,291 |
233 |
|
|
|
|
Civil status |
Sum of Squares |
df |
Mean Square |
F |
Sig. |
|
Between Groups |
314,675 |
4 |
78,669 |
,362 |
,835 |
|
Within Groups |
49723,615 |
229 |
217,134 |
|
|
|
Total |
50038,291 |
233 |
|
|
|
|
Living conditions |
Sum of Squares |
df |
Mean Square |
F |
Sig. |
|
Between Groups |
525,609 |
3 |
175,203 |
,814 |
,487 |
|
Within Groups |
49512,682 |
230 |
215,273 |
|
|
|
Total |
50038,291 |
233 |
|
|
|
|
Working place |
Sum of Squares |
df |
Mean Square |
F |
Sig. |
|
Between Groups |
1859,288 |
4 |
464,822 |
2,209 |
,069 |
|
Within Groups |
48179,003 |
229 |
210,389 |
|
|
|
Total |
50038,291 |
233 |
|
|
|
There were significant differences in the optimism_pesimism levels according to the age condition (in the sense that the results of category 46-65 years are significantly higher than those in the other categories: p = 0.017), and according to the working place condition (in the sense that the results of those working from home are significantly higher than the results from the other categories: p = 0.032).
There were no significant differences between the participants’ results according to the conditions: civil status (p = 0.220), and living conditions (p = 0.745) (Table 5).
|
Age |
Sum of Squares |
df |
Mean Square |
F |
Sig. |
|
Between Groups |
154,523 |
3 |
51,508 |
3,483 |
,017 |
|
Within Groups |
3401,409 |
230 |
14,789 |
|
|
|
Total |
3555,932 |
233 |
|
|
|
|
Civil status |
Sum of Squares |
df |
Mean Square |
F |
Sig. |
|
Between Groups |
87,460 |
4 |
21,865 |
1,444 |
,220 |
|
Within Groups |
3468,472 |
229 |
15,146 |
|
|
|
Total |
3555,932 |
233 |
|
|
|
|
Living conditions |
Sum of Squares |
df |
Mean Square |
F |
Sig. |
|
Between Groups |
18,974 |
3 |
6,325 |
,411 |
,745 |
|
Within Groups |
3536,958 |
230 |
15,378 |
|
|
|
Total |
3555,932 |
233 |
|
|
|
|
Working place |
Sum of Squares |
df |
Mean Square |
F |
Sig. |
|
Between Groups |
159,043 |
4 |
39,761 |
2,680 |
,032 |
|
Within Groups |
3396,889 |
229 |
14,834 |
|
|
|
Total |
3555,932 |
233 |
|
|
|
Linear >Regression >Analysis
In the linear regression analysis we verified the influence of the predictor’s optimism (Model I), respectively optimism and pessimism (Model II) on the variable coping styles used by the participants during the Covid isolation period 19.
Model I (optimism) offers a higher predictive power for active coping strategies (R²aj = .143, p<.05); planning (R²aj = .169, p<.05); positive reinterpretation (R²aj = .286, p<.05); acceptance (R²aj = .135, p<.05); and religiosity (R²aj = .061, p<.05) (Table 6).
|
Dependent Variable: coping strategy - active coping |
|||||||||
|
Model |
R |
R Square |
Adjusted R Square |
Std. Error >of the Estimate |
Change Statistics |
||||
|
R Square >Change |
F Change |
df1 |
df2 |
Sig. F Change |
|||||
|
1 |
,382a |
,146 |
,142 |
2,20812 |
,146 |
39,560 |
1 |
232 |
,000 |
|
2 |
,387b |
,150 |
,143 |
2,20735 |
,004 |
1,163 |
1 |
231 |
,282 |
|
Dependent Variable: coping strategy - planning |
|||||||||
|
Model |
R |
R Square |
Adjusted R Square |
Std. Error >of the Estimate |
Change Statistics |
||||
|
R Square >Change |
F Change |
df1 |
df2 |
Sig. F Change |
|||||
|
1 |
,416a |
,173 |
,169 |
2,41400 |
,173 |
48,526 |
1 |
232 |
,000 |
|
2 |
,419b |
,176 |
,169 |
2,41507 |
,003 |
,794 |
1 |
231 |
,374 |
|
Dependent Variable: coping strategy - positive reinterpretation |
|||||||||
|
Model |
R |
R Square |
Adjusted R Square |
Std. Error >of the Estimate |
Change Statistics |
||||
|
R Square Change |
F Change |
df1 |
df2 |
Sig. F Change |
|||||
|
1 |
,536a |
,288 |
,285 |
2,20727 |
,288 |
93,728 |
1 |
232 |
,000 |
|
2 |
,541b |
,292 |
,286 |
2,20466 |
,005 |
1,550 |
1 |
231 |
,214 |
|
Dependent Variable: coping strategy - acceptance |
|||||||||
|
Model |
R |
R Square |
Adjusted R Square |
Std. Error >of the Estimate |
Change Statistics |
||||
|
R Square >Change |
F Change |
df1 |
df2 |
Sig. F Change |
|||||
|
1 |
,372a |
,139 |
,135 |
2,26522 |
,139 |
37,327 |
1 |
232 |
,000 |
|
2 |
,378b |
,143 |
,135 |
2,26481 |
,004 |
1,084 |
1 |
231 |
,299 |
|
Dependent Variable: coping strategy - religiosity |
|||||||||
|
Model |
R |
R Square |
Adjusted R Square |
Std. Error >of the Estimate |
Change Statistics |
||||
|
R Square >Change |
F Change |
df1 |
df2 |
Sig. F Change |
|||||
|
1 |
,249a |
,062 |
,058 |
3,16245 |
,062 |
15,336 |
1 |
232 |
,000 |
|
2 |
,264b |
,070 |
,061 |
3,15651 |
,008 |
1,873 |
1 |
231 |
,172 |
Model II (optimism_pessimism) offers a higher predictive power for coping strategies seeking social-instrumental support (R²aj = .084, p<.05); seeking social-emotional support (R²aj = .064, p<.05); negation (R²aj = .199, p<.05); emotional discharge (R²aj = .106, p<.05); behavioral passivity (R²aj = .206, p<.05), and recourse to alcohol-drugs (R²aj = .042, p<.05) (Table 7).
|
Dependent Variable: coping strategy - seeking social-instrumental support |
|||||||||
|
Model |
R |
R Square |
Adjusted R Square |
Std. Error >of the Estimate |
Change Statistics |
||||
|
R Square >Change |
F Change |
df1 |
df2 |
Sig. F Change |
|||||
|
1 |
,259a |
,067 |
,063 |
2,49765 |
,067 |
16,650 |
1 |
232 |
,000 |
|
2 |
,303b |
,092 |
,084 |
2,46916 |
,025 |
6,386 |
1 |
231 |
231 |
|
Dependent Variable: coping strategy - seeking social-emotional support |
|||||||||
|
Model |
R |
R Square |
Adjusted R Square |
Std. Error >of the Estimate |
Change Statistics |
||||
|
R Square >Change |
F Change |
df1 |
df2 |
Sig. F Change |
|||||
|
1 |
,200a |
,040 |
,036 |
2,58256 |
,040 |
9,657 |
1 |
232 |
,002 |
|
2 |
,268b |
,072 |
,064 |
2,54488 |
,032 |
7,921 |
1 |
231 |
,005 |
|
Dependent Variable: coping strategy - negation |
|||||||||
|
Model |
R |
R Square |
Adjusted R Square |
Std. Error >of the Estimate |
Change Statistics |
||||
|
R Square >Change |
F Change |
df1 |
df2 |
Sig. F Change |
|||||
|
1 |
,306a |
,094 |
,090 |
2,67636 |
,094 |
24,026 |
1 |
232 |
,000 |
|
2 |
,454b |
,206 |
,199 |
2,51082 |
,112 |
32,600 |
1 |
231 |
,000 |
|
Dependent Variable: coping strategy - emotional discharge |
|||||||||
|
Model |
R |
R Square |
Adjusted R Square |
Std. Error >of the Estimate |
Change Statistics |
||||
|
R Square >Change |
F Change |
df1 |
df2 |
Sig. F Change |
|||||
|
1 |
,184a |
,034 |
,030 |
2,57461 |
,034 |
8,130 |
1 |
232 |
,005 |
|
2 |
,337b |
,114 |
,106 |
2,47137 |
,080 |
20,788 |
1 |
231 |
,000 |
|
Dependent Variable: coping strategy - behavioral passivity |
|||||||||
|
Model |
R |
R Square |
Adjusted R Square |
Std. Error >of the Estimate |
Change Statistics |
||||
|
R Square >Change |
F Change |
df1 |
df2 |
Sig. F Change |
|||||
|
1 |
,384a |
,148 |
,144 |
2,55978 |
,148 |
40,206 |
1 |
232 |
,000 |
|
2 |
,461b |
,213 |
,206 |
2,46526 |
,065 |
19,131 |
1 |
231 |
,000 |
|
Dependent Variable: coping strategy - recourse to alcohol-drugs |
|||||||||
|
Model |
R |
R Square |
Adjusted R Square |
Std. Error >of the Estimate |
Change Statistics |
||||
|
R Square >Change |
F Change |
df1 |
df2 |
Sig. F Change |
|||||
|
1 |
,153a |
,023 |
,019 |
,92618 |
,023 |
5,543 |
1 |
232 |
,019 |
|
2 |
,223b |
,050 |
,042 |
,91546 |
,027 |
6,464 |
1 |
231 |
,012 |
For three coping strategies (elimination of competing activities, retention from action, and mental passivity) the variance explained by both models was not significant.
The level of optimism was higher compared to pessimism.
The most used coping strategies were: a positive reinterpretation, acceptance, planning, and active coping (focused on problem coping strategies). These were followed by: orientation towards religion, seeking social-emotional support, and retention from action (focused on emotion coping strategies). Less used coping strategies were behavioral passivity, and denial, the last resort being the use of alcohol or drugs.
Significant correlations (negative and positive) were recorded between most of the coping strategies and the optimism_pesimism dimensions and are also confirmed by the Anova one way, and Crosstab analyzes.
T-test for independent samples indicates that distributions of coping strategies show significant differences for gender condition (the results of women are higher than those of men), but shows no significant differences for dependent children, and area of living conditions. On the other hand distribution of optimism_pesimism levels shows no significant differences for any of the analyzed conditions ( the gender, the dependent children, and the area of living).
Anova One Way variance analysis indicates that there were significant differences of used coping strategies between the participants’ results according to the age condition (in the sense that the results of those over 65 years are significantly higher than the results of those in the other categories); but there were no significant differences of used coping strategies between the participants’ results according to the conditions: civil status, living conditions, and working place. Similarly there were significant differences in the optimism_pesimism levels according to the age condition (in the sense that the results of category 46-65 years are significantly higher than those in the other categories), and according to the working place condition (in the sense that the results of those working from home are significantly higher than those in the other categories); but there were no significant differences between the participants’ results according to the conditions: civil status, and living conditions.
Multiple regression indicates an increase in the predictive power of model II (including optimism and pessimism predictors) compared to model I (including only optimism predictor).
Model II explains better the variance of coping strategies mostly focused on emotion type (seeking social-instrumental support, seeking social-emotional support, denial, emotional discharge, behavioral passivity, and resorting to alcohol-drugs); while model I explains better the variance of coping strategies focused on problem type (active coping, planning, positive reinterpretation, acceptance and to a lesser extent orientation towards religion).
The present study confirms the importance of the optimism_ pesimism dimentions, as influencing factors regarding the coping strategies adopted during Covid19.
The hypothesis, that people with a higher degree of optimism will mainly adopt problem-oriented coping strategies, while more pessimistic people will adopt emotion-oriented coping strategies during the targeted period, is confirmed. During the isolation period of the Covid 19 pandemic, the level of optimism was higher (52.8%) than the level of pessimism (47.2%). Also, the most used coping strategies were problem-focused type (positive reinterpretation, acceptance, planning, and active coping), while emotion-focused coping strategies type has been less used (orientation towards religion, seeking social-emotional support, and retention from the action. The least used coping strategies were behavioral passivity, denial, and the use of alcohol or drugs. These results correlated with the increased level of optimism among participants may indicate a relatively high level of participant’s morale, or the existence of positive expectations. On the other hand, the correlations of weak values with a positive and negative sign, between the coping strategies adopted and the optimism and pessimism levels, can be due to the state of felt confusion regarding the resolution of the crisis, respectively the confidence of the participants that the measures adopted by authorities will stop the infection, and the difficult state will end soon.
The second hypothesis was only partially confirmed. Indeed, there were significant differences in the optimism_pesimism levels according to the age, and working place conditions (results for optimism of category 46-65 years, working from home were significantly higher than those in the other categories), but there were no significant differences between the participants’ results according to the conditions: civil status, living conditions, gender, dependent children, and area of living. Despite initial considerations, not the youngest but people aged 46-65 showed the highest level of optimism, probably due to the stability associated with the period and position. People who work from home generally had a high level of optimism, due to the time spent with their families in the first Covid 19 isolation period. On the other hand variables like civil status, living conditions, dependent children, area of living, and gender, had no evident influence over the optimism_pesimism level.
Similarly, the third hypothesis was only partially confirmed. Significant differences between different coping strategies were registered only for conditions gender (women using more emotion- focused, while men using more problem-focused strategies), and age (participants over 65 years showing a positive adaptation to the isolation conditions probably due to the experience gained in other similar situations from the past); on the other hand conditions like civil status, living conditions, and working place, had a less obvious role regarding the coping strategies used during this period.
The fourth hypothesis was unconfirmed. Men and young people did not experience higher levels of optimism, on the contrary, differences between men and women were unclear, and people around the age of 45 showed a faster accommodation, even if limited, to the crisis. Regarding coping strategies, emotion-focused or problem-focused, adopted according to gender and age, this differentiation does not indicate the degree of adaptation to the elements of the crisis. We state this because, despite the theoretical considerations that indicate the positive influence of problem orientation in stressful situations, we believe that the beneficial or negative effects of each approach can be highlighted only after the final settlement of Covid19.
The relation between optimism and pessimism and preferred coping strategies can be confirmed through linear regression analysis, which indicates a stronger role of pessimism on emotion- oriented coping strategies (like seeking social-emotional support, emotional discharge, and behavioral passivity), and a stronger role of optimism on problem-oriented coping strategies (like active coping strategies, planning, and positive reinterpretation), once more confirming the general studies results (Nicholls, 2008). On the other hand, the lack of a clear trend for coping strategies, and optimism and pessimism levels according to most of the demographic conditions (like civil status, living conditions, gender, dependent children, and area of living), can be due to the degree of compliance with the measures imposed by the authorities, or to the uniqueness of the situation and the limitation of the means of intervention available to people through Covid 19 isolation.
The results obtained are intriguing. Although there is a direct relationship between the level of optimism/pessimism and the preference for problem/emotion-oriented coping strategies, and the literature indicates correlations of choices based on gender and age, the results of this study do not indicate relevant differences depending on these conditions. Moreover, those who showed a clear understanding, and sometimes acceptance, of the situation were participants around the age of 45, while demographic variables had little or no influence on behaviors during the Covid first isolation period. Most of the participants seem to be in a continuous search, being unable to find more adequate personal management strategies in this entire period. This may reflect a low adaptation capacity of participants, young people especially, in the sense of lack of combining and changing mechanism between different types of behavior during this period, and can be useful in designing post-crisis management strategies, and new management strategies for the eventuality of secondary pandemic aggravations [1].
One limitation of the research is the way participants are selected, limited to email and social media users. Other elements that generate biases can be the limited number of participants and the unique researcher.
For a better differentiation on coping mechanisms, it is necessary to complete analysis with new scales targeting a wider range of personality or contextual factors (Maftei, 2020), and to conduct comparative investigations with similar studies.
At the same time, it would be useful to explore the influence that the level of optimism-pessimism has on the disease rates, respectively on the severity of the effects, according to the coping strategies adopted during the isolation period.