Author(s): Gerald C. Hsu
This article is Part 8 of the author’s linear elastic glucose behavior study which focuses on the deeper understanding of these two newly defined glucose coefficients, GH.f-modulus and GH.p-modulus. Findings have shown the sensitive relationships with health conditions such as obesity and diabetes and certain lifestyle components, e.g. carbs/sugar intake amount and post-meal walking steps. Hopefully in the near future, he will be able to develop a reasonable and applicable numerical ranges of these two glucose coefficients. He used his measured glucose data and predicted glucose models for both fasting plasma glucose (FPG) and postprandial plasma glucose (PPG) for three patients with chronic diseases over the COVID-19 quarantined period, from 3/1/2020 to 11/10/2020
The consolidated diagram below shows a complicated presentation of multiple components and a variety of results. It is a fourdimensional chart that illustrates the PPG prediction via carbs/ sugar and post-meal walking under the influence of the glucose coefficient, GH.p-modulus, for three clinical cases during this timeframe. This single diagram demonstrates the complete results of this study.
The research of the linear elastic glucose behaviors theory summarizes all of his previous findings from Parts 1 through 7. This article utilizes the clinical cases with different severities of obesity and diabetes.
Through different weights along with differing FPG, the author calculates the GH.f-modulus values for each patient which indicates the relative severity between obesity and diabetes. Furthermore, through the linearity relationship or the linear indication of GH.p-modulus between incremental PPG and carbs/ sugar intake amount, he can connect the complicated components of cars/sugar, exercise, weight or FPG into his final predicted PPG equation.
His developed linear elastic glucose theory inspired by his previously acquired knowledge of engineering theory of elasticity which has been proven useful for diabetes control. These research results from the biomedical linearity situations probably are applicable for ~80% of worldwide diabetes patients. However, for a smaller amount of diabetes patients? hyperglycemic situations, ~20% of the total population whose glucose frequently exceed 200 mg/dL level, a nonlinear plastic theory may need to be developed and then applied to these extreme situations.

This article is Part 8 of the author?s linear elastic glucose behavior study which focuses on the deeper understanding of these two newly defined glucose coefficients, GH.f-modulus and GH.pmodulus. Findings have shown the sensitive relationships with health conditions such as obesity and diabetes and certain lifestyle components, e.g. carbs/sugar intake amount and post-meal walking steps. Hopefully in the near future, he will be able todevelop a reasonable and applicable numerical ranges of these two glucose coefficients. He used his measured glucose data and predicted glucose models for both fasting plasma glucose (FPG) and postprandial plasma glucose (PPG) for three patients with chronic diseases over the COVID-19 quarantined period, from 3/1/2020 to 11/10/2020.
To learn more about the author?s GH-Method: math-physical medicine (MPM) methodology, readers can refer to his article to understand his developed MPM analysis method in [1].
In 2015 and 2016, the author decomposed the PPG waveforms (data curves) into 19 influential components and identified carbs/ sugar intake amount and post-meal walking exercise contributing to approximately 40% of PPG formation, respectively. Therefore, he could safely discount the importance of the remaining ~20% contribution by the 16 other influential components.
In March of 2017, he detected that body weight contributes over 85% to FPG formation. Furthermore, in 2019, he identified that FPG could serve as a good indicator of the pancreatic beta cells? health status; therefore, he can apply the FPG value (more precisely, 97% of FPG value) to serve as the baseline PPG value to calculate the PPG incremental amount in order to obtain the predicted PPG.
In 2019, all of his developed PPG prediction models achieved high percentages of prediction accuracy, but he also realized that his prediction models are too difficult for use by the general public. As a result, he supplemented his complex models with a simple linear equation of predicted PPG [2, 3]. Here is his simple linear formula [4]:
After lengthy research, trial and error, and data tuning, he finally identified the best multipliers for FPG and exercise as 0.97 for M1 and 5.0 for M3. In comparison with PPG, the FPG is a more stabilized biomarker since it is directly related to body weight, not food or exercise. Most of us know that weight reduction is a hard task. However, weight is a calmer and more stabilized biomarker in comparison to glucose which changes from minute to minute with a bigger magnitude of fluctuation. The influence of exercise (specifically, post-meal walking steps) on PPG (41% contribution and >80% negative correlation with PPG) is almost equal to the influence from the carbs/sugar intake amount on PPG (39% contribution and >80% positive correlation with PPG). In terms of intensity and duration, exercise is a rather simple and straightforward subject to study. Walking is especially safe and an effective form of exercise for the majority of diabetes patients, particularly senior citizens.
For the author, these two parameters, FPG and walking, have a lower chance of variation since he is stringent on maintaining his body weight and his daily exercise routine.
On the other hand, the relationship between food nutrition and glucose is a quite complex and difficult subject to fully understand and effectively manage due to many types of available food, in terms of quality and quantity of meals, with different nutritional ingredients, including carbohydrates and sugar contents. For example, in the author?s developed database of food material and nutritional ingredients, it contains over six million data. As a result, the author decided to implement two multipliers, M1 for FPG and M3 for exercise, as the two fixed ?constants?, and keep M2 as the only ?variable? in his PPG prediction equation. Therefore, an easier linear equation for predicted PPG is listed below:
Predicted PPG
= (0.97*FPG)+(Carbs&sugar * M2) - (post-meal walking k-steps
* 5)
Term 1:
GH.p-modulus = M2
Term 2:
The incremental PPG from diet
= Predicted PPG - baseline PPG:
Glucose Coefficient for PPG:
GH.p-modulus
= (Incremental PPG)/(Carbs&sugar)
Glucose Coefficient for FPG:
GH.f-modulus = (FPG) / (Weight)
After combining the above 2 terms and 2 glucose coefficients, he has finally obtained the following linear equation of predicted PPG:
By using this equation, a patient only needs the data of body weight, carbs & sugar intake amount, and post-meal walking steps to calculate the predicted PPG without obtaining any measured glucose data.
Prior to his medical research work, he was an engineer in the various fields of structural engineering (aerospace, naval defense, and earthquake engineering), mechanical engineering (nuclear power plant equipments, and computer-aided-design), and electronics engineering (computers, semiconductors, graphic software, and software robot).
The two biomedical coefficients of GH-modulus mentioned above were inspired by his prior knowledge in the theory of elasticity in strengths of engineering materials which has the following engineering equation developed in 1807 by a British scientist, Thomas Young:
Stress = Young?s modulus * Strain(Note: Young?s modulus and the two biomedical coefficients, both GH.f-modulus and GH.p-modulus, are reciprocal to each other.)
The following excerpts come from the internet public domain, including Google and Wikipedia:
?Strain - ?:
Strain is the "deformation of a solid due to stress" - change in
dimension divided by the original value of the dimension - and
can be expressed as
? = dL / L
where
? = strain (m/m, in/in)
dL = elongation or compression (offset) of object (m, in)
L = length of object (m, in)
Stress - ?:
Stress is force per unit area and can be expressed as
? = F / A
where
? = stress (N/m2, lb/in2, psi)
F = applied force (N, lb)
A = stress area of object (m2, in2)
E, Young's modulus:
It can be expressed as:
= ? / ? = (F / A) / (dL / L)
where
E = Young's Modulus of Elasticity (Pa, N/m2, lb/in2, psi) was
named after the 18th-century English physicist Thomas Young.
Elasticity is a property of an object or material indicating how it will restore it to its original shape after distortion. A spring is an example of an elastic object - when stretched, it exerts a restoring force which tends to bring it back to its original length (Figure 1).
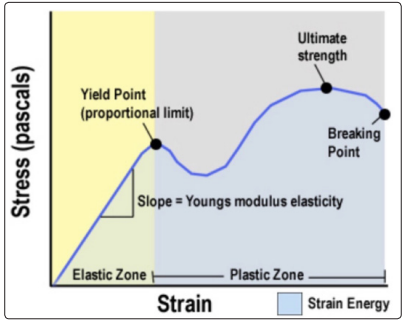
Figure 1: Stress-Strain-Young?s modulus, Elastic Zone vs. Plastic Zone
When the force is going beyond the elastic limit of material, it is into a plastic zone which means even when force is removed, the material will not return back to its original state (Figure 1). Based on various experimental results, the following table lists some Young?s modulus associated with different materials:
Nylon: 2.7 GPa
Concrete: 17-30 GPa
Glass fibers: 72 GPa
Copper: 117 GPa
Steel: 190-215 GPa
Diamond: 1220 GPa
Young?s modules in the above table are ranked from soft material (low E) to stiff material (higher E).?
Professor James Andrews taught the author linear elasticity at the University of Iowa, and Professor Norman Jones taught him nonlinear dynamic plasticity at Massachusetts Institute of Technology. These two great academic mentors provided him the necessary foundation knowledge to understand these two important subjects in engineering.
Case A (the author) is a 73-year-old male with a 25-year history of T2D. He began collecting his carbs/sugar intake amount and post-meal walking steps on 7/1/2015. Since 7/15/2015, he has collected 6 data per day, 1 FPG, 3 PPG, carb/sugar, and post-meal walking steps. He utilized these data to conduct his prior research work on the subject of linear elastic glucose study [7].
In addition, on 5/5/2018, he started to use a continuous glucose monitoring (CGM) sensor device to collect 96 glucose data each day.
The timeframe from 7/1/2015 to 11/10/2020 is his ?best-controlled? diabetes period, where his average daily glucoses is maintained at 116 mg/dL (<120 mg/dL). He named this as his ?linear elastic zone? of diabetes health. It should also be noted that in 2010, his average glucose was 280 mg/dL and HbA1C was 10%, while taking three diabetes medications. Please note that the strong chemical interventions from various diabetes medications would seriously alter glucose physical behaviors. He called the period prior to 2015 as his ?nonlinear plastic zone? of diabetes health.
Case B is a 73-year-old female with a 22-year history of T2D. She began to collect her glucose data via finger-piercing method (finger glucose) since 1/1/2014. However, she does not keep a detailed record of her diet and exercise. Both patients eat almost the same meals prepared by the author, except that she consumes more meat which partially affects her hyperlipidemia and hypertension conditions, not her diabetes conditions. From the viewpoint of this diabetes research, he decided to use 80% of the Case A?s carbs/sugar amount for her and use 50% of the Case A?s post-meal walking steps for her. She also began using the same brand of CGM device to collect her sensor glucose data at the same rate of 96 data per day since 1/1/2020.
Case C is a 47-year-old male with a 4-year history of T2D. He started to collect his glucose data using the same model of CGM sensor on 3/1/2020. Through a telephone interview, the author discovered that over the past 8-month period, his average carbs/ sugar intake amount is about the same amount as Case A, andhis average post-meal walking steps is at ~25% level compared to Case A.
It should be mentioned here, other than Case A, who has collected a complete dataset of diet and exercise, Case B and Case C are using the best guess-estimated percentages of Case A?s amount of diet and exercise. Therefore, these data differences would definitely create some degree of result deviation.
In order to maintain data consistency for a fair and accurate
comparison, the author took the CGM sensor glucose data from
Cases A, B, and C from 3/1/2020 through 11/10/2020 to use them
in this analysis. The reason for using the sensor glucose data over
finger glucose is because they are 13% to 18% higher. Therefore,
the sensor data would be more conservative in terms of diabetes
severity. Finally, the author calculated the two GH-modulus values
via the approach of matching the predicted PPG values with the
yardstick of measured PPG values.
It should be mentioned here that, regardless his various models
developed and analytical methods used, his predicted glucose
values have reached a 98.5% to 99.9% of accuracies in comparison
with his measured glucoses.
By utilizing the concept of Young?s modulus and stress/strain, over the past 30 days, the author has initiated and engaged in this linear elastic glucose behaviors research. The following highlights outline the findings during this process.
First, he discovered that there is a ?pseudo-linear? relationship
existing between carbs & sugar intake amount and incremental
PPG amount. Therefore, he defined a new glucose coefficient of
GH.p-modulus for PPG.
Second, similar to Young?s modulus relating to stiffness of
engineering inorganic materials, he found that the GH.p-modulus is
depended upon the patient?s severity level of obesity and diabetes
in terms of glucose sensitivity to carbs/sugar intake amount.
Third, comparable to the GH.p-modulus for PPG, he uncovered
a similar pseudo-linear relationship existed between weight and
FPG. Therefore, he defined another new glucose coefficient of
GH.f-modulus for FPG.
Fourth, he inserted these two glucose coefficients, GH.p-modulus
and GH.f-modulus, into the PPG prediction equation to remove
the burden of collecting measured glucoses by patients.
Fifth, by experimenting and calculating many predicted PPG values
over a variety of time length based on three patients with different
health conditions, he finally revealed that GH.p-modulus seems to be
?near-constant? or ?pseudo-linearized? over a short period of 3 to 4
months. This short period is compatible with the known lifespan of
red blood cells, which are living organic materials, that are different
from engineering materials, such as steel or concrete. The same
finding can also be observed in the monthly GH.p-modulus values
from this study over the 10-months in the COVID-19 period.
There are 5 figures in this article which demonstrate the following 4 comparisons over the COVID-19 period from 3/1/2020 to 11/10/2020.
Figure 2 depicts the relationship between weight and FPG via GH.f-modulus among the three cases. It also indicates the severity of obesity and diabetes of each case.
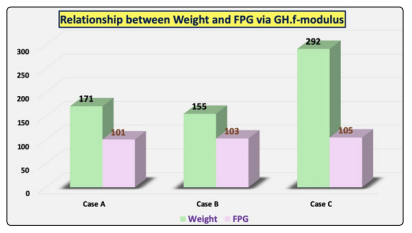
Figure 2: Relationship between weight and FPG via GH.fmodulus during COVID-19 period (3/1/2020 - 11/10/2020)
Figure 3 reflects carbs/sugar intake amount (grams) and post-meal walking (k-steps) of the three cases which are major influential factors relating to PPG via GH.p-modulus.
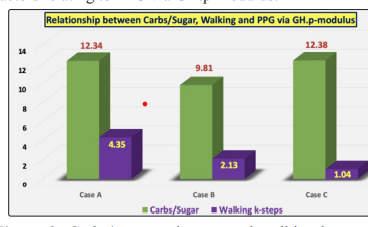
Figure 3: Carbs/sugar and post-meal walking k-steps during COVID-19 period (3/1/2020 - 11/10/2020)
Figure 4 reveals the relationship between GH.p-modules and PPG among the three cases. It indicates that the magnitudes of GH.p-modulus is proportional to PPG values.
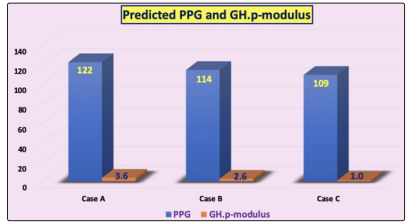
Figure 4: Relationship between Predicted PPG and GH.pmodulus during COVID-19 period (3/1/2020 - 11/10/2020)
Figure 5 demonstrates graphically the comparison between GH.fmodules and GH.p-modules. GH.f-modules indicates the severity of obesity of each patient, where Case C is considered extremely obese, Case B is over-weight, and Case A is normal weight. GH.pmodules indicates the severity of diabetes of each case, Case A(3.6) is the most severe diabetes patient, Case B (2.6) is a moderate diabetes patient, and Case C (1.0) has the least severity of diabetes. More precisely, GH.p-modulus shows the relationship between diabetes severity (i.e. PPG sensitivity) and glucose sensitivity to carbs/sugar intake amount under the assumption of constant level of exercise for one specific patient. A variety of food is more complicated than an assortment of exercises, because it is difficult for people to change their daily routines.
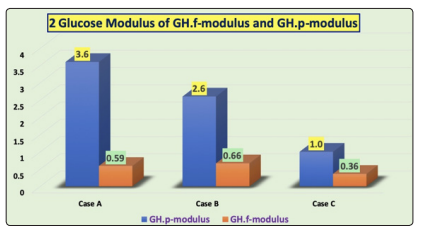
Figure 5: 2 Glucose coefficients of GH.f-modulus and GH.pmodulus during COVID-19 period (3/1/2020 - 11/10/2020)
Figure 6 indicates that the values of both (Incremental PPG) and (Carbs * GH.p-modulus) are almost equal, for the three clinical cases, during the COVID-19 period. This has further proved the linearity of elastic glucose behaviors among different patients.
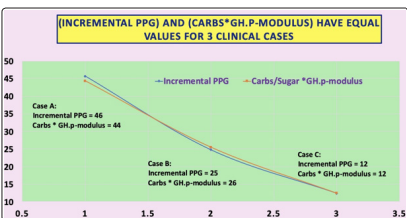
Figure 6: (Incremental PPG) and (Carbs * GH.p-modulus) have equal values of three clinical cases during COVID-19 period (3/1/2020 - 11/10/2020)
The consolidated diagram of Figure 7 shows a complicated presentation of multiple components and a variety of results. It is a four-dimensional chart that illustrates the PPG prediction via carbs/sugar and post-meal walking under the influence of the glucose coefficient, GH.p-modulus, for three clinical cases during this timeframe. This figure has demonstrated the complicated results of this study in a single diagram.
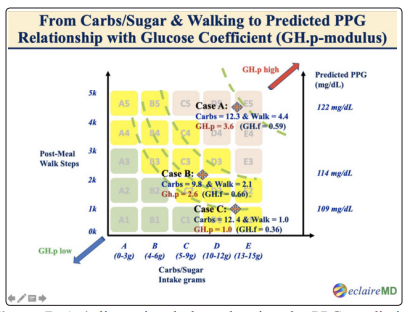
Figure 7: A 4-dimensional chart showing the PPG prediction via carbs/sugar and post-meal walking with Glucose coefficient of GH.p-modulus for 3 clinical cases during COVID-19 period (3/1/2020 - 11/10/2020)
The research of the linear elastic glucose behaviors theory
summarizes all of his previous findings from Parts 1 through 7.
This article utilizes the clinical cases with different severities of
obesity and diabetes.
Through different weights along with differing FPG, the author
calculates the GH.f-modulus values for each patient which
indicates the relative severity between obesity and diabetes.
Furthermore, through the linearity relationship or the linear
indication of GH.p-modulus between incremental PPG and carbs/
sugar intake amount, he can connect the complicated components
of cars/sugar, exercise, weight or FPG into his final predicted PPG
equation [5, 6 & 8-16].
His developed linear elastic glucose theory inspired by his
previously acquired knowledge of engineering theory of elasticity
which has been proven useful for diabetes control. These research
results from the biomedical linearity situations probably are
applicable for ~80% of worldwide diabetes patients. However,
for a smaller amount of diabetes patients? hperglycemic situations,
~20% of the total population whose glucose frequently exceed 200
mg/dL level, a nonlinear plastic theory may need to be developed
and then applied to these extreme situations.