Author(s): Gerald C. Hsu
The author attempts to identify three major and two secondary influential factors of body weight along with its impact on six different glucose components using Pearson correlation coefficient “R” of statistics to calculate different degree of association between two datasets. This investigation utilized the daily weight and glucose data in conjunction with six lifestyle details, including food, exercise, water, sleep, and weather temperature, during a period of ~6 years from 1/1/2015 to 9/11/2020
After analyzing the data on the impact of body weight, food quantity, exercise, and water intake have moderate influences. The hours and quality of sleep has a negligible effect on weight, while weather temperature almost has no influence at all. Another conclusion is that body weight has moderate correlation coefficients with all of these six glucose components; therefore, body weight definitely has a strong impact on glucoses.
Obesity is the root cause of three chronic diseases such as diabetes, hypertension, and hyperlipidemia. They can cause many other complications including, but not limited to, cardiovascular disease (CVD), stroke, chronic kidney disease (CKD), foot ulcer, diabetic retinopathy, hypothyroidism, dementia, and even cancer. As a result, individuals should focus on weight control as their first priority to be able to control chronic diseases.
In the United States, approximately 36.5% of adults are obese and another 32.5% are overweight. In other words, there are only 31% of American adults within the normal range of body weight (BMI < 25). The author weighed 220 lbs. (110 kg) with a BMI of 32 in 2010. From 2015 to 2020, his average weight was reduced to 173 lbs. (78.6 kg) with a BMI of 25.54. Recently, his weight has further decreased to 169 lbs. (76.8 kg) with a BMI of 24.95. From his 10-year journey, he definitely understands how hard it is to reduce his body weight. During the past decade, he conducted research on metabolism, endocrinology, and various complications induced by chronic diseases; however, he was not able to identify a clear and significant influential factor for weight control. Occasionally, he feels that weight seems to have a mind on its own randomly fluctuating according to its will. Of course, he also realized that weight must have certain controlling factors within itself.
At least, in this study, he is able to prove his intuitive feeling that
“meal portion” or “food quantity” is one of the most important
contributing factors, even with a moderate R of 47%. In addition,
adequate exercise and sufficient water intake assisted with his
weight reduction.
With the higher correlation coefficients between weight and
glucose components have been demonstrated many times in his
previous published papers, he discovered the most efficient way
to control his glucose is to concentrate on his body weight first.
The author attempts to identify three major and two secondary influential factors of body weight along with its impact on six different glucose components using Pearson correlation coefficient “R” of statistics to calculate different degree of association between two datasets. This investigation utilized the daily weight and glucose data in conjunction with six lifestyle details, including food, exercise, water, sleep, and weather temperature, during a period of ~6 years from 1/1/2015 to 9/11/2020.
To learn more about the GH-Method: math-physical medicine (MPM) research methodology, readers can review his specific article, Biomedical research methodology based on GH-Method: math-physical medicine (No. 310), to understand his MPM analysis method.
The author started measuring his body weight since 1/1/2012. He measures weight twice a day, once in early morning when he wakes up and at night when he is ready to go to sleep. In addition, he uses the traditional finger-piercing and test strip (Finger glucose) to measure his daily glucoses. He measures his glucoses four times each day, once in early morning (FPG) when he wakes up from sleeping, and three times at two-hours after each meal (PPG).
In order to estimate his metabolism situation using his developed mathematical metabolism index (MI) model, he needs to collect many of his lifestyle details. Most of his lifestyle data collection started approximately on 1/1/2015. The following six items are required to conduct this particular study
1. Food quantity: percentage of his normal meal portion
2. Daily walking steps
3. Daily water intake amount
4. Sleep hours
5. Sleep quality: includes 9 elements
6. Ambient weather temperature: the highest temperature around
noon time each day
Here is an excerpt from Wikipedia:
A correlation coefficient is a numerical measure of some type of correlation, meaning a statistical relationship between two variables. The variables may be two columns of a given data set of observations, often called a sample, or two components of a multivariate random variable with a known distribution. Several types of correlation coefficient exist, each with their own definition and own range of usability and characteristics.
The Pearson product-moment correlation coefficient, also known as r, R, or Pearson’s r, is a measure of the strength and direction of the linear relationship between two variables that is defined as the covariance of the variables divided by the product of their standard deviations. This is the best-known and most commonly used type of correlation coefficient. When the term “correlation coefficient” is used without further qualification, it usually refers to the Pearson product-moment correlation coefficient. Sometimes, it is also called the “bivariate correlation” which is a statistic that measures linear correlation between two variables X and Y. It has a value between +1 and -1. A value of +1 is total positive linear correlation, 0 is no linear correlation, and -1 is total negative linear correlation.
All of the variables mentioned above including weight, glucose, and six lifestyle details are expressed in a form of the “time-series curve”. These curves have two axes. The horizontal x-axis is time (date) from 1/1/2015 throughout 9/11/2020 and the vertical y-axis is the amount of weight, glucose, or lifestyle details corresponding to different date on the x-axis. In order to avoid the “over-presentation” of the results, the author does not include all of these time-series curves in the graphs section in this paper. As an alternative, he presents a summarized data table that includes all of the important and conclusive data related to the variables such as weight, glucose, lifestyles, and their corresponding correlation coefficients.
In Figure 1, it shows the summarized background data of this study. As a result, Figures 2, 3, and 4 are produced based on this background data table.
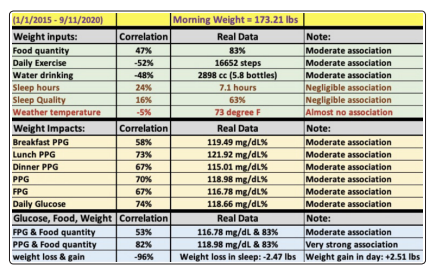
Figure 1: Background data table (1/1/2015 - 9/11/2020)
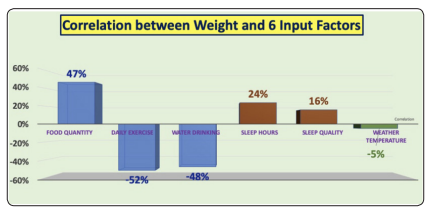
Figure 2: 6 R values between weight and 6 influential factors (1/1/2015 - 9/11/2020)
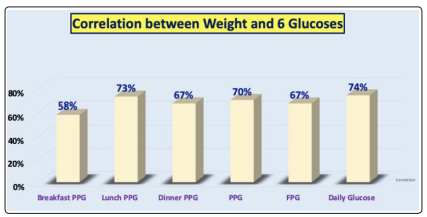
Figure 3: 6 R values of weight impact on 6 glucose components (1/1/2015 - 9/11/2020)
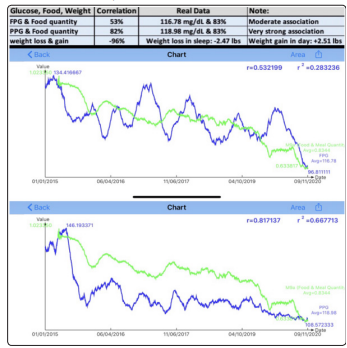
Figure 4: Time-series curves of weight vs. FPG and weight vs. PPG (1/1/2015 - 9/11/2020)
Figure 2 only shows the R between Weight and six lifestyle inputs. The correlation coefficient R can only be calculated between two variables. The objectives are to identify what influential factors that actually control his body weight. With this purpose in mind, his weight variable becomes the common denominator of this entire analysis. Consequently, he went through many calculations of R to search for the significant influential factors of weight. At the end, he only identified five significant factors. The R of the ambient weather temperature is almost zero percent (-5%); therefore, it does not have a noticeable influence on weight. During the process of searching and calculation, he also discovered evidence regarding the impact of weight on glucoses associated with his three daily meals. As shown in Figure 3, body weight has different degrees of significant, influences on all of the six glucose components, including breakfast PPG, lunch PPG, dinner PPG, daily PPG, FPG, and daily average glucose.
The following descriptions highlight the conclusions drawn from Figures 1, 2, and 3. It is expressed in terms of individual correlation coefficient percentage of R.
Food quantity: +47% ( the more you eat will increase your weight)
Daily walking steps: -52% (the more you exercise will lower
your weight with a recommendation within 20,000 steps per day)
Water intake: -48% (the more water you drink will lower your
weight with a recommendation within 3,000 cc per day)
Sleep hours: +24%
Sleep quality: +16%
Weather temperature: -5%
Food quantity, exercise level, and water intake amount have moderate influences on body weight. In contrast, sleep has a negligible influence on weight, while weather temperature almost has no influence (-5%).
Breakfast PPG: 58%
Lunch PPG: 73%
Dinner PPG: 67%
PPG: 70%
FPG: 67%
Daily average glucose: 74%
Body weight has moderate correlation coefficients with all of the six glucose components; therefore, weight definitely has a strong impact on glucoses. This conclusion can be observed via the two time-series curves between weight vs. FPG and weight vs. PPG (Figure 4).
In Figure 5, it depicts an interesting finding in this weight study. His average weight gain is +2.51 lbs. during the daytime and his average weight loss is -2.47 lbs. during his sleep time over this ~6-year period. These two values almost cancel out each other. As a result, his weight has been maintained around 173 lbs. with a BMI of ~25 for the past ~6 years. This fact further demonstrate an important message regarding his satisfaction with the overall metabolism situation because body weight contains many vital information for both medical conditions and lifestyle details.
Obesity is the root cause of three chronic diseases such as diabetes, hypertension, and hyperlipidemia. They can cause many other complications including, but not limited to, cardiovascular disease (CVD), stroke, chronic kidney disease (CKD), foot ulcer, diabetic retinopathy, hypothyroidism, dementia, and even cancer. As a result, individuals should focus on weight control as their first priority to be able to control chronic diseases.
In the United States, approximately 36.5% of adults are obese and another 32.5% are overweight. In other words, there are only 31% of American adults within the normal range of body weight (BMI < 25). The author weighed 220 lbs. (110 kg) with a BMI of 32 in 2010. From 2015 to 2020, his average weight was reduced to 173 lbs. (78.6 kg) with a BMI of 25.54. Recently, his weight has further decreased to 169 lbs. (76.8 kg) with a BMI of 24.95. From his 10- year journey, he definitely understands how hard it is to reduce his body weight. During the past decade, he conducted research on metabolism, endocrinology, and various complications induced by chronic diseases; however, he was not able to identify a clear and significant influential factor for weight control. Occasionally, he feels that weight seems to have a mind on its own randomly fluctuating according to its will. Of course, he also realized that weight must have certain controlling factors within itself.
At least, in this study, he is able to prove his intuitive feeling that meal portion or food quantity is one of the most important contributing factors, even with a moderate R of 47%. In addition, adequate exercise and sufficient water intake assisted with his weight reduction.
With the higher correlation coefficients between weight and glucose components have been demonstrated many times in his previous published papers, he discovered the most efficient way to control his glucose is to concentrate on his body weight first [1-8].