Author(s): Olga Pérez Maliuk, Igor Pérez Maliuk and Alvaro Laurencio Pérez*
For the year 2017, renewable energy in the world through photovoltaic systems constitutes around 21% of the total energy generated through renewable sources. In this work, the impact represented by the proposal of a photovoltaic system connected to the grid in terms of reducing losses was analyzed. In the study, the calculation tools PVSyst and DIgSILENT PowerFactory were used to determine the power generation of the photovoltaic installation. Using the Radial 7.7 tool, the power losses were determined. The energy losses of the line were determined using empirical equations developed in the literature discussed. The commissioning of the installation represents a saving of 397 MWh/year. The impact that the installation represents on the grid is represented by a decrease in electrical energy losses and not in the decrease in power losses.
According to, for the year 2017, renewable energy in the world through photovoltaic systems constitutes around 21% of the total energy generated through renewable sources [1]. The use of renewable sources of energy has been increasing significantly in recent years. Currently, the international community is committed to adopting sustainable development models, where efficiency figures as a key paradigm to achieve the proposed goals and in this scenario the losses inherent to the models of centralized electricity generation put into question the capacity of the system to achieve sustainability [2].
In the country, the literature dealt with is part of studies and proposals for connecting photovoltaic systems to the National Electroenergetic System (SEN), in order to reduce the consumption of electrical energy generated by fossil fuels, where the impact is not taken into account in terms of a reduction in technical losses in the network, which mostly constitute small installations [3, 4].
Electricity losses are evaluated through a loss index, since it defines the technical situation that the system presents, which also has an impact on the economy, for which some authors are dedicated to the study of improvements in the system through the so-called distributed generation with photovoltaic systems connected to the grid [5-7].
The influence of a photovoltaic system from the point of view of reducing technical losses in the network is a process that can be laborious and complex, so it is not always taken into account in the feasibility studies of the facilities. However, several authors demonstrate the importance that this branch of science may have [8-10]. On the other hand, some researchers are based on what photovoltaic installations represent in improving the voltage in the grid [11-13], which in one way or another also contributes to the improvement of the loss index, and therefore, with the quality and efficiency of the system.
In this work an evaluation of the impact of the proposal of a photovoltaic system connected to the grid is carried out in terms of reducing losses. The study is carried out with the support of the PVSyst and DIgSILENT PowerFactory tools to determine the power generation of the photovoltaic installation. Using the Radial 7.7 tool, the load flow is run. Line energy losses are determined by empirical equations developed in the literature discussed.
The Sagua de TAnamo photovoltaic solar plant will be interconnected with the National Electroenergetic System, directly to the 33 kV grid that passes right next to the site limits, at a distance of approximately 50 m, at coordinates 20.35° north latitude and -75.13° west longitude, occupying a useful area of 28.808 m2 with a capacity of 4.4 MW.
Currently, the energy that reaches the Sagua de TAnamo municipality does so through this sub-transmission network, known as the “Moa-Sagua 33 kV Line” and which is fed by the O570 switch, of the substation 220/110/34.5 kV from Moa, located 42 km from the plant location. This is a line that has a maximum load Pmax, at the Moa bar of 11.04 MW
This energy is distributed by several substations, including Miraflores, Farallones, Los Indios, Sagua II, JuanDias, Sagua I, FAbrica de Refrescos and El Carmen.
The typical load graph for the maximum power day (December 16, 2019) of this line is presented in Figure 1
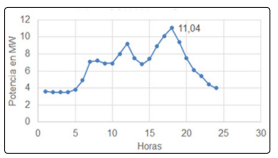
Figure 1: Load graph of the Moa - Sagua 33 kV line on the day of maximum demand
The Sagua de TAnamo photovoltaic solar plant will be interconnected with the National Electroenergetic System, directly to the 33 kV grid that passes right next to the site limits, at a distance of approximately 50 m, at coordinates 20.35° north latitude and -75.13° west longitude, occupying a useful area of 28.808 m2 with a capacity of 4.4 MW.
Among the characteristics of this load graph we can mention the clear identification of a peak in the morning, a peak in the middle of the day and a night peak; the latter being the most significant. It is a typical graph for lines feeding preferably residential loads.
Additionally, indicators of the annual load graph are obtained, such as the equivalent time of the use of the maximum load (T) and the equivalent time of losses (?). Table 1 shows these values.
Table 1: Annual load chart indicators| t (h) | Pmax (MW) | T (h) | T (h) | Energia (MWh/a) |
|---|---|---|---|---|
| 8760.0 | 11.04 | 3660.80 | 2052.50 | 40415.2 |
The selected photovoltaic modules belong to the DM250-M156-60 series; the main characteristics of the catalog are specified in table 2.
Table 2: Module characteristics| Modulo Fotovoltaico DM250-M156-60 | |
|---|---|
| Pm | 250 W |
| Isc | 9.2 A |
| Voc | 37.2 V |
| Im | 8.22 A |
| Vm | 30.4 V |
For the study, the PVSyst software is taken into account, which is used to model the behavior of photovoltaic installations; allows the study, simulation and data analysis of photovoltaic systems Furthermore, the DIgSILENT PowerFactory 15.1 tool is used to estimate the generation of the photovoltaic system for the day when the maximum demand occurs; thus allowing the study of the behavior of power losses for that day.
Loss calculation Radial 7.7 software is used to calculate the electrical power losses, which allows a load flow of circuits with radial configuration to be carried out.
Energy losses are determined by the classical Eq. (1), presented by some authors [14].
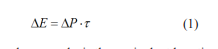
Where ?P are the power losses and ? is the equivalent loss time. Some literatures, such as, consider the calculation of the term equivalent time of losses through the empirical Eq. (2), with which the study is carried out in this work [15].
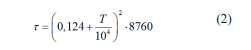
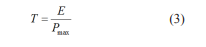
Where T refers to the time of use of the maximum load, which can be determined by the ratio between the energy and the maximum power, as related Eq. (3).
The energy results obtained by months, according to the PVSyst software are shown in figure 2
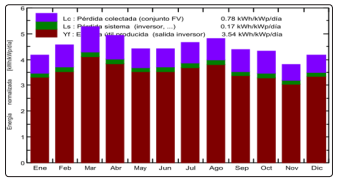
Figure 2: Distribution of the energy produced per month by the photovoltaic park
The figure also shows some values of losses derived by the installation itself, indicated in green, such as the losses produced in the inverter, among others. In addition, the average daily energy for the month of December, in which the maximum demand of the circuit to which the connection of the photovoltaic installation is intended occurs, has a value of 3 kWh/kW/day, which corresponds to about 13.2 kWh/day.
Likewise, the radiation results produced, according to the DIgSilent PowerFactory (for December 16, the daywhenthemaximumdema ndofthenetworkoccurs),areshownin figure 3.
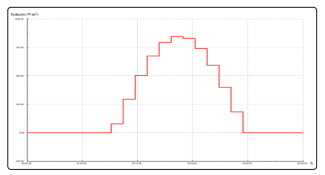
Figure 3: Behavior of radiation for the day of maximum demand
Observe the variable behavior according to the time of day, peaking at noon; while, in the hours of sunrise and sunset, there is practically no radiation, so the generation of the installation is affected.
Figure 4 shows the results obtained by the PVSyst software, by means of the diagram of the losses produced in the different segments or parts of the photovoltaic system and the energy delivered to the grid.
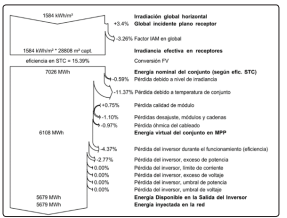
Figure 3: Behavior of radiation for the day of maximum demand
Considering the results shown in figure 4, the proposed photovoltaic system is capable of supplying the SEN with 5679 MWh per year.
By connecting the plant to the National Electroenergy System, the energy generated by the plant and delivered to the system alters the load graph of the network to which it is intended to connect.
Figure 5 shows the load graphs of the system without the plant, for December 16 (day of maximum load registered on the line), together with the graph of power delivered by the plant.
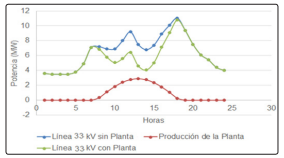
Figure 4: Load graph for the day of maximum demand (December 16)
As can be seen in figure 5, the maximum load of the system continues to be supplied from the National Electroenergetic System, because at the time it occurs, the plant has practically stopped generating due to the decrease in radiation in the evening hours. This implies that the power losses are maintained. However, the loss time ? decreases, from the point of view of energy delivered by the SEN, which indicates a decrease in energy losses.
To calculate the influence of the connection of this plant to the National Electroenergetic System, with the help of the Radial 7.7 program, the power and energy losses must first be calculated without the plant connected to the system, and then repeat the calculation with the connected plant. For this, the file of the MoaSagua line in the Radial is made. The window of the prepared file is shown in figure 6.
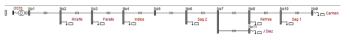
Figure 6: Monolinear diagram in the Radial of the 33 kV Moa - Sagua line without plant
In this scheme, the plant connection is made at node 5, which is 200 m from the Sagua II substation. The conductor used for this line is 150 mm2 with a resistance of 0.21 ?/km.
The flow run of this file is carried out, the results of which are shown in figure 7.
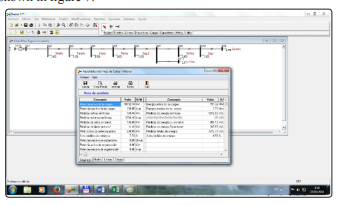
Figure 7: Radial charge flow results image
As part of the result, the power losses are obtained during the peak demand time of 781.4 kW.
On the other hand, the annual energy losses are 1603.8 MWh/year.
Figure 8 represents 2 load graphs, which allow to analyze the difference between what the system must generate without the screen connected a. and what happens to the generation graph when the plant is running b.
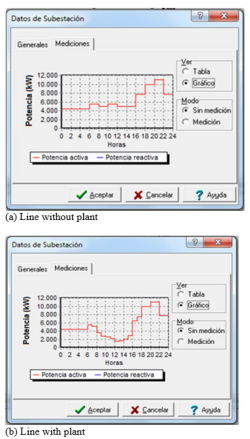
Figure 8: Line load graph
It can be seen how the load decreases during the hours that the plant is connected, analyzing it from the source, through the O570 switch.
This result shows that the influence is not given by the decrease in power losses, but rather by the decrease in energy losses.
The results show the new value of 1206.8 MWh/year of energy losses with the connection of the plant to the line.
The decrease in energy losses in the network is the difference between the annual energy losses before the plant is connected and the annual energy losses after it is connected. The result of the reduction of energy losses in the grid is 397.0 MWh/year.
Therefore, the impact represented by the connection of this solar plant to the electricity grid consists of the saving of 397 MWh/ year of electrical energy, which is equivalent to a saving of 59 550 CUC for an energy cost of 150 CUC/MWh.
The proposed photovoltaic system has the technical characteristics required for its commissioning, with a possible generation of approximately 5679 MWh per year.
The connection of the solar plant, although it does not contribute to the reduction of power losses in peak hours, since its operating hours do not reach the time when the maximum demand of the line occurs, it does contribute significantly to the decrease of the energy losses that occur in it, due to the decrease in the amount of energy that corresponds to be transmitted directly from Moa, and this is delivered by the plant a short distance from the city of Sagua.