Author(s): Olaoye Ayoola Azeez
Managing the liquidity position to enhance performance in an organization is imperative. This study examines the impact of liquidity management on the profitability of some selected food and beverage firms in Nigeria. This study adopted a case study research design. Secondary data was used to collect information from the annual reports of the selected firms from 2014 to 2018. Data was analyzed using multiple regression and Correlation analyses. The results of this study shows that current ratio; current assets/total assets ratio and working capital ratio have no .impact on the return on capital employed based on the p-values >0.01 level of significant. This study concludes that changes in the liquidity position exert no positive significant changes in the profitability of the selected firms. Thus, liquidity management has no impact on the profitability of firms in Nigeria. This study recommends that the management of firms in Nigeria and other countries should try to shorten the periods of converting accounts receivables and inventories to cash to improve liquidity. The outcome of this study will serve as a useful tool for future researchers in this area of study.
The goal of managing liquidity is to enable a business maximize profit of its operations and meet both short-term financial obligations and operational expenses. Management of liquidity is essential part of financial management that determines whether or not a firm will succeed. Management of liquidity is all about timely conversion of accounts receivable and inventories into cash; prompt payment of accounts payables; keeping minimum inventories and fast collection of receivables to maximized profitability and shareholders’ wealth. The stakeholders of food and beverage companiess in Nigeria and other counties need to have more understanding of the impact of liquidity management on the profitability of their businesses as the liquidity and profitability are the two concepts that require more and serious attention all over the world especially during this current global financial difficulties and the poor condition of world economy caused by COVID-19 which necessitates this study. Also, a review of literature on the liquidity management and its impact on profitability give conflicting results because the impact factors of liquidity on profitability and the periods of studies varies from country to country and from one industry to another. For instance, studies conducted by [12] Takon Vera (2013) and Hussaini, Jamila, Idris Ibrahim (2016) [5]; Ben-Caleb, Egbide , Olubukunola, Uwuigbe , Uwalomwa (2013) [2] among others gave positive impact, while the studies conducted by Qasim & Ramiz (2011) [9] gave negative impact hence, this study. Orshi and Yunusa 2016 [6] are of the opinion that any firm that puts inaccurate liquidity management procedures into practice may likely face bankruptcy even though its profitability is constantly positive. Profitability is therefore a tool that measures companies’ financial efficiency, financial performance and repayment capacity among other. Ajanthan (2013) [1] explains further that high performance reflects management effectiveness, and efficiency in making use of company’s resources and this, in turn, contributes to the country’s economy at large. According to Pandey (2010) [8], profitability is a major factor in the going concern of a business. Profitability as a performance measure is the ability of asset to generate profit and can be measured using return on asset (ROA). According to Pandey (2010) [8], profitability can be measured as the rate of return on investment (ROI), return on capital employed (ROCE) and return on equity (ROE) amongst others. While liquidity is measured by the following: current ratio, quick ratio, cash ratio, working capital ratio and cash conversion cycle just to mention but a few (Pandey, 2010) [8]. Going by the views of the researchers above, the efficiency liquidity management is likely to affects both short term financial performance (profitability) and long-term financial performance (assets value and gearing level). Profitability is one of the indicators of firms’ growth. Managers should dare to attain a certain level of profitability in order to maximize their shareholders wealth. This study therefore investigates the liquidity management impact on the profitability of some selected listed food and beverages companies in Nigeria from 2014-2018. Specifically, this study analyzes the impact of current ratio (CACL); current assets/total assets (CATA) ratio and working capital to total assets (WCTA) on the profitability. The selected companies’ profitability was measured in term of (RCOE) while their liquidity management was measured in term of CACL, CATA and WCTA. Based on the specific objectives, this study hypothesized that CACL, CATA and WCTA have no significant impact on ROCE of the selected listed food and beverages companies in Nigeria. However, the shareholders should consider the outcome of this study as a contribution to the more understanding of corporate liquidity and profitability concepts. Particularly, this study would be an added value to existing related literatures.
Orshi et al. (2016) define liquidity as the firms’ ability of a firm to convert its current assets into cash to meet its day-to-day operations for better performance. Meanwhile, Ajanthan (2013) [1] describes liquidity management as the management of a firm’s investment in current assets, current liabilities, short-term borrowings and management of surplus or deficit cash for short term periods, which affect the firm’s profitability. Ajanthan (2013) [1] adds that the appropriate time frame within which liquid assets would be converted into cash to positively impact financial performance (Profitability) remains a bone of contention to every individual firm. According to Panigrahi (2013) [7], to survive firms must be able to meet their short-term obligations by paying their creditors and also be able to repay their short-term debts. Panigrahi (2013) [7] buttresses that management of liquidity is the routine process of managing a firm’s investment in current assets, current liabilities, short-term borrowings and short-term investment of surplus cash, which affect the profitability of the firm. According to Eljelly (2004) [4], the goal of liquidity management can be achieved through minimizing the risk of inability to settle the short-term obligations as well as avoiding unnecessary current assets investments. Bhunia and Brabuma (2011) [3] explain that liquidity management is seen to revolve around the management of working capital and it is measured using ratios such as current assets to current liabilities, current assets to total assets, working capital to total assets, inventory turnover, Accounts Receivables turnover, accounts payable turnover, among others. Liquidity ratio is the ratio of total current assets of the firm to the total current liabilities (obligation) within one year or normal operating cycle of the firm whichever greater (Bhunia et al., 2011) [3]. Eljelly (2004) [4] open that current assets are constituted by the money and other assets that are readily convertible into cash. According to Eljelly (2004) [4], cash itself is, by definition, the most liquid form of assets; other assets having varying degree of liquidity depending on their convertibility into cash. Eljelly (2004) [4] explains further that the current liabilities include all types of liabilities which will mature for payment within a period of one year such as bank overdraft, trade creditors, bills payable, outstanding expenses, etc
According to Orshi et al. (2016) [6], profitability is a measure of the results of a firm’s strategies, policies, and operations in monetary terms. The profitability indicators include but not limited to revenue and profit growth levels, and the strength in the return on capital employed. Ravivathani (2015) [11] explains that the concern of business owners and managers all over the world is to devise a strategy of managing their day to day operations in order to meet their obligations as they fall due and increase profitability and shareholder’s wealth because profitability is a major factor in the going concern of a business which managers should strive to achieve at reasonable level in order to maximize their shareholders wealth. Ajanthan (2013)[1] is of the opinion that a healthy profitability position of any firm plays a critical role to the increase in the market value and the growth of firms which ultimately leads towards the overall prosperity of the economy
Knowledge of the impact between liquidity and profitability of various sectors of an economy is vital to all stakeholders. Ravivathani (2015) [11] is of the opinion that profitability and liquidity are very closely related. Orish et al. (2010) have the feeling that interaction between liquidity management practices and the financial profitability should be a major area of research focus. The excessive working capital (liquidity position) will result to a poor return on assets while inadequate investment in it may lead to difficulties in maintaining daily operations. According to Panigrahi (2013) [7], shortage in liquidity position is normally attributed to the major cause of failure of many small businesses in various developing and developed countries. However, liquidity management and profitability are the two concepts that are still receiving serious attention all over the world especially in this current financial crisis and the poor state of the world economy caused by COVID-19. Therefore, the liquidity management and profitability measure are very important to both shareholders and potential investors.
This study is underpinned on the “Trade off theory”. Hussaini et al. (2016) opens that the trade off theory explained that an efficient working capital is achieved when there is a trade-off between liquidity and profitability, and the shareholders’ value. Raheman and Nasr (2007) elaborate the discussion on profitability that the level of investment in working capital and the financing of this investment, at any particular level of output involve a risk-return trade-off. Raheman et al. (2007) further highlight that too high liquidity can give rise to low profitability, stock outs, and loss of sales, whereas illiquidity amounts to a waste to a business entity. Raheman et al. (2007) add that if the working capital is too low, the company may miss many profitable investment opportunities or enter into short-term liquidity problems which may lead to the degradation in the company credit because the company cannot respond effectively to temporary capital needs. Raheman et al. (2007) make a clarification that there are some external and internal factors which may induce the business entities to strike a balance between the meeting of unforeseen capital needs and avoiding of poor working capital management. Hussaini et al. (2016) [5] are of the opinion that efficiency in working capital management will ensure that the investment in its components (Inventories, trade receivables, trade payables, etc.) is neither too low nor too high. Hussaini et al. (2016) [5] explain that when the working capital requirements are not properly managed and its allocation beyond its requirements, it may render management inefficient and lead to the reduction in the benefits of short-term investments. Therefore, the trade-off theory is relevant to this study and was employed to anchor this study’s variables as the theory established a constructive link between the corporate liquidity management and profitability enhancement.
In a study conducted by Bhunia et al. (2011) [3] to examine liquidity management efficiency and liquidity profitability relationship. The study used panel secondary data extracted from the income statements, statement of financial position, and cash flow statements of sampled firm listed on the India Stock Exchange. The sample of private sector steel companies from 1997-2006 were used in the analysis. The results from the study showed that the regression and correlation results were positively significant and associated to the profitability of the firms. Qasim et al. (2011) [9] carried out a study to examine the impacts of liquidity ratios on profitability of selected enterprises in Pakistan. The study used the sample of 26 oil and gas companies listed on the Karachi Stock Exchange (KSE). Findings from the study showed that there is a significant impact of liquid ratio on ROA but insignificant impact of liquidity ratio on ROE and ROI. The study concluded that that ROE is no significantly affected by three ratios liquid ratio, current ratio and quick ratio but ROI is strongly affected by ratios liquid ratio, current ratio. Ajanthan (2013) [1] conducted a study to investigate the relationship between liquidity and profitability of trading companies in Sri Lanka. The study covered a period of past 5 years from 2008 to 2012. Findings from the study revealed that there exists a significant relationship between liquidity and profitability among the listed trading companies in Sri Lanka. Hussaini et al. (2016) conducted a research to examine the relationship between the corporate liquidity and profitability of listed food and beverages firms in Nigeria. The study used data that covered the period of six years 2009 to 2014 which was extracted from the firms’ annual reports and accounts. The multiple regression was employed to test the model of the study using Robust OLS. The results from the study revealed a strong positive relationship between quick ratio, accounts payable, IFRS, firm size and ROA of Listed Food and Beverages Firms in Nigeria,
This study used a case study research design because it employed panel data extracted from the annual reports of the selected companies. The population of this study is the entire numbers of the listed food and beverages companies on the Nigerian Stock Exchange (NSE). Purposive sampling technique was used to select the sample size. The technique of sampling was done in the following manner: All food and beverages companies listed from 2014 were included considering the period of the study. The period of study was five years (2014 - 2018). Periods from 2019 to 2020 were not covered due to unavailability of the published accounts and reports of the some companies as at the time of conducting this research. At the end, only five (5) companies that met the criteria of selection were considered, the remaining were filtered out because they did not provide necessary information required for this study. The selected companies include Flour Mills of Nigeria Plc, FTN Cocoa Processor plc, Unilever Nigeria Plc, Nestle Nigeria Plc, and Group Dangote Sugar plc. Panel data was obtained from the annual accounts and reports of the sampled companies which were published by NSE. Data on return on capital employed (ROCE), current ratio (CACL), working capital ratio (WCTA) and current assets to total assets ratio (CATA) from the audited financial statements (Income statement and statement of financial position) in order to examine the impact of liquidity management on profitability among the selected NSE listed food and beverage companies that have published their financial statements in Nigeria for the period under review and were considered as fairly accurate and reliable data for the study. The researcher satisfied the content validity and reliability of the information about the companies. Based on the nature of this study, multiple regression and correlation statistical tools were used to analyze data with the aid of Statistical Package for Social Sciences (SPSS) version 20.
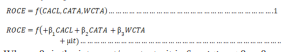
This study used three independent variables as functions of dependent variable. The dependent variable of profitability was measured in term of return on capital employed (ROCE) as a function of the independent variable of liquidity management measured in term of current assets / current liabilities (CACL), current assets / total assets (CATA) and working capital / total assets (WCTA). The definition and measurements of each variable are disclosed in table 1.
Table 1: Description and Measures of Variables Current ratio (CATA)Current Assets
Current LiabilityCurrent assets to Total Assets (CACL)Current Assets
Total AssetsWorking capital to total assets
(WCTA)Working Capital
Total AssetsDependent VariableMeasurementReturn on Capital Employed
(ROCE)Profit after Interest and Tax *100
Capital Employed
| Independent Variables | Measurement |
|---|---|
Source: Author’s Compilation (2020)
Table 1 above shows the variables and their descriptions as used in this study.
This study adopted the multiple regression model used by Hussaini et al. (2016) who investigated “Corporate liquidity and profitability of listed food and beverages firms in Nigeria”. The study used one dependent and five independent variables. The dependent variable, of profitability was represented by Return on Asset (ROA) while the independent variables of liquidity were represented by quick ratio (QR), accounts receiv-ables (AR), accounts payable (AP), Firm Size of firm (FSZ) and Cash conversion cycle (CC). The Model is given as follows:
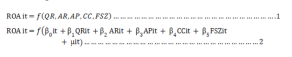
Where β0 is the intercept/constant; it is firm i time t, β1 - β5 are the coefficients and μ is the error term. This study replaced the variables used by Hussaini et al. (2016) [5] as follow: Dependable variable of profitability is represented by return on capital employed (ROCE) and the independent variable of liquidity management is represented by current ratio (CACL), current assets to total assets (CATA) and working capital to total assets (WCTA) to form the research hypotheses. The model for this study is specified below:
Where: β0 is the intercept/constant; it is firm i time t β1 - β3 are the coefficients and μ is the error term.
Table 2: Regression Coefficients
| Model | Un-standardized Coefficients | Standardized Coefficients | T | Sig. | ||
|---|---|---|---|---|---|---|
| 1 (Constant) Average CACL Average CATA Average WCTA |
0.052 -1.807E-008 0.065 0.523 |
0.011 0.000 0.004 0.047 |
-.505 1.460 1.064 |
4.901 -8.409 15.351 11.082 |
0.128 0.075 0.041 0.057 |
|
Source: Author’s Computation (2020)
a. Dependent Variable: Average ROCE of the Selected Companies
The results of the regression analysis in table 2 show that the three models are not significant at 1% level of significance given model 1 with f-value of -8.409 at a p value is 0.075, model 2 with f-value of 15.351 at a p-value of 0.041 and model 3 with f-value of 11.082, at a p-value of 0.057 which are not statistically significant at 1% level of significance. In this case it reveals that CACL, CATA and WCTA have no significant impact on ROCE at 1% level.
Table 3: Analysis of Variances (ANOVA)
| Model | Sum of Squares | Df | Mean Square | F | Sig. |
|---|---|---|---|---|---|
| 1 Regression Residual Total |
0.070 0.000 0.071 |
3 1 4 |
0.023 0.000 |
99.227 | 0.074b |
Source: Author’s Computation (2020)
a. Dependent Variable: Average ROCE
b. Predictors: (Constant), Average WCTA, Average CACL, Average CATA \
Table 3 shows the analysis of variance (ANOVA) of the variables. With f-value of 99.227 (sig 0.074) for ROCE the proxy of profitability, it clearly shows that there is no significant relationship between the dependent variables (Average ROCE) and the independent variables (Averages of CACL. CATA, WCTA) at 1 % level of significance.
Table 4: Correlations
| Average ROCE | Average CACL | Average CATA | Average WCTA | |
|---|---|---|---|---|
| Average ROCE Pearson Correlation Sig. (2-tailed) N |
1 5 |
-.448 .449 5 |
.498 .394 5 |
.041 .948 5 |
| Average CACL Pearson Correlation Sig. (2-tailed) N |
-.448 .449 5 |
1 5 |
.235 .704 5 |
-.268 .663 5 |
| Average CATA Pearson Correlation Sig. (2-tailed) N |
.498 .394 5 |
.235 .704 5 |
1 5 |
-.793 .109 5 |
| Average WCTA Pearson Correlation Sig. (2-tailed) N |
.041 .948 5 |
-.268 .663 5 |
-.793 .109 5 |
1 5 |
Source: Author’s Computation (2020)
The table 4 shows the correlation values of the dependent and independent variables. It is apparent that none of the relationships are statistically significant which is in line with many of the previous study. There was a weak relationship between liquidity management and profitability of the selected listed food and beverage companies.
The result of the regression analysis shows that the coefficient for all the three independent variables of CACL, CATA and WCTA ratios are not significant. Further to these results, the t values for both variables of liquidity are insignificant at 1% level and it means that these variables are not contributing to the profitability (ROCE). Also, the analysis of variance (ANOVA) of the variables with f-value of 99.227 (sig 0.074) for ROCE (profitability) meaning that there is no significant relationship between the dependent variables (ROCE) and the independent variables (CACL. CATA, WCTA). The correlation results also appear that none of the relationships are statistically significant which is in line with many of the previous study. Furthermore, table 4 shows insignificant negative relationship between current ratio (CACL) and return on capital employed (ROCE), with a correlation coefficient of -8.409 at a P-value of 0.075. This .shows that a unit increases in CACL decreases ROCE by 8.409 CACL. Also, there is insignificant positive relationship between current assets to total assets ratio (CATA) and return on capital employed (ROCE), with a correlation coefficient of 15.351 at a P-value of 0.041. This .shows that a unit increases in CATA decreases ROCE by 15.351CATA. More so, there is no significant positive relationship between working capital to total assets ratio (WCTA) and return on capital employed (ROCE), with a correlation coefficient of 11.082 at a P-value of 0.041. This .shows that a unit increases in CACL decreases ROCE by 8.409WCTA. Therefore, in all the cases, the hull hypotheses are accepted. Thus, there is a no relationship between liquidity management and profitability of the selected listed food and beverage companies.
Findings from this study indicated that changes in the liquidity position exert no remarkable changes in the profitability of firms as all the results showed there were no significant relationship between liquidity management and the profitability of the selected listed food and beverage companies in Nigeria during the periods under review. These are the signs that the current liabilities of the companies are being overshoot. Therefore, liquidity management based on the results of this study and other reviewed related literatures indicate no impact of liquidity management on the profitability of the company. However, liquidity management plays an important role in the firm’s success and growth. Given the present global financial uncertainties and the poor state world’s economy due to COVID-19 pandemic and other factors, financial managers needs serious scholarly and industry attention as business owners and managers being preoccupied with developing mechanisms of striving to meet the short-term obligations of their businesses as at when due. In view of the findings and conclusion drawn, the management of the listed food and beverages companies in Nigeria should shorten the length of time it takes to convert their inventories and trade receivables into cash to ensure uninterrupted cash and cash equivalent supply; to guarantee prompt settlement of trade payables and ensure efficient liquidity management.