Author(s): <p>Gerald C. Hsu</p>
This paper describes a rational range of HbA1C values for type 2 diabetes (T2D) conditions using big data analytics of both finger-piercing and glucose testing strip method (Finger) and a continuous glucose monitoring sensor device (Sensor)
This paper describes a rational range of HbA1C values for type 2 diabetes (T2D) conditions using big data analytics of both finger-piercing and glucose testing strip method (Finger) and a continuous glucose monitoring sensor device (Sensor). It uses the estimated average glucose (eAG) concept and formula defined by the America Diabetes Association (ADA) to conduct this comparison study.
The ADA is recommending the use of a new term known as the eAG for diabetes management. Here is some important information from the ADA literature:
“Healthcare providers can now report A1C results of patients by using the same units (mg/dl or mmol/l) that patients routinely see in their blood glucose measurements. Although the A1C test is an important tool, it can’t replace the daily self-monitoring of blood glucose (SMBG). A1C tests don’t measure a person’s dayto-day control. People with diabetes can’t adjust their insulin on the basis of their A1C tests. That’s why blood glucose checks and log results are so important to stay in good control. From 1994, the goal for most people with diabetes has been less than 7%. ADAG Study was conducted by ADA, EASD, and IDF with 507 recruited people, including 268 patients with type 1 diabetes (53%), 159 with type 2 diabetes (31%), and 80 people without diabetes (16%) from 10 international centers.”
The author conducted four glucose measurements per day by using the Finger method over the past 8-years, 2,909 days (1/1/2012 - 12/21//2019) with 11,636 measured finger glucose data. Furthermore, by applying a Sensor on his upper arm and measuring 76 times per day on average, he has collected additional 45,296 measured sensor glucose data over 596 days (from 5/5/2018 to 12/21/2019). However, in this particular study, in order to have a reasonable and fair comparison, he used the same time period of 596 days from 5/5/2018 to 12/21/2019 for both finger and sensor
He then conducted his big glucose data analysis to compare Finger data (average at 114.85 mg/dL) versus Sensor data (average at 130.38 mg/dL). In summary, the average daily sensor glucose is 13.5% higher than the average daily finger glucose. These two sets of self-monitoring of blood glucose (SMBG) data include fasting plasma glucose (FPG), postprandial plasma glucose (PPG), and the glucoses in other periods throughout the day (for example, between meals and pre-bed periods) from the Sensor method. The sensor method has collected an average of 76 data per day.
The following ADA’s formula for the conversion between eAG and A1C is used in this calculation except the term of eAG is replaced by measured average Finger glucose and measured average Sensor glucose in two separated analyses.
His HbA1C conversion calculation would yield two separate HbA1C values, representing a range of probable HbA1C. Therefore, he researched and developed an accurate mathematical method to calculate the HbA1C. He chose the finger method since it has been the most popular way of glucose testing performed by most diabetes patients and healthcare professionals.
The author then applied big data analytics, artificial intelligence (AI) techniques, auto-correction capability, and “safety margin” concept to develop a mathematical model in order to simulate the HbA1C from the collected daily finger glucose data. He named it the “EclaireMD A1C Model”.
His Lab-tested data were collected at a particular medical laboratory of the same hospital on a quarterly basis for the past 7-years.
Figure 1 shows the time-series of daily glucose charts, both finger and sensor collected, in the forms of a straightforward daily data curve and another 99-days moving average curve form.
He then applied the ADA’s formula below to calculate the converted HbA1C values from both measured average finger glucose and measured average sensor glucose:
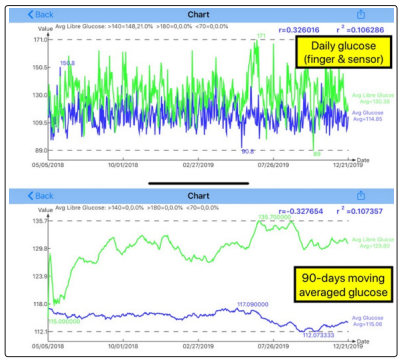
Figure 1: Daily glucose and 90-days moving average daily glucose (both finger and sensor)
Figure 2 shows the comparison between lab-tested A1C and eclaireMD A1C, daily glucose data (both finger glucose and sensor glucose).
Lab-tested A1C: 6.7125% (100%)
EclaireMD A1C: 6.7621% (101%)
eAG (finger) A1C: 5.6292% (84%)
eAG (sensor) A1C: 6.1701% (92%)
EclaireMD A1C is 1% higher than Lab A1C which is due to the author’s intentionally build-in “safety margin”. Sensor eAG based average A1C is 8% closer to Lab A1C than finger eAG based A1C.
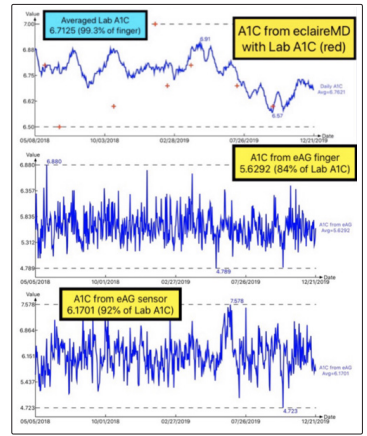
Figure 2: HbA1C converted from daily glucose values (both finger and sensor)
Figure 3 shows the comparison between lab-tested A1C and eclaireMD A1C,90-days moving average glucose data (both finger glucose and sensor glucose).
Lab-tested A1C: 6.7125% (100%)
EclaireMD A1C: 6.7621% (101%)
eAG (finger) A1C: 5.6364% (84%)
eAG (sensor) A1C: 6.1299% (91%)
Generally speaking, the 90-days moving average glucose converted A1C values (both finger and sensor) are very close to the daily glucose converted A1C values.
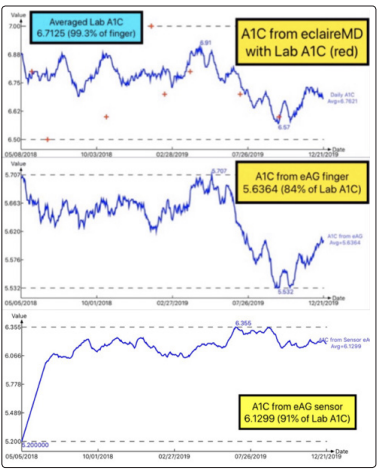
Figure 3: HbA1C converted from 90-days moving average daily glucose values (both finger and sensor)
These three sets of converted HbA1C values from two different sources of glucose datasets (~47,700 total data size) show that the eclaireMD A1C has the highest accuracy (99%), followed by the sensor A1C (91%-92%), while finger A1C has the lowest accuracy (84%). This conclusion further proves effectiveness of the GH-Method: Math-physical medicine.