Author(s): Mahima Ranjan Acharjee, Subeda Newase, Trina Das, Sifatun Nur, Mohammad Ekramul Haque, Sadia Afrin, Md. Rafiul Jannat and Helena Khatoon*
Lipid produced in the marine microalgae, Tetraselmis chuii has the potential to be processed into biofuels which can replace the use of fossil fuels that contributes to the global warming on earth. The purpose of this study was to determine the effects of phosphorus on lipid production in Tetraselmis chuii. Therefore, Tetraselmis chuii was cultured under normal concentration of phosphorus in the Conway medium. The cell was harvested on the fourth day and then transferred and cultured under different concentrations of phosphorus (10g, 15g, 20g, 25g and 30g of NaH2 PO4 .2H2 O in 1 L Conway medium). The cell density and optical density analysis of the culture were analyzed daily whereas the biomass (dry weight) analysis and lipid extractions were carried out on every alternate day. Result of the study showed that the highest lipid production in Tetraselmis chuii was achieved on day 4 in the phosphorus sufficient culture medium (25 g/L of NaH2 PO4 .2H2 O). Under the deficiency of phosphorus in the culture medium especially when the growth reached the stationary phase, more lipids accumulated in all the treatments. Therefore, our findings illustrated that phosphorus was important in regulating the growth of Tetraselmis chuii and the lipid accumulation was higher when the growth of Tetraselmis chuii was limited by the depleted phosphorus. In addition, total lipid yields also increased with the presence of excess phosphorus in the culture medium
Microalgae biomasses especially the lipids can be used to extract and process into biofuels. They are photosynthetic microorganisms that can be used in a variety of ways to reduce carbon in the atmosphere and convert it into potential products, making them one of the future’s key contributors to help mitigating climate change [1,2]. Due to their high efficiency at adapting to physicochemical variations, their culture conditions can be optimized for inducing microalgal growth, biomass production and changing their biochemical composition [3]. Liquid fuels like ethanol and liquid hydrocarbon fuels, as well as gaseous fuels like hydrogen and biogas, can be produced using the lipid present in microalgae or the microalgae cell itself [4].
There are a lot of microalgae species that have a high lipid accumulation and thus results in high oil yield. Among all the microalgae species, Tetraselmis sp. has been chosen to be used in this study. The Tetraselmis sp. can thrive in a wide salinity range up to 70 practical salinity units (PSU) and a temperature range of 0-37 °C, with a lipid productivity ranging from 18.6-48.9 mg L-1 d-1 depending on the growth conditions [5,6]. This species produced high cell densities, protein, lipid, and carbohydrate contents when cultivated at pH 7.5 and 8.5 [7]. Hence it is widely used for feeding marine herbivores in mariculture [8].
There are many factors that were involved in regulating the growth of microalgae. The parameters involved are nutrient quantity and quality, light, temperature, pH and salinity [9]. Nutrients are one of the most important factors that influence the growth of microalgae, thus, affecting the biochemical composition such as lipids, carbohydrates and proteins in microalgae. Nutrients can be further divided into macronutrients (nitrogen, phosphorus and silicon), trace metals, vitamins, pH buffers and chelators. Macronutrients are nutrients or minerals that are needed in large quantities. The three main macronutrients that are usually used in algal culturing are nitrogen, phosphorus and silicon. In the preparation of stock solutions, nitrate and phosphate are usually added as NaNO 2 and NaH2 PO4 .2H2 O [10]. Nutrients also play an important role in chlorophyll concentrations, cellular composition and also the final products in microalgae.
All of the primary metabolic processes of plants, including the production of macromolecules, energy transmission, photosynthesis, signal transduction, and respiration, are mediated by phosporus [11]. These processes are dependent on the function and integrity of the membrane as most of the processes are membrane-bound processes. On the other hand, the membranes are determined by their lipid composition [12]. Generally, membrane phosphorus will be greatly reduced when phosphorus is limiting. As a result, these compounds will be replaced by non-phosphorus glycolipids and/or sulfolipids. Most of the studies regarding nutrient limitation on the biochemical profile are based on themodification of the nitrogen, phosphorus or both the nutrients that are present in the same culture medium in different species of microalgae [13, 14]. In marine microalgae, lipid act to be the storage product [15]. Therefore, when certain nutrients such as nitrogen and phosphorus are stressed, the biochemical profile of the microalgae will change. Consequently, the production of microalgae biomasses will be affected.
In this study, the nitrogen concentration was maintained in the normal concentration whereas the concentrations of phosphorus varied for each treatment in the culture medium. Tetraselmis chuii. was cultured under stress condition (by increasing or decreasing the concentration from the normal concentration, which was 20 g/L in Conway medium). Thus, the effects of different concentrations of phosphorus, NaH 2 PO4 .H2 O (10g/L, 15 g/L, 20.0 g/L, 25 g/L and 30 g/L) present in the culture medium on lipid production in Tetraselmis chuii was evaluated. Therefore, the objective of this study is to evaluate the growth and lipid production of Tetraselmis chuii cultured in different concentrations of phosphorus.
Different concentrations of phosphorus in the stock solutions were prepared by modifying the amount of the sodium orthophosphate, NaH 2 PO 4 .2H 2 O presence in the Conway medium. First of all, approximately 50% of the 1 L of distilled water was added into an empty 1 L Schott Duran bottle. Then, the appropriate quantity of the weighed nutrients was added while stirring continuously using the magnetic stirrer. The first nutrient must be dissolved first before the second nutrient was added.
Finally, after all the nutrients were added and dissolved in the solution, the stock solutions were diluted to the final volume with the distilled water. The whole procedures were repeated by modifying the amount of NaH2 PO4 .2H2 O to 10 g, 15 g, 25 g and 30 g in another four different bottles of 1 L stock solutions respectively. All the stock solutions were tightly sealed and refrigerated at 4°C when not in use.
Tetraselmis chuii was obtained from ‘Live Feed Research Corner’, Faculty of Fisheries, Chattogram Veterinary and Animal Sciences University, Chattogram, Bangladesh. The pure Tetraselmis chuii was cultured in sterilized seawater using Conway culture medium [16]. Sub-culturing was conducted every two weeks in order to maintain pure and healthy stock culture. Pure seed culture of T. chuii was maintained at 30 ppt salinity in Conway medium.
The sterilized 270 ml Conway culture medium was poured into two 500 mL Erlenmeyer flask. After that, 30 mL of T. chuii was inoculated into two flasks respectively and was slowly shaken. The T. chuii culture in the Erlenmeyer flasks were kept on the rack, at 25°C ± 1°C and light intensity of 2000 Lux light from fluorescent lamps (SANYO FL40SS W/37). A 24 hours’ light period was maintained. Air was continuously bubbled into every culture using an air pump.
Cell density and optical density analysis were carried out every day until the culture reached the late stationary phase. The growth curve with cell density and optical density as the parameters were plotted at the end of this experiment and different phases of the Tetraselmis growth was identified.
The counting of microalgal cells was conducted on a daily basis using a Hemacytometer throughout the duration of the growth curve experiment [17].
The Nano Drop Spectrophotometer (NanoPlus, WAVE ANALYTICS D- 82362 Weilheim, Germany) was used to quantify the daily change in absorbance at a wavelength of 600 nm. The culture media used for each treatment served as the blank samples.
In phase 1 of the experiment, 30 mL of Tetraselmis chuii was inoculated in 500 mL Erlenmeyer flask each containing 270 mL of Conway medium having normal concentration of phosphorus based on the recipe in the Conway medium (20 g of NaH 2 PO4 .2H2 O in 1 L stock solutions). There were a total of 15 flasks which were kept on the rack at 25°C ± 1°C and light intensity of 2000 Lux light from fluorescent lamps (SANYO FL40SS W/37).
A 24 hours’ light period was maintained. Air was continuously bubbled into every culture using an air pump. Cell density and optical density analysis were conducted every day whereas lipid extraction and biomass (dry weight) analysis were conducted on day 4.
In phase 2 of the experiment, the Tetraselmis chuii cultures of phase 1 were harvested before they reached the stationary phase (on the fourth day based on the growth curve as shown in Figure 1) by centrifuging at 3000 rpm for 3 minutes and grown under different concentration of phosphorus (10 g/L, 15 g/L, 20 g/L, 25 g/L and 30 g/L of NaH 2 PO4 .2H2 O in 1 L of stock solutions in the Conway medium recipe). The different treatments of NaH2 PO4 .2H2 O concentrations were labelled as control (20 g/L NaH2 PO4 .2H2 O), stress 1 (10g/L NaH2 PO4 .2H2 O), stress 2 (15 g/L NaH2 POv .2H2 O), stress 3 (25 g/L NaH2 PO4 .2H2 O) and stress 4 (30 g/L NaH2 PO4 .2H2 O).
There was a total of 15 2 L flasks each containing 1.5 L of Conway medium of different concentration and 150 mL of centrifuged Tetraselmis chuii culture as the inoculum. The flasks were kept randomly on the rack, under at 25°C ± 1°C and light intensity of 2000 Lux light from fluorescent lamps (SANYO FL40SS W/37). A 24 hour of light period was maintained. Air was continuously bubbled into every culture using an air pump. The cell density and optical density were recorded every day whereas lipid extraction and biomass (dry weight) analysis were conducted on every alternate day. All the analysis was stopped once the Tetraselmis chuii culture reached the stationary phase.
The analysis was conducted following the carbonization method [18]. This process was divided into three parts, starting with the preparation of stock solution, followed by preparation of series of standards and extraction of lipid from samples.
The optical density of the samples was taken using spectrophotometer (UV-Visible Spectrophotometer SHIMADZU, Model UV-1601) at 375 nm. The reading was taken within 2 hours after the samples in the tube were removed from the cold-water bath in order to get accurate results. The percentage of lipid present

The data of different concentrations of phosphate on the lipid production in Tetraselmis chuii was analyzed using the SPSS software through the analysis of one-way ANOVA.
From Figure 1, the highest mean number of cell density was achieved on day 5 of the experiment. The mean number of cell density was increased from day 0 to day 5. After day 5, the mean number of cell density was decreased.
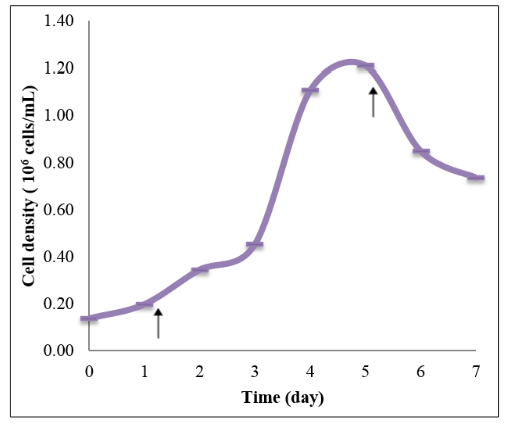
Figure 1: Mean number of cell density of Tetraselmis chuii in the growth curve experiment. Arrows indicate the time of Tetraselmis chuii entering the new phase in their growth curve. The arrow on day 1 indicates the end of lag phase/early logarithmic phase. The arrow on day 5 indicates the end of logarithmic phase/early stationary phase.
From Figure 2, the highest mean of optical density reading was recorded on day 6 of the experiment. The mean of optical density reading increased from day 0 to day 6. After day 6, the mean of optical density reading decreased.
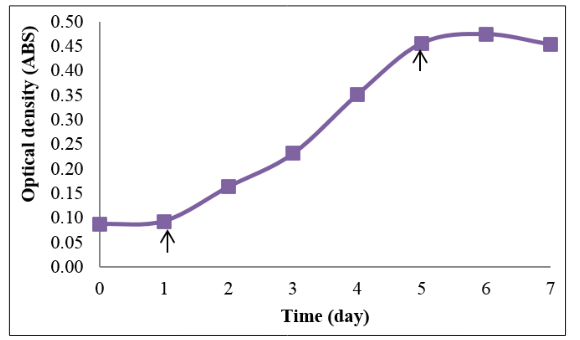
Figure 2: Mean of optical density readings of Tetraselmis chuii in the growth curve experiment. Arrows indicate the time of Tetraselmis chuii entering the new phase in their growth curve. The arrow on day 1 indicates the end of lag phase/early logarithmic phase. The arrow on day 5 indicates the end of logarithmic phase/ early stationary phase.
From Figure 3, the mean number of cell density of Tetraselmis chuii in control (20 g/L NaH 2 PO4 ), stress 1 (10 g/L NaH2 PO4 ), stress 2 (15 g/L NaH2 PO4 ), stress 3 (25 g/L NaH2 PO4 ) and stress 4 (30 g/L NaH2 PO4 ) were not significantly different with each other at the beginning of the growth. However, on day 6, stress 1 treatment has the highest mean number of cell density.
Both the stress 1 and stress 2 treatments enter stationary phase on day 6, one day earlier than the control, stress3 and stress 4 treatments. On day 7, stress 4 treatment has the highest mean number of cell density. Control treatment has the lowest growth with the least mean number of cell count compared to other treatments.
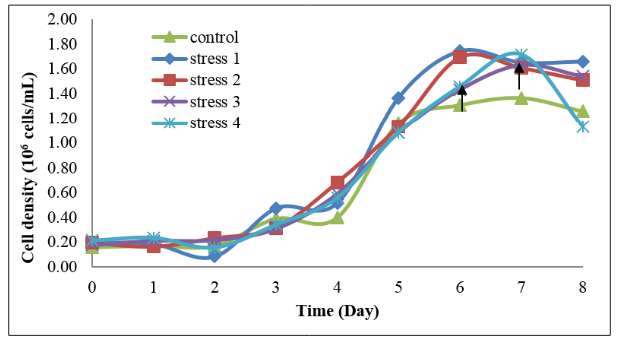
Figure 3: Mean number of cell density of Tetraselmis chuii cultured in five different treatments of phosphorus concentration with each treatment consisting of the triplicate samples. The arrow on day 2 indicates the end of lag phase/early logarithmic phase. Arrow on day 6 indicates the end of logarithmic phase/ early stationary phase for the Tetraselmis chuii in the stress 1 and stress 2 treatments. The arrow on day 7 indicates the end of logarithmic phase/early stationary phase for the Tetraselmis chuii in the control, stress 3 and 4 treatments.
From Figure 4, the mean of optical density reading of Tetraselmis chuii in control (20 g/L NaH 2 PO4 ), stress 1 (10 g/L NaH2 PO4 ), stress 2 (15 g/L NaH2 PO4 ), stress 3 (25 g/L NaH2 PO4 ) and stress 4 (30 g/L NaH2 PO4 ) were increased from day 0 to day 6 and decreased on day 7. On day 6, stress 1 treatment has the highest and control treatment has the lowest mean of optical density reading. All the treatments enter stationary phase at day 6. Control treatment has the lowest growth with the least mean of optical density reading compared to other treatments.
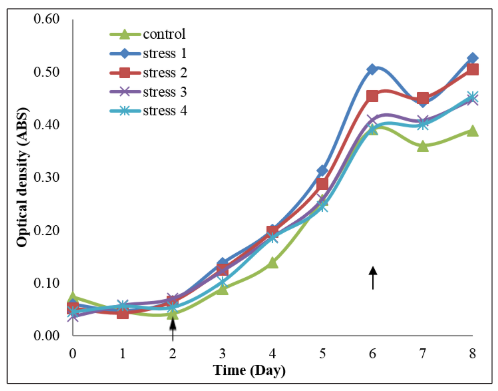
Figure 4: Mean of optical density readings of Tetraselmis chuii cultured in five different treatments of phosphorus concentrations
with each treatment consisting of the triplicate samples. The arrow on day 2 indicates the end of lag phase/early logarithmic phase. The arrow on day 6 indicates the end of logarithmic phase/early stationary phase.
Figure 5 shows that the highest lipid production in Tetraselmis chuii is on day 4 in the stress 3 treatments whereas the lowest lipid production is on day 0 in the stress 1 treatments. The lipid produced from all the treatment was significantly different from each other with the increase of number of days. Stress 1 and stress 2 were phosphorus deficient treatment (10 g/L NaH 2 PO4 and 15 g/L NaH2 PO4 respectively) whereas control, stress 3 and stress 4 were phosphorus sufficient treatment (20 g/L NaH2 PO4 , 25 g/L NaH2 PO4 and 30 g/L NaH2 PO4 respectively).
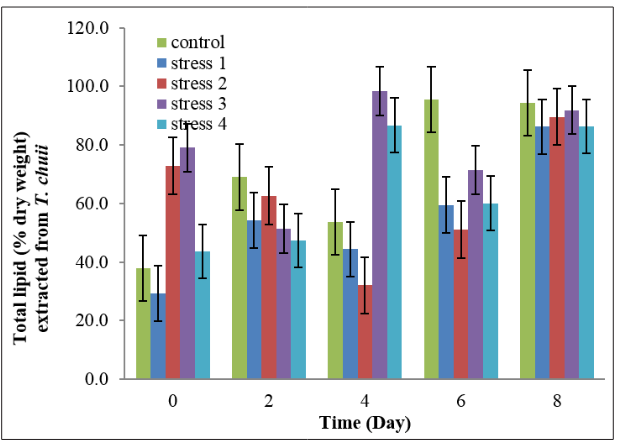
Figure 5: Total lipid (% dry weight) extracted from Tetraselmis chuii culture after stressing in different concentrations of phosphorus. Error bar represents the standard error reading of the respective samples.
Figures 1 and 2 show the growth curve of T. chuii based on the cell density and the optical density reading respectively. From both the figures, T. chuii entered the early stationary phase on day 5.
Comparing the results obtained in this experiment with the previous study the growth of Tetraselmis gracilis cultured in Conway medium [8] entered the early stationary phase on day 6 based on the cell density analysis. Another study showed that Tetraselmis tetrathele had higher population cell density were found in 4-day-old cultures (exponential phase) enriched with Conway medium [19]. Therefore, from the growth curve experiments, Tetraselmis chuii cells were harvested and were stressed into different concentrations of phosphorus in Conway medium on day 4.
Growth curve experiment was conducted in order to identify and plot the growth curve based on the growth of T. chuii cultured under the normal Conway medium. This is important as before the T. chuii was harvested and stressed under different concentrations of phosphorus in the Conway medium, the T. chuii cells at the exponential phase were chosen and preferred to be cultured in the new culture treatments as the cells in the exponential phase were still actively growing.
If the T. chuii cells are too mature, the cells might not grow when the cells were stressed from normal growth condition such as the normal nutrient requirement (in this case refer to phosphorus concentration in Conway medium). The growth of T. chuii will slow down once the nutrient is insufficient or depleted.
The growth of T. chuii under five different phosphorus concentrations was shown in Figure 3. On the first three days (day 0 to day 2), all treatments exhibit a similar growth pattern and the cell abundance increased from 1.6x10 5 to 4.75x10 5 cells/ml.
On the sixth day, stress 1 and stress 2 treatments reached the early stationary phase while control, stress 3 and stress 4 treatments were still at the exponential phase. This is due to the control, stress 3 and stress 4 treatments have sufficient or more phosphorus nutrients in the culture medium which can permit a longer time for the T. chuii to grow. The species can grow faster when the macronutrients are limiting and can grow slower when the macronutrients are sufficient or in excess amount as the species has enough nutrients to support their growth for a longer time [10].
The result of the present study was difficult to be compared with other previous studies as there is a difference in the culture condition, in the growth phase sampled and in the analytic methods. In the present study, total percentage of lipid produced in T. chuii before harvest was 62.29%. After stressed, the total percentage of lipids produced in Tetraselmis chuii in the control, stress 1 and stress 4 treatments decreased whereas increased in the treatment 2 and 3 (Figure 5). The increase and decrease in the total lipids on day 0 compared to total lipids before harvested was depending on the adaptations of T. chuii to grow under a new culture (changes in volume of the culture media and also the concentration of NaH 2 PO4 .2H2 O).
Based on the statistical analysis that has been conducted, the results showed that on day 2, total lipid produced did not vary by different concentrations of phosphorus in the culture medium. There was a very high probability that an F-ratio of this size occurred by chance as p>0.05. The highest total lipid obtained in the control treatment on the same day indicated that T. chuii took time to adapt to the stress treatment.
There was a significant effect (p<0.05) on different concentrations of phosphorus on total lipid extracted from T. chuii on day 0, 4, 6 and 8. According to Figure 5, ANOVA analysis and Tukey test, total lipid in all the treatments on day 4 significantly differed from each other. On the same day, maximal lipid production in T. chuii was found in stress 3 treatment. The significance on day 4 due to the T. chuii growth in all treatment was at the mid-logarithmic phase and at this time, the cells are all growing rapidly and start to show their effects and response towards stress concentrations of phosphorus.
On day 6, control treatment has the highest total lipid compared to the stress treatments. This might be due to the growth of T. chuii in the control treatment starting to be slow down (Figure 3 and Figure 4), indicating nutrients was limiting. At this time, the lipid accumulation in the T. chuii was increasing (Figure 5).
Besides that, this study also showed that T. chuii produced more total lipid in phosphorus sufficient culture medium especially in the control and stress 3 treatment which has quite high percentage of total lipids from the beginning of day 0 to day 8 (Figure 5). This is possible, the potential yield produced is dependent onavailability of total quantity of nutrients. In the present study, the excess amount of phosphorus presence in the culture medium enhanced more lipid production or accumulation. Moreover, it is possible that the growth rate of Tetraselmis sp. to be limited without the limitation on yield production [20].
Phosphorus plays an important role in algal metabolism as it is an essential component for the metabolism to take place. Therefore, deficiency in the phosphorus could affect the biochemical compounds synthesis in microalgal cells. As a response to the deficiency of phosphorus in the environment, lipid accumulation could have occurred [21,22]. This was consistent with the present results shown in Figures 3 and 5.
In the stationary phase, although the phosphorus is depleted from the culture medium, the cells stay metabolically active. The cells are not dividing but the carbon fixation was still going on and the carbohydrate and lipid were accumulating [23]. In the present study, it showed that when the nutrient was depleted (enter stationary phase), the growth of T. chuii slowed down (Figure 3 and Figure 4). From day six onwards, the phosphorus deficiency in all the treatment started to stimulate higher lipid accumulation in T. chuii (Figure 5).
The synthesis of nucleic acids as well as the rate of substrate synthesis and regeneration in the Calvin-Benson cycle would be impacted by phosphorus constraint [24]. In the case of nucleic acid synthesis, once the phosphorus is limiting, the photosynthetic energy conversion will be affected as the rate of synthesis of proteins in the photosynthetic apparatus was reduced which result in the inhibition of protein synthesis and consequently brings in the indirect and less immediate effect on cell metabolism and oxidative stress in the cells. The failure to produce the nucleic acid under the limiting phosphorus will also limits the cell division, thus brings to an increased in cell volume. Continuous aeration or shaking the culture are important in maintaining the cell suspension of the Tetraselmis chuii in order to prevent the T. chuii cells from settling at the bottom of the flask which can results in the death of the T. chuii cells.
Lipid production is affected when phosphorus is deficient. Total lipid produced in all treatments increased when the phosphorus is limiting (towards the stationary phase of the growth). On the other hand, total lipid produced also depends on the total quantity of phosphorus present in the culture media. Phosphorus sufficient culture media, especially in the control and stress 3 treatments have high total lipid accumulation from the beginning till the end of the experiment compared to phosphorus deficient treatments. Maximal total lipid production is found on day 4 of the experiment in phosphorus sufficient treatment (stress 3). In this case, when the amount of phosphorus is in excess, total lipid yield will be higher.
Although several studies regarding the phosphorus limitation have been done previously, however the best concentration of phosphorus in culture media to obtain a maximal growth cannot be finalized as there might have other environmental factors that will affect the growth and it depends on type of species and ability of the microalgae to adapt to it. Therefore, more studies are needed to be carried out in the future in order to find the best or suitable environmental culture conditions to maximize the microalgae growth, thus producing more lipid.
Tetraselmis chuii cultured in different concentration of phosphorus shows different effects towards the growth and the total lipid produced (base on dry weight percent) by this microalga. Presence of the insufficient nutrients will decrease the growth rate of T. chuii and vice versa. Growth of T. chuii in all the treatments are limiting (start to slow down when enter the stationary phase) when the nutrients are depleted.
In the present study, the total lipid production in Tetraselmis chuii was investigated without analyzing the type of lipid content produced. Therefore, further study can be done in future to analyze the type of lipid content present in Tetraselmis chuii as different lipid contents have their own important value to be commercialized or to be utilized in the best way especially in the biotechnology applications such as in the productions of biofuels to substitute the use of fossil fuels.
This study was supported by the Krishi Gobeshona Foundation Project ID: TF 100-F/21 and Chattogram Veterinary and Animal Sciences University grants through University Grant Commission.