Author(s): Karthika Gopalakrishnan
Fraudulent activities within the banking sector represent a persistent threat, constantly evolving to exploit vulnerabilities in financial systems. Despite considerable efforts to combat fraud, financial institutions continue to incur substantial losses annually, underscoring the need for more effective detection and prevention mechanisms. In response to these challenges, the integration of machine learning techniques has emerged as a promising approach to bolster fraud detection capabilities.
The conventional methods of fraud detection, relying on rule- based systems and manual reviews, often struggle to keep pace with the dynamic nature of fraudulent activities. These systems are typically designed to identify known patterns of fraud, making them susceptible to evasion tactics employed by increasingly sophisticated fraudsters. Furthermore, the reliance on manual intervention for reviewing suspicious transactions not only introduces delays but also imposes significant resource burdens on banking institutions.
In recent years, machine learning algorithms have garnered attention for their ability to analyze large volumes of transactional data and identify patterns indicative of fraudulent behavior. Unlike traditional methods, machine learning models can adapt to evolving fraud patterns and detect anomalies in real-time, thereby enhancing the efficiency and accuracy of fraud detection systems. By leveraging advanced analytics and predictive modeling techniques, banks can proactively identify and prevent fraudulent activities, thereby safeguarding their assets and preserving customer trust.
This paper aims to explore the efficacy of various machine learning algorithms in detecting fraud within the banking sector. Using the Credit Card Fraud dataset from Kaggle as a benchmark, we evaluate the performance of Decision Tree, K-Nearest Neighbors (KNN), Logistic Regression, Support Vector Machine (SVM), Random Forest, and XGBoost algorithms. Through a comparative analysis of these algorithms, we seek to provide insights into their strengths and limitations in detecting fraudulent transactions.
In addition to assessing algorithm performance, this study also examines the feasibility of implementing machine learning-based fraud detection systems in real-time banking environments. The paper discusses the challenges and considerations associated with integrating these systems into existing banking infrastructure, highlighting the potential benefits and implications for financial institutions.
Furthermore, this paper outlines potential avenues for future research and development in the field of fraud detection. By addressing the limitations of current approaches and leveraging emerging technologies, such as deep learning and anomaly detection, we can further enhance the effectiveness and scalability of fraud detection systems in the banking sector.
In summary, this paper serves as a comprehensive exploration of machine learning-based fraud detection in banking, aiming to provide valuable insights for researchers, practitioners, and policymakers in the ongoing effort to combat financial fraud and safeguard the integrity of the banking industry.
The dataset utilized in this study is the Credit Card Fraud Detection dataset obtained from Kaggle. This dataset contains a collection of credit card transactions, each labeled as either fraudulent or legitimate. Each transaction is represented by a set of features, including transaction amount, timestamp, and anonymized numerical features derived from the transaction details. Before conducting analysis and model training, it is essential to preprocess the dataset to ensure its suitability for machine learning tasks. The following preprocessing steps are typically performed
The dataset may contain missing values, which need to be addressed before proceeding with analysis. Common techniques for handling missing values include imputation (replacing missing values with a suitable estimate) or deletion of records with missing values.
Numerical features may have varying scales, which can affect the performance of machine learning algorithms. Scaling techniques such as min-max scaling or standardization are applied to normalize numerical features to a common scale.
Categorical variables, such as transaction type or merchant category, need to be encoded into numerical format for analysis. Techniques such as one-hot encoding or label encoding are employed to convert categorical variables into a format suitable for machine learning models.
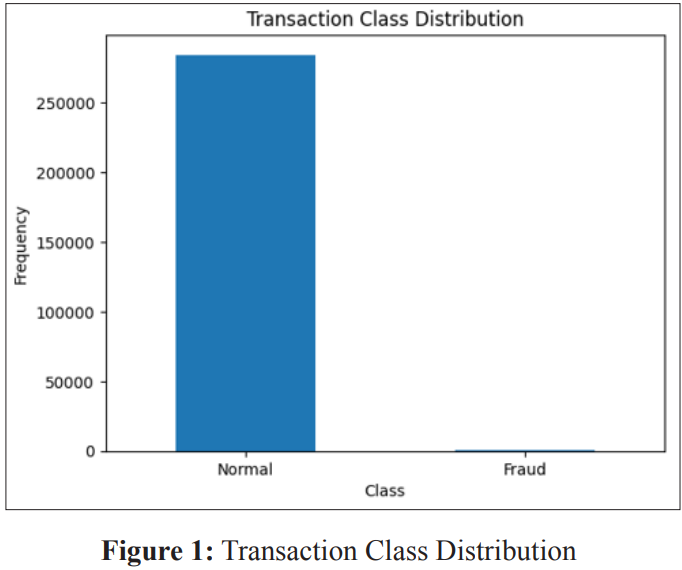
Imbalanced datasets, where the number of instances of one class (e.g., legitimate transactions) significantly outweighs the other class (e.g., fraudulent transactions), pose challenges for model training. Techniques such as oversampling minority class instances or under sampling majority class instances are employed to address class imbalance. Figure 1 shows the number of fraudulent and non-fraudulent activities in the dataset.
Once the dataset has been preprocessed, the following methodology is typically employed for analysis and model training
EDA involves visualizing and exploring the dataset to gain insights into the distribution of features, identify potential correlations, and detect outliers. EDA helps inform feature selection and model development decisions.
Feature selection aims to identify the most relevant features for predicting fraudulent transactions. Techniques such as correlation analysis, feature importance ranking, or domain knowledge-based selection are employed to select informative features for model training.
The preprocessed dataset is split into training and testing sets for model training and evaluation, respectively. Various machine learning algorithms, such as Decision Trees, Logistic Regression, Random Forest, etc., are trained on the training set and evaluated on the testing set using performance metrics such as accuracy, precision, recall, and F1-score.
The performance of each trained model is evaluated based on predefined evaluation metrics. A comparative analysis is conducted to identify the most effective algorithm for fraud detection based on the dataset characteristics and evaluation criteria.
In this section, we will explore the machine learning algorithms used for fraud detection in detail, including their underlying principles, strengths, and applications.
Principle: Decision Tree is a supervised learning algorithm used for classification and regression tasks. It operates by partitioning the feature space into a set of rectangular regions and assigning a class label to each region based on the majority class of training instances within it. Decision Tree learns a hierarchical structure of decision rules to make predictions.
Strengths: Decision Trees are easy to interpret and visualize, making them suitable for understanding the logic behind classification decisions. They can handle both numerical and categorical data and are robust to outliers and irrelevant features.
Applications: Decision Trees are widely used in various domains, including fraud detection, healthcare diagnosis, and customer segmentation.
Principle: KNN is a non-parametric, lazy learning algorithm used for classification and regression tasks. It classifies data points by assigning them the majority class label among their k nearest neighbors in the feature space, where k is a hyperparameter.
Strengths: KNN is simple to implement and does not require training a model, making it suitable for online learning scenarios. It can handle multi-class classification and is effective when the decision boundary is nonlinear.
Applications: KNN is used in various applications such as recommendation systems, anomaly detection, and pattern recognition.
Principle: Logistic Regression is a statistical model used for binary classification tasks. It estimates the probability of a binary outcome (e.g., fraud or non-fraud) based on one or more independent variables (features) using the logistic function.
Strengths: Logistic Regression provides interpretable results in terms of odds ratios and probability estimates. It is computationally efficient, robust to noise, and handles both linear and nonlinear relationships between features and the target variable.
Applications: Logistic Regression is commonly used in fields such as healthcare (e.g., predicting disease risk), marketing (e.g., customer churn prediction), and credit scoring.
Principle: SVM is a supervised learning algorithm used for classification and regression tasks. It creates a hyperplane (decision boundary) that maximizes the margin between data points of different classes in the feature space. SVM can handle linear and nonlinear classification tasks using different kernel functions.
Strengths: SVM is effective in high-dimensional spaces and is robust to overfitting, especially in cases of small training datasets. It can handle both linearly separable and non-linearly separable data.
Applications: SVM is widely used in image classification, text classification, and bioinformatics, in addition to fraud detection.
Principle: Random Forest is an ensemble learning method that constructs multiple decision trees during training and combines their predictions through voting or averaging to improve accuracy and robustness. Each decision tree is trained on a random subset of the training data and features.
Strengths: Random Forest is highly scalable and can handle large datasets with high dimensionality. It reduces overfitting by averaging predictions from multiple trees and provides estimates of feature importance.
Applications: Random Forest is used in various applications such as credit risk assessment, medical diagnosis, and customer churn prediction.
Principle: XGBoost is an advanced implementation of gradient boosting algorithms, which sequentially combines weak learners (decision trees) to create a strong learner. It optimizes a differentiable loss function using gradient descent and incorporates regularization to prevent overfitting.
Strengths: XGBoost achieves state-of-the-art performance in terms of accuracy and efficiency compared to traditional gradient boosting algorithms. It supports parallel and distributed computing and provides built-in capabilities for handling missing values.
Applications: XGBoost is widely used in Kaggle competitions and has applications in various domains such as click-through rate prediction, customer churn prediction, and fraud detection.
Each machine learning algorithm offers unique strengths and characteristics for fraud detection in banking. Decision Tree and Random Forest provide interpretability and handle nonlinear relationships, while Logistic Regression offers probabilistic interpretation. KNN and SVM are effective in handling complex decision boundaries, while XGBoost excels in terms of accuracy and efficiency. The choice of algorithm depends on factors such as dataset size, feature space complexity, and computational resources available. Experimentation and comparative analysis are essential for selecting the most suitable algorithm for a specific fraud detection task.
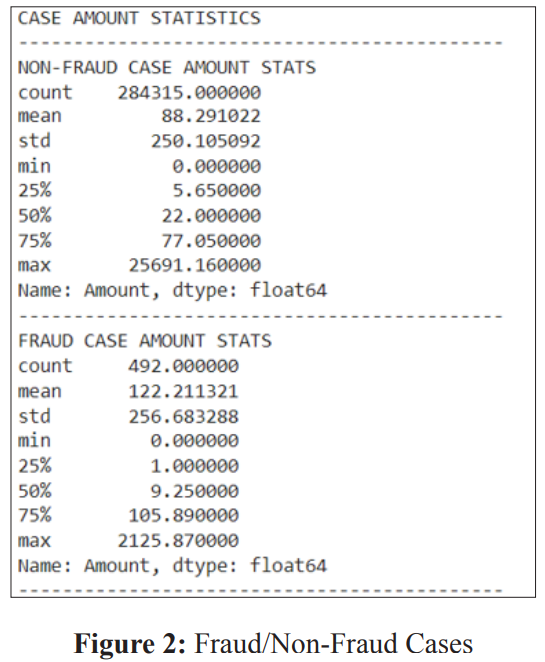
Figure 2 shows the statistics of the fraud and non-fraud cases in the dataset. Upon reviewing the statistics, it becomes evident that the values within the ‘Amount’ variable exhibit significant variation in comparison to the other variables. To address this issue and standardize its scale, we can employ the ‘StandardScaler’ method in Python for normalization.
During this procedure, we will delineate the independent (X) and dependent variables (Y). Subsequently, utilizing these defined variables, we will partition the data into a training set and a testing set, facilitating their utilization for modeling and evaluation purposes. This segmentation can be readily achieved employing the ‘train_test_split’ algorithm in Python. Above mentioned 6 different models are trained on the training set and evaluated on the test set. The trained models are evaluated using the evaluation metrics – accuracy score, F1 Score, and confusion matrix.
The accuracy score stands as one of the fundamental evaluation metrics extensively employed for assessing classification models. It is calculated by dividing the number of correct predictions made by the model by the total number of predictions generated. Optionally, this result can be multiplied by 100 to transform it into a percentage. The accuracy score can generally be represented by the following formula:
Accuracy Score = (Number of Correct Predictions) / (Total Number of Predictions)
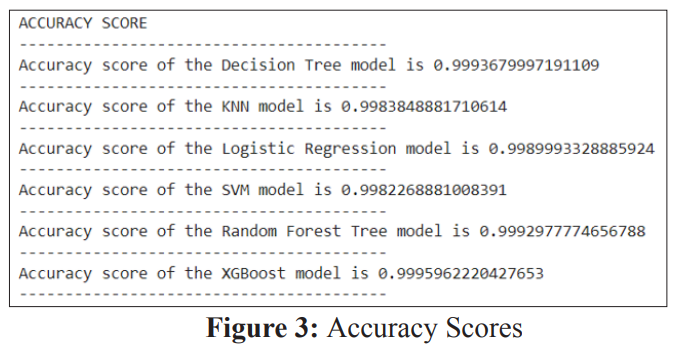
Figure 3 depicts the accuracy score of the different models used in the study.
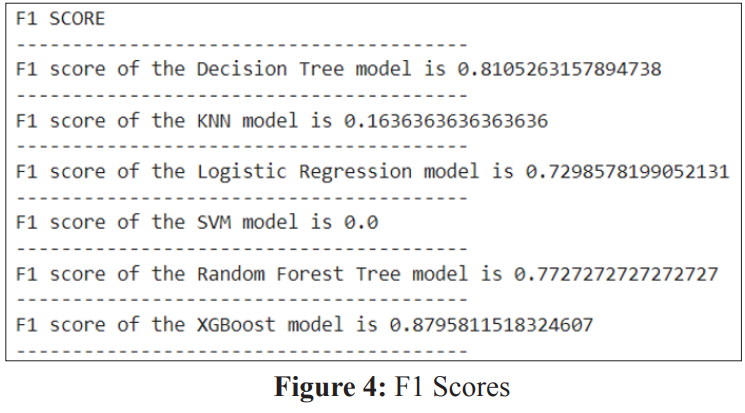
The F1 score, also known as the F-score, stands as a widely utilized evaluation metric for assessing classification models. It represents the harmonic mean of a model’s precision and recall. Calculated by dividing the product of the model’s precision and recall by the sum of the model’s precision and recall, the result is then multiplied by 2. The F1 score can be expressed mathematically as below, and Figure 4 shows the FI Scores of the different algorithms.
F1 Score = 2 * ((Precision * Recall) / (Precision + Recall))
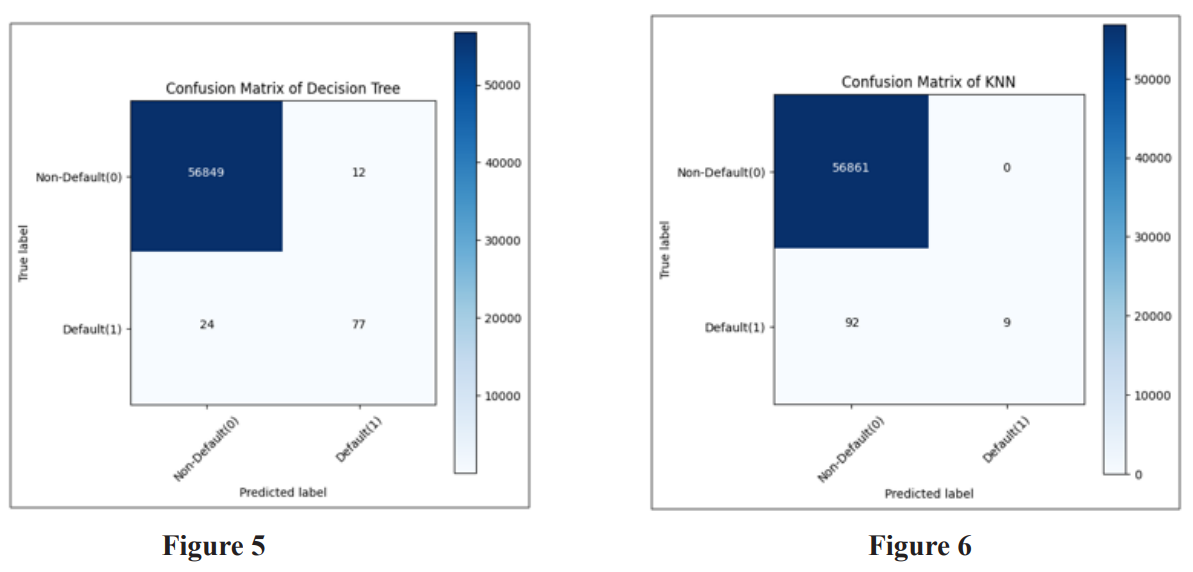
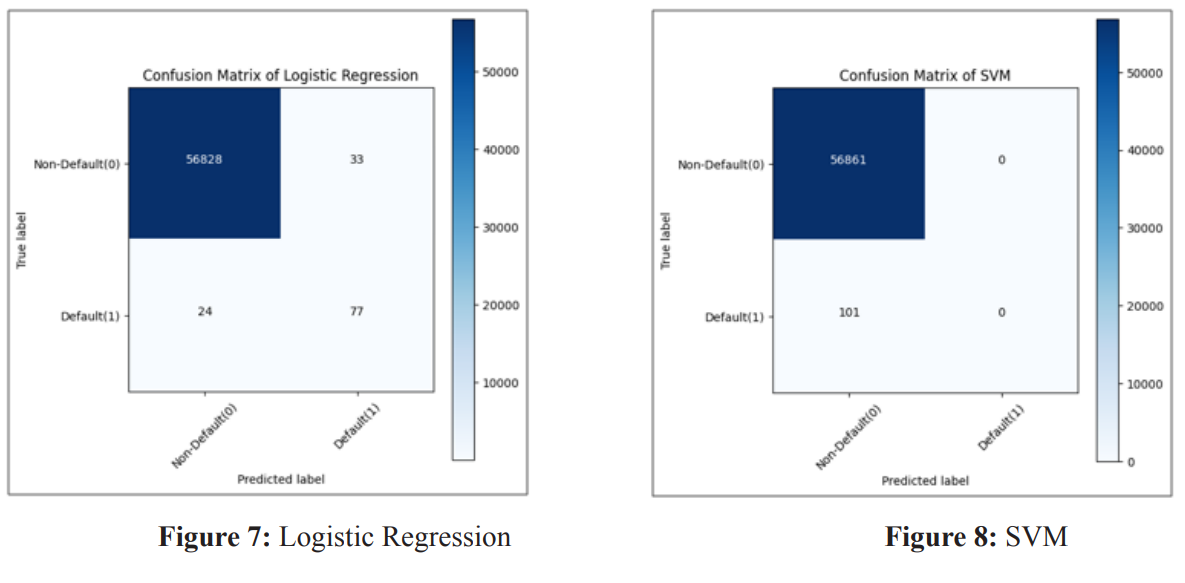
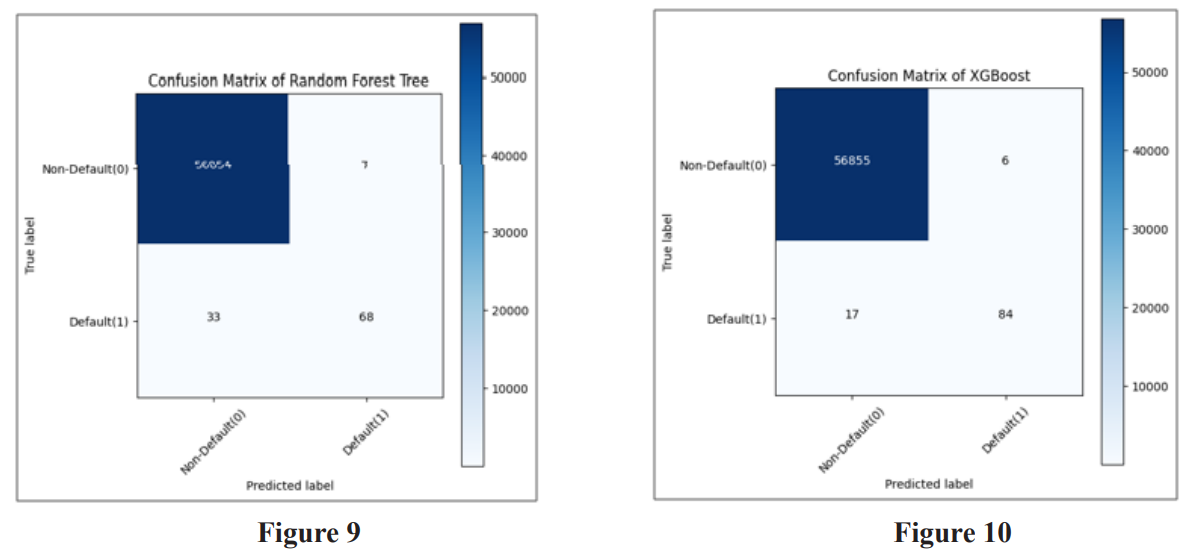
Usually, a confusion matrix serves as a visual representation of a classification model, illustrating the model’s performance in predicting outcomes compared to the actual ones. Initially, the predicted outcomes are stored in a variable, which is subsequently transformed into a correlation table. This correlation table is then utilized to construct the confusion matrix, often depicted as a heatmap. Figures 5 to 10 show the confusion matrix of different algorithms.F1 Score = 2 * ((Precision * Recall) / (Precision + Recall))
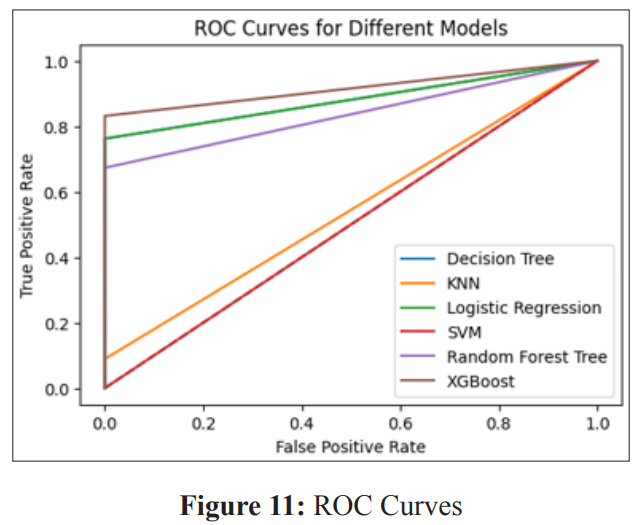
The ROC curve (Receiver Operating Characteristic curve) serves as a graphical depiction of a binary classifier system’s performance as its discrimination threshold undergoes variation. This curve is generated by plotting the true positive rate (TPR) against the false positive rate (FPR) at different threshold settings.
Within the plot, the diagonal line signifies the performance of a random classifier, which possesses a 50% chance of correctly predicting the class. The proximity of the curve to the top-left corner of the plot indicates the classifier’s superior performance. The area under the ROC curve (AUC) serves as a metric for evaluating the overall performance of the classifier. A value of 1 signifies a perfect classifier, while 0.5 represents a random classifier. Figure 11 shows the ROC curves of the different algorithms implemented in the study.
The findings indicate that the XGBoost model attains the highest accuracy score and F1 score, closely trailed by the Random Forest Tree model. Conversely, the Decision Tree model records the lowest accuracy score and F1 score among the evaluated models. Based on the examination of the confusion matrices, the following observations can be made:
In summary, the XGBoost model emerges as the most effective performer, characterized by the highest true positive rate and the lowest false positive and false negative rates among all models evaluated. Also from the ROC Curve, the XGBoost model exhibits the highest AUC, succeeded by the Random Forest Tree, SVM, Logistic Regression, KNN, and Decision Tree models. This highlights XGBoost as the most effective model among the six models under consideration.
Future research directions include:
This paper demonstrates the effectiveness of machine learning in detecting fraudulent transactions in banking. By analyzing the Credit Card Fraud Detection dataset, we evaluated the performance of various ML algorithms. The results provide valuable insights into choosing the most suitable model for fraud detection. Additionally, real-time implementation strategies and potential future research directions are explored. By embracing machine learning, banks can significantly enhance their ability to combat fraud and protect their customers [1-4].