Author(s): Batho P Maballa* and Shaban Ally Mnuli
Based on SMA model, the forecast of number of Malaria cases in Ligula Referral Hospital in Mtwara have been analyzed. The study employed data of LRRH Statistics office from 2013 to 2021. The findings revealed that 3 – years SMA model (with error of 10%) was better than 5 – years SMA model (with error of 14%) in forecasting the number of malaria cases at LRRH. Furthermore, the result showed a slight decrease in number of malaria cases at LRRH for the next two years, that is 2022 and 2023. The number of malaria cases may decrease by 12% and 5% in 2022 and 2023 respectively. This being the case, the government and other stakeholders should put much effort in ensuring there is significant decrease in number of malaria cases.
Malaria is a mosquito-borne disease caused by Plasmodium parasites and transmitted by Anopheles species mosquitoes [1]. Globally, the latest report indicates that the number of malaria cases is increasing. There were an estimated 241 million malaria cases in 2020 compared to 227 million cases in 2019 – an increase of about 14 million cases. About 95% of all malaria cases were in the African Region. The total number of malaria cases in 2020 is essentially the same as that reported in the year 2000. However, over this 20-year period, the population at risk of malaria in sub- Saharan Africa nearly doubled [2].
According to [10], Tanzania is undergoing an epidemiological transition for malaria transmission with some areas of the country having less than 10% (hypoendemic) and other areas greater than or equal to 10% malaria prevalence (mesoendemic) [3]. report asserts that major decline in malaria prevalence has been witnessed in Tanzania [4]. Malaria prevalence among children under the age of five has declined more than 50%, from 18.1% in 2007 to 7.3% in 2017. Importantly, some regions such as Arusha and Manyara have reached a prevalence of less than 1%, while in other regions prevalence has remained high at greater than or equal to 10%. According to the global malaria strategy requires stratification of such areas to target effective malaria interventions [5]. However, the majority (96%) of the population in Tanzania mainland is still at risk for malaria infection [6].
Eradicating or reducing the number of patients with malaria cases is connected to decision making. One of the crucial issue in decision making related to malaria cases is identifying in advance the number of malaria cases or deaths caused by malaria. Prediction of malaria cases or deaths due to malaria have been done using various techniques. For instance [7], used monthly incidence data collected from five states in Sudan with unstable malaria transmission to develop applicable and understood time series models and to find out what method can provide better performance to predict future incidences level. They tested four methods of the forecast namely, autoregressive integrated moving average (ARIMA); exponential smoothing; transformation model; and moving average. The result showed that transformation method performed significantly better than the other methods for Gadaref, Gazira, North Kordofan, and Northern, while the moving average model performed significantly better for Khartoum [3], used Genelized linear models, Poisson and negative binomial regression models to model the Data malaria incidence in Apac district in Uganda. These models were used to fit monthly malaria incidences as a function of monthly rainfall and average temperature. Negative binomial model provided a better fit as compared to the Poisson regression model. The Pearson correlation test indicated a strong positive association between rainfall and malaria incidences [9]. ARIMA model to forecast malaria surveillance in India. They found that the model was highly effective and significant in prediction of future epidemiological surveillance of malaria in India.
Ligula Regional Referral Hospital (LRRH) is largest hospital in Mtwara which receives people with malaria cases both from Outpatient Department (OPD) and Inpatient Department (IPD). The data of malaria cases at LRRH from 2013 to 2021 do not show either increasing or decreasing pattern (LRRH Statistics Office, 2022). This means that in order to be able to make decision on effort to be put in place to reduce or eradicate the number of malaria cases using data from LRRH, it is important to forecast the trend in future using the same data. This may be done by modeling the same data using statistical techniques. This study intends to predict the number of malaria cases for both OPD and IPD at LRRH using moving average methods. The reason for selecting moving averages method is to filters out the noise from random data fluctuations, which provide a better prediction of the trend. To the best level of my understanding no studies which have been conducted in Mtwara region using moving average methods to predict the number of malaria cases in Ligula Hospital.
The secondary data used in this study were collected from Statistics office of Ligula Hospital in Mtwara region. The data included malaria cases for both Outpatient and Inpatients Departments of Ligula Hospital from 2013 to 2021. The data collected from Statistics office of Ligula Hospital is shown in Table 1.
|
Year |
Malaria cases (IPD) |
Malaria cases (OPD) |
Total |
|
2013 |
729 |
226 |
955 |
|
2014 |
1218 |
1371 |
2589 |
|
2015 |
1231 |
37 |
1268 |
|
2016 |
1302 |
456 |
1758 |
|
2017 |
1020 |
177 |
1197 |
|
2018 |
758 |
611 |
1369 |
|
2019 |
630 |
761 |
1391 |
|
2020 |
537 |
779 |
1316 |
|
2021 |
443 |
1086 |
1529 |
Source: LRRH Statistics Office (2022).
LRRH was officially opened on 14/10/1964 by the First President of the United Republic of Tanzania, the late, Mwalimu Julius Kambarage Nyerere and is found in Mtwara region. The hospital serves as a referral hospital for all hospitals in the Mtwara region with a total population of about 1,451,078 million. However, the majority of these patients come from Mtwara and Mtwara Rural Municipal Councils where these Councils do not have district hospitals. At present the hospital has a capacity of 241 beds (bed capacity), the bed occupancy rate is 36% and the average hospital stay (Average length of stay) is 4 days [10].
A moving Average (MA) is a time series constructed by taking averages of several sequential values of another time series. It is a type of mathematical convolution [11]. Though, there are numerous MA methods, in this study Simple Moving Average (SMA) methods were employed.

The Simple Moving Average (SMA) for 3-years was developed first, followed by the Simple Moving Average (SMA) for 5-years. The error computation for each model which included Mean Absolute Deviation (MAD), Mean Square Error (MSE) and Mean Absolute Percentage Error (MAPE) between SMA for 3-years and SMA for 5-years was done. The results that indicate the forecast of number of malaria cases for both 3 – years SMA and 5 –years SMA and their corresponding errors are shown in Table 2.
|
|
|
|
|
Errors due to 3- years SMA |
Errors due to 5-years SMA |
||||
|
|
|
|
|
138 |
28046 |
10 |
178 |
46944 |
14 |
|
|
|
|
|
|
167 |
|
|
217 |
|
|
Years |
Total |
3-years SMA |
5- years SMA |
MAD |
MSE |
MAPE |
MAD |
MSE |
MAPE |
|
2013 |
955 |
|
|
|
|
|
|
|
|
|
2014 |
2589 |
|
|
|
|
|
|
|
|
|
2015 |
1268 |
1604 |
|
336 |
112896 |
26 |
|
|
|
|
2016 |
1758 |
1872 |
|
114 |
12996 |
6 |
|
|
|
|
2017 |
1197 |
1408 |
1553 |
211 |
44521 |
18 |
356 |
126736 |
30 |
|
2018 |
1369 |
1441 |
1636 |
72 |
5184 |
5 |
267 |
71289 |
20 |
|
2019 |
1391 |
1319 |
1397 |
72 |
5184 |
5 |
6 |
36 |
0.4 |
|
2020 |
1316 |
1359 |
1406 |
43 |
1849 |
3 |
90 |
8100 |
7 |
|
2021 |
1529 |
1412 |
1360 |
117 |
13689 |
8 |
169 |
28561 |
11 |
Table 3 and figure 1 indicate the actual and forecasted number of malaria cases at LRRH. Generally the result shows a decreasing trend as revealed by the forecast equation, that is y = -60.393+ 1850.2. This being the case, based on the 3- years SMA model, the number of malaria cases is expected to be decreasing year after year.
|
Period |
Total |
3- SMA |
Number of Malaria cases decrease in 2022 and 2023 (in %) |
|
2013 |
955 |
|
|
|
2014 |
2589 |
|
|
|
2015 |
1268 |
1604 |
|
|
2016 |
1758 |
1872 |
|
|
2017 |
1197 |
1408 |
|
|
2018 |
1369 |
1441 |
|
|
2019 |
1391 |
1319 |
|
|
2020 |
1316 |
1359 |
|
|
2021 |
1529 |
1412 |
|
|
2022 |
|
1,246 |
12 % |
|
2023 |
|
1,186 |
5% |
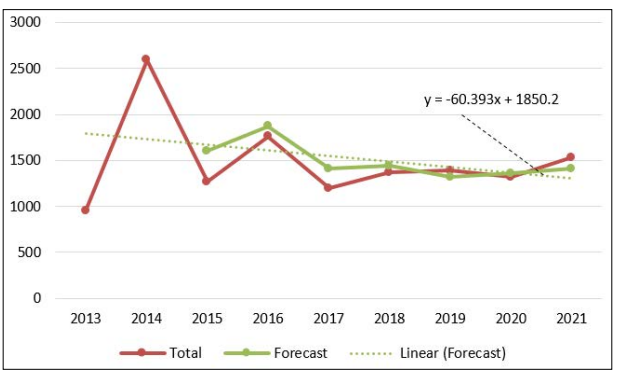
Figure 1: Shows Actual and predicted number of Malaria cases at LRRH
Based on the result obtained in Table 2, 3 – years SMA and 5- years SMA models are compared to get the model which forecasts the number of malaria cases at LRRH accurately. The result indicated that 3 – years SMA model is better than 5 – years SMA model. 3 – years SMA model has smaller errors than the 5 –years SMA model as shown in Table 4 and Figure 2.
|
Error type |
3-Year SMA Model |
5-Years SMA Model |
|
MAD |
138 |
178 |
|
MAPE |
10 |
14 |
|
MSE |
167 |
217 |
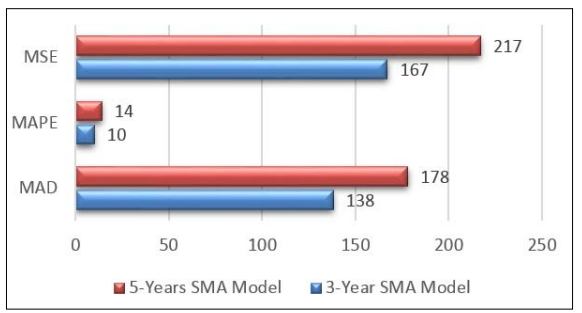
Figure 2: Forecasting accuracy measures
Generally, MAPE is the most preferred forecasting accuracy measures since MAPE states the percentage error in the forecasting of the actual result during a certain period. MAPE usually provides information on whether the percentage error is too high or too low. According to Nathania (2021), the MAPE value range of less than 10%, between 10% - 20%, between 20% - 50% and greater than 50% indicate very good, good, decent and bad forecasting model ability respectively. In view of the MAPE value range specified in table 4 and figure 2, both models are in the range of 10-20% which can be taken as having good forecasting model ability. According to, the smaller the error rate generated, the better the forecast [12]. With an error rate of less than 5%, it means that the forecasting already has an accuracy rate of more than 95% and the results can be said to be accurate. Referring to the errors in table 4 and figure 2, 3 – years SMA model is better than 5- years SMA model because it has low MAPE value of 10%, which means that model has ability of forecasting accurately the number of malaria cases at LRRH by 90%. Furthermore, by comparing the value of MAD and MSD of both models, it is clear that 3 – years SMA model has a lower value of both measurements. Therefore, we can conclude that the forecast done by using the 3 – years SMA model is slightly more accurate than the forecast done by using the 5 – years SMA model.
In view of table 3 and figure 1, the result reveal that the number of malaria cases is expected to be decreasing year after year. The result reveals that in 2022 and 2023 the number of malaria cases is forecasted to be 1,246 and 1,186 respectively. However, the number of malaria cases decrease is not significant. The number of malaria cases may decrease by 12% and 5% in 2022 and 2023 respectively. This finding is in line with the result obtained by which asserts that major decline in malaria prevalence has been witnessed in Tanzania [4].
The model forecast shows a slight decrease in number of malaria cases at LRRH for the next two years, that is 2022 and 2023. The number of malaria cases may decrease by 12% and 5% in 2022 and 2023 respectively. This being the case, the government and other stakeholders should put much effort in ensuring there is significant decrease of number of malaria cases [13-15].