Author(s): <p>Stuart A Harris</p>
The Earth is the third planet rotating around the sun that formed about 4.543 Ga (billion years) before the present (B.P.). There are three theories regarding the method of its formation, but all three assume that the planets including the Earth formed by coalescence of a disc of dust and gasses left over from the formation of the Sun swirling around in space in a disc-like plane [1, 2]. The sun had already formed in the centre of the system and provided solar energy radiating outwards, currently supplying about 99.6% of the energy arriving on the surface of the Earth. Each of the planets making up the solar system has a different atmosphere and composition, but only the Earth has life on it based on energy involving photosynthesis to capture solar energy using carbon dioxide to produce sugars and other organic compounds as well as oxygen for the air:
6H2O + 6CO2 =(C6h42O6) + 6O2 Equation 1.
The organic compounds are used to produce plants and other forms of life, e.g., lichens, algae, etc., as well as the food for animals. If for any reason photosynthesis became impossible, the life on land would die followed by the marine life. The surface of the Earth would become barren like the other plants, and Mankind would have been exterminated.
This paper will discuss the evolution of the present atmosphere and climate changes on Earth and emphasize the importance of carbon dioxide in keeping the environment suitable for the continuation of life as we know it. The development of the atmosphere since the beginning of the Earth’s formation will be described together with an explanation of the importance of carbon dioxide in keeping the life on Earth going despite the tendency for this gas to become lost to the atmosphere by combining with calcium ions in the sea during cold glacial periods to form limestone rocks by the irreversible reaction:
2Ca++ + 2CO + O2= 2CaCO3 Equation 2.
This is due to the carbon dioxide becoming far more soluble in the very cold sea water during long cold Glacial events than in the warmer water during the short warm Interglacial. Periods. This has resulted in the development of the widespread thick limestone rocks made of aragonite in Precambrian and Paleozoic times which are important components of the stratigraphic column especially in former geosynclines.
The history of the Earth can conveniently be divided into Eons which are periods of major changes in the development of the Earth. Each one is based on a major change in the processes operating on the surface of this planet. The sun provided only 75% of present-day solar energy during the first Hadean Eon [3]. The solar radiation reaching the Earth has gradually increased since then.
This is named for the fact that the material at the beginning of the Earth was molten with plumes of gases such as nitrogen, hydrogen, helium, and water vapour being ejected from volcanoes to form the beginnings of the atmosphere. The hydrogen and helium mainly escaped into space at this time. The Earth also underwent heavy bombardment with meteors and other debris from space until after the Great Bombardment of 4.1-3.5 Ga B.P. [4]. The loose non-gaseous matter was differentiating into molten layers of different densities with iron and nickel moving to the centre of the mass within about 10 years, where the greatest density (c.12.5) was developed. This dense core is still slowly growing in diameter and consists of a solid core surrounded by a layer of similar composition but with the properties of a liquid when earthquake waves moving through the Earth collide with it [5, 6].
Surrounding the core is the mantle composed of less dense rocks with a chemical composition similar in mineralogy to the dark coloured basic igneous rocks called sima. It has a density of 5.5 near the core grading outwards to 3.3 at its outer surface where it consists of olivine, pyroxenes and plagioclase feldspar. It was the dominant component of the original surface of the crust of the Earth. It was the dominant component of the sial at first. Subsequently the lighter components of the sial produced by weathering of these rocks have a density of 2.9, forming a layer of light-coloured rocks we see today in granites. These typically consist of quartz, micas, and orthoclase feldspar. About 4.527 Ga B.P., an asteroid the size of Mars either hit the Earth or came very close to it causing some of the molten surface layers of the Earth to split off and form the moon [7].
The composition of the atmosphere was partially controlled by the anaerobic gases coming out of volcanoes but modified by the effect of the Earth’s gravitational attraction. The gases with a molecular weight less than 28 tended to escape into space, e.g., hydrogen, helium, and methane, whereas those with greater molecular weights such as hydrogen sulphide and sulphur dioxide would have tended to accumulate on the lower ground [8]. The small quantities of methane would have been quickly oxidized in the next Eon and is believed to have been the main source of carbon in the seas [9]. In the early stages of the formation of the Earth, nitrogen (molecular weight 28) was the inert gas that mainly accumulated in the atmosphere. Water vapour (molecular weight 18) also tended to rise upwards in the atmosphere but cooled below its temperatures of condensation to form clouds and even cooled below its freezing point to commence the precipitation in the form of snow. The frequency of the occurrence of precipitation would have increased over time as more water vapour was emitted from the ground. As soon as the ground surface cooled enough, water would start to accumulate in depressions on the ground surface and lakes and seas would start to develop. However, there is no evidence suggesting that appreciable quantities of oxygen or carbon dioxide were present in the atmosphere during this Eon.
Most of the minerals in the rocks that formed under considerable heat and pressure are unstable under the conditions at the surface of the Earth. Once the Earth started to have precipitation in the form of water and snow, the processes of weathering with transport of surface sediments downslope towards the depressions and sea would have begun. [10] summarizes the chemical weathering sequence which ends in the formation of quartz sand (SiO2). The montmorillonite stage would be absent because of the lack of calcium carbonate in the rocks [11]. The first mineral to decompose by chemical weathering would be olivine ((Mg, Fe)2SiO4) in the simatic rocks followed by pyroxenes and hornblende producing clay minerals and silica (SiO2). Similarly, plagioclase feldspar (Na-Ca) (Si,Al)4 O8) would yield SiO2 and both Na and Ca++ions which would be carried in solution down to the waterbodies. Anorthite (CaAl2SiO2O8) is less abundant than plagioclase feldspar but provides Ca++ ions as well as both clay minerals and silica.
The sodium ions reacted with chlorine ion in the sea to produce the salinity typical of the oceans, tho ugh the exact source of the large quantities of sodium chloride is unknown. The clays, silt, and sand travelled in the rivers although they represented under half of the weathering products being transported by water, and erosion of shorelines would be occurring. These sediments could also be moved about by winds which could be very strong given the contrasts in temperature of the ground surfaces. The earliest detrital zircons date back to 4.48 Ga B.P by which time weathering and erosion of the surface of both the surface of the sial and the shorelines of lakes and the seas would have been very active [12].
During this Eon, the geothermal gradient was much higher than today which probably resulted in faster flowing convection currents moving the land areas around. Another suggestion is that towards the end of this Eon, the surface of the Earth consisted of arcs of land covered in volcanoes forming islands in the seas. It is doubtful whether the land areas had yet become plates interacting with one another.
This Eon is partly based on the strong fragmentary evidence obtained indicating that life was present during this Eon [8, 9]. The strongest evidence is the presence of marine Aragonite deposits together with apparent glacial tills from the Polisanka Sedimentary Formation on the Kola Peninsula dated at 3.8 Ga B.P. Aragonite is a form of calcium carbonate that is deposited in a cold marine environment after oxidation of methane in the atmosphere:
CH4 + 2O2 = CO2 + 2H2O Equation 3.
The carbon dioxide then partially dissolves in water where it can combine with Ca++ ions to form the aragonite. To obtain the necessary oxygen, there must have been organisms producing it by photosynthesis. These single-celled organisms are most likely the methanotrophs reported to be present at this time by Bowman [13]. The oxygen would also permit the formation of an ozone layer in the stratosphere which would block out ultraviolet light, so enabling the survival of a wide range of life that could not otherwise survive. Carbon found in 3.8-billion-year-old rocks (Archean Eon) from islands off western Greenland may be of organic origin [14]. Well-preserved microscopic fossils of bacteria older than 3.46 billion years have been found in Western Australia [15] . Probable fossils 100 million years older have been found in the same area. Around 3.5 billion years ago (Ga), two supercontinents, called Vaalbara and Ur formed within half a billion years of each other.
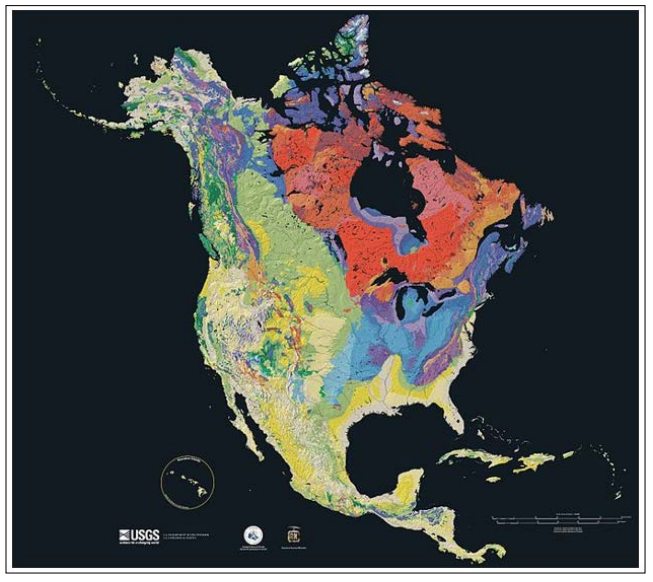
Figure 1: Distribution of Archean rocks forming the Laurentian Shield (red and pink) and underlying much of the rest of the continent (©USGS).
Figure 1 shows the distribution of Archean rocks in North America. They form the basement to most of the younger rocks which overlie the Shield elsewhere in most of the continent. During the Archean Eon (4,000 to 2,500 million years ago), the Earth's crust had cooled enough to allow the rocks and continental plates to form. Some scientists think because the Earth was hotter, and that convection currents would have been more vigorous than it is today, rates of recycling of crustal material would have been much faster. This may have prevented formation of continents until convection slowed down. Others argue that the subcontinental lithospheric mantle was too buoyant to subduct and that the lack of Archean rocks is a function of erosion and subsequent tectonic events. Some geologists view the sudden increase of aluminum content in zircons as an indicator that Simatic volcanic rocks were being extruded at the land surface [16].
Around 3.5 Ga ago B.P., two small supercontinents, called Vaalbara and Ur formed within half a billion years of each other. They were about the size of India and were the first contiguous land masses to be formed. Unlike with the Hadean Eon, Archean oceanic rocks are often heavily metamorphized deep-water sediments, such as graywackes, mudstones, volcanic sediments and banded iron formations consisting of alternating high- and low-grade metamorphic rocks called greenstone belts. The high-grade rocks were derived from volcanic island arcs, while the low-grade metamorphic rocks represent deep-sea sediments eroded from the neighboring island rocks and deposited in a forearc basin. In short, greenstone belts represent sutured protocontinents [17].
The most striking feature of the Lower Transvaal Supergroup stromatolitic dolostones (Kange Basin, Botswana) is that they represent the first major deposit of limestone in the marine environments that subsequently was subjected to dolomitization [18]. These would most likely have been deposited during the cooling of the atmosphere prior the start of the first Huronian glacial event as atmospheric carbon dioxide became dissolved in the seas and reacted with the Ca++ ions and dissolved oxygen in the seas to produce large amounts of calcium carbonate (see equation 2).
The banded ironstone found in the volcanic arcs that are dated from around 3.5 Ga B.P. are evidence that atmospheric oxygen had taken finally over from the sulphurous gases (hydrogen sulphide and sulphur dioxide) that had previously reacted with the metallic rocks to produce the sulphide ores of many metals [19]. This atmospheric oxygen resulted in oxidation of the iron oxide deposits (Fe2O3) to produce the haematite (FeO) ores. These rocks do not allow the determination of the details of the climate while the position of the land areas on the Globe has yet to be determined. The ozone layer above the Earth would have formed at this time.
The Earth's magnetic field was established by 3.5 billion years ago. The solar wind flux was about 100 times the value of the modern Sun, so the presence of the magnetic field helped prevent the planet's atmosphere from being stripped away as is thought to have happened on Mars.. However, the field strength was lower than at present and the magnetosphere was about half the modern radius [18].
The first glaciation was probably that described from the Kola Peninsular dated at 3.8 Ga B.P. and the second was the Huronian glaciation (Figure 3) that affected a large area in Canada. The evidence for it includes tillites, patterned ground, etc. The Huronian Glaciation was a part of a series of protracted climatic refrigeration events that extensively affected the Earth, occurring between 2.45 and 2.22 Ga in association with the rise of atmospheric oxygen. Three glaciations of that series that are regarded as the classical Huronian ice ages are bracketed in time between ~2.45 and 2.32 Ga B.P. A fourth event, recognized so far only in South Africa, is dated at ~2.22 Ga in age. During these events, glaciers covered continents, extended to low latitudes (Figures 3 and 4), and reached to sea level. The ice ages were followed by a protracted time interval with warm and humid conditions. The Huronian Supergroup are exposed on the north shore of Lake Huron in Ontario, Canada, between Sault Ste. Marie, Sudbury, and Cobalt.
There is evidence that life could have evolved earlier than 4.28 Ga B.P. but it is nonproven. Some scientists even speculate that life on Earth could have begun in the Early Archean with species surviving the Late Heavy Bombardment period in hydrothermal vents below the Earth’s surface [13, 9].
The Stromatolites (Figure 2) are found in several parts of the world and consist of coatings of rocks. They first appear after 2.5 Ga B.P. and appear to have corresponded to increased atmospheric carbon dioxide and oxygen levels producing a sudden peak in these gases.
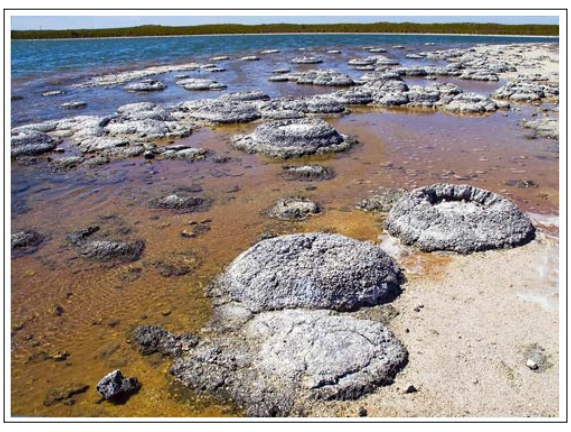
Figure 2: Archean fossil Stromatolites from Australia (B. Ruth).
This suggests that photosynthesis had evolved. It has been estimated that complex multicellular organisms may have appeared as early as 2100 Ma B.P. [18-20]. Multicellularity encompasses everything from simple bacterial colonies to badgers. Photosynthesis is believed to have developed in Late Archean Era with the appearance of Stromatolites [20-26]. These micro- organisms build up mats around sand grains (Figure 2). Other possible early complex multicellular organisms include a possible 2450 Ma red algae from the Kola Peninsula [26] and simple discs and rings (Figure 1). However, the interpretation of ancient fossils is problematic, and "... some definitions of multicellularity encompass everything from simple bacterial colonies to badgers" [1].
The Proterozoic Eon is often divided into the Paleoproterozoic (2.5 billion to 1.6 billion years ago), the Mesoproterozoic (1.6 billion to 1 billion years ago), and the Neoproterozoic (1 billion to 541 million years ago) eras. Proterozoic rocks have been identified on all the continents and are often important sources of metallic ores, notably of iron, gold, copper, uranium, and nickel. Once again, this Eon was marked by the land areas accumulating in one area of the Earth’s surface and they were very important changes occurring in the Earth’s atmosphere.
Figure 3 shows the timing of the main glaciations from the end of the Archean Eon until the Pliocene Period. There were only four glaciations during this Eon, one occurring at beginning of this Eon, two small ones in the middle, and one near the end (23-24 Ma B.P.) or at the end of this time period. In between was a long period during which the early continents were coalescing prior to their eventual breakup. The glaciers were at low altitude resulting in the building of the beginnings of continental shelves composed of glacial outwash and the products of the land surface.
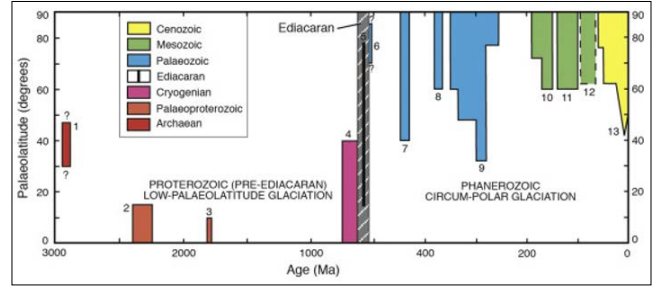
Figure 3: Palaeolatitudinal extent of glacial deposits for (1) Archaean, (2) early during Palaeoproterozoic, (3) late Palaeoproterozoic, (4) Cryogenian, (5) Ediacaran, (6) Cambrian[30] as well as the. Palaeoequatorward extent of ice-rafted deposits for (7) late Ordovician–early Silurian, (8) late Devonian, (9) early Carboniferous–late Permian, (10–12) early Jurassic–late Cretaceous, (13) Cenozoic [31). Note change of timescale at 500 Ma, as well as the change in palaeolatitudes with time.
The oxygen released into the atmosphere could not build up to any significant degree until mineral sinks of unoxidized sulphur and iron had been, exhausted. Until roughly 2.3 Ma B. P., oxygen was probably only 1% to 2% of its current level [24]. Thereafter the oxygen content of the atmosphere increased to about 10%. Banded iron formations composed of haematite, which provide most of the world's iron ore, are not found in rocks younger than 1.9 Ma, after all the iron in the oceans had been oxidized [24-26].
There was an abrupt change in the angle of tilt of the Earth’s magnetic field during the last (Ediacaran) glaciation although the land areas appear to have been moving south across the equator during the Archean Eon (Figure 4). It is unclear whether this marks a near collision with another celestial body or whether there was a sudden change in the magnetism of the core of the Earth. No evidence has been reported for a near miss at that time. The path of the Earth around the sun and the speed of rotation around the sun may also have changed [37]. have suggested that the change in composition of volcanic magmas from Mg-siliceous sialic magmas to Fe-Ti rich basaltic magmas in the latter part of this Eon may have altered the Earth’s magnetic field enough to cause the changes but this has yet to be proven.
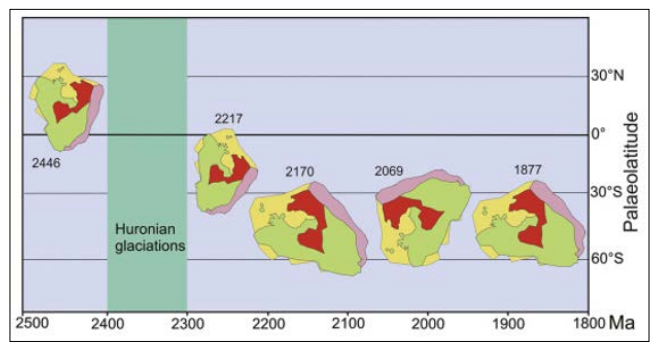
Figure 4: Change in the orientation and latitude of a single lock of land during the Proterozoic period.
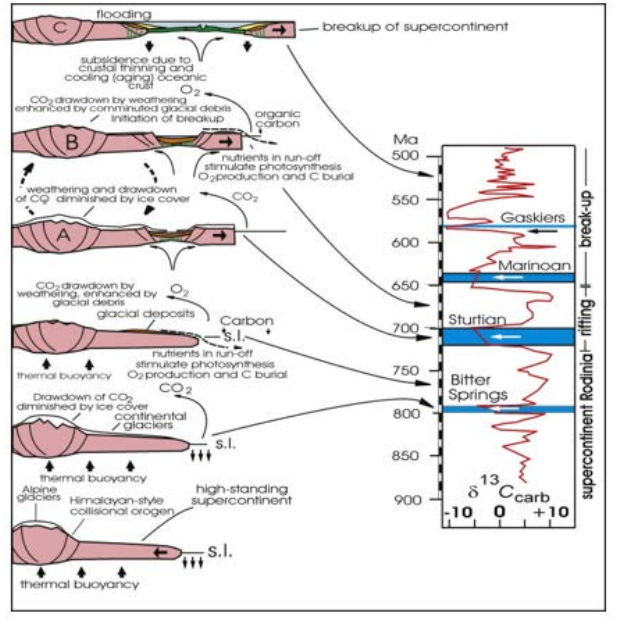
Figure 5: Coalescence of Cratons to produce the super continents and their eventual breakup, during the latter part of the Proterozoic Eon together with the changes in atmospheric gases based on carbon and strontium isotopes [28-30]
Figure 5 shows the evolution of the surface of the land areas with time during the Proterozoic Era The individual volcanic land areas gradually coalesced into land areas looking more like present-day continents. They probably consisted of a single land mass at one time but were soon torn up by underlying convection currents. Collision of plates resulting in the formation of rift valleys and subduction zones which were marked by undersea canyons and linear mountain chains.
The solar radiation reaching the Earth was about 85% of the present-day amounts so that at least four glaciations occurred during this Eon (Figure 3). The Raptian occurred at about 2.3-2.4 Ga B.P. followed by a second at 1.7 Ma B.P. and a warmer period that lasted until 750 Ma B.P. [30]. Then two apparently separate glaciations occurred before 540 Ma B.P. The first of these occurred during the change in palaeolatitude and deposits of glacial till together with patterned ground and pingos of this age are found on most continents. This cold period is sometimes referred to as “Snowball Earth,” but since it occurred during the change in the Earth’s magnetic field, the latter may be part of the reason for its extremely wide distribution. The marine deposits do not show evidence suggesting that the seas completely became frozen over. Associated with the latter are limestone deposits suggesting that the cold temperatures were causing large quantities of carbon dioxide to be absorbed by the sea where it combined with calcium ions to form limestone (Equation 2 above). This would have taken large quantities of carbon dioxide out of the atmosphere since calcium ions were readily available in the sea due to weathering of anorthite and other calcium bearing minerals.
Early in this Eon, fossils of the 1600 Ma Rafatazmi and a possible 1047 Ma B. P. Bangirmorpha red algae have been reported from the Canadian Arctic [31,32]. During the Raptian glaciation, simple discs and rings have been found in the rocks. Around 1 billion years ago, the first multicellular plants emerged, probably green algae The earliest fossils widely accepted as complex multicellular organisms date from the Ediacaran Period [26, 27]. Possibly by around 900 Ma B.P. true multicellularity had also evolved in animals [33-35]. A very diverse collection of soft-bodied forms is found in a variety of locations worldwide and date to between 635 and 542 Ma B.P.
The Phanerozoic Eon started approximately 542 million years ago. It consists of three eras: the Paleozoic, Mesozoic, and Cenozoic and is the time when multi-cellular life greatly diversified into almost all the organisms known today [25, 26]. It includes the formation of a major supercontinent which subsequently broke into many of the continents known today. The Paleozoic era was the first and longest era of the Phanerozoic Eon, lasting from 542 to 251.902 Ma [24]. It includes the Cambrian, Ordovician and Silurian periods. This was the time of the appearance of a remarkable variety of marine biota of which many modern groups of life have survived by natural selection. Life also colonized the land, firstly by plants, subsequently by animals. Two major extinctions occurred.

Figure 6: Possible arrangement of some of the continents making up Pangaea [24].
There have been three major glaciations during the Phanerozoic (the past 540 million years), including the Andean/Saharan (recorded in rocks of South America and Africa), the Karoo (named for rocks in southern Africa), and the Cenozoic glaciations. The Karoo was the longest of the Phanerozoic glaciations, persisting for much of the time that the supercontinent Gondwana was situated over the South Pole (~360 to 260 Ma). It covered large parts of Africa, South America, Australia, and Antarctica.
The continents formed at the break-up of Pannotia and Rodinia supercontinents at the end of the Proterozoic slowly moved together again, forming the supercontinent Pangaea in the late Paleozoic (Figure 6, [26]). It should be noted that North America had already separated from Pangaea so that its position is not shown on the map. Pangaea lasted from 300-180 Ma B.P. During the early part of this Era, weathering and erosion of the land areas produced shallow continental shelves with clay surfaces which periodically slumped or flowed downslope entombing the biota on the sea floor. The breaks between the former supercontinents developed volcanoes causing sea levels to rise and inundate the low-lying land areas [36, 37].
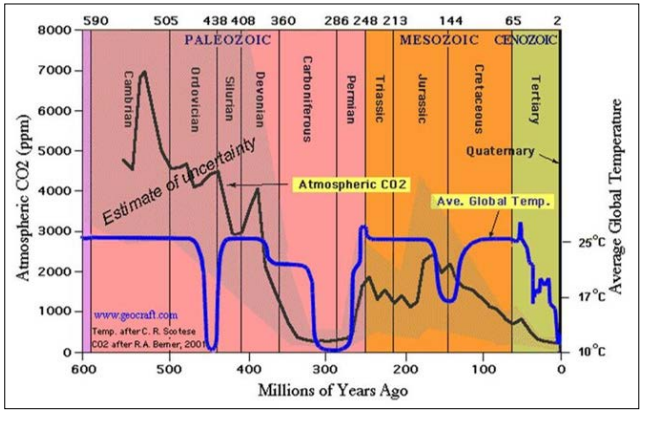
Figure 7: Graph showing the average global temperature of the surface of the Earth compared to the atmospheric carbon dioxide content of the lower atmosphere from 550 million years B.P. to the present time [38]
The early Paleozoic climates were about 15°C warmer than today, but the end of the Ordovician saw a short drop in air temperature of about 15°C which ended before the beginning of the Silurian Period. Glaciers covered the area around the south pole in Gondwanaland (Figure 7). Traces of glaciation from this period are only found on the continents of former Gondwana but not elsewhere. The atmospheric carbon dioxide decreased from a high of 7000 ppm in the Cambrian Period to c.4200 in Late Ordovician times and a significant extinction of marine animals took place. In addition, calcareous muds were deposited, presumably due to more carbon dioxide being dissolved in the seas and the reaction of dissolved carbon dioxide and oxygen with Ca++ ions in the water [39,40].
The carbon dioxide content of the air recovered during the first part of the Silurian Period as the air temperature warmed to over 25°C [41]. However, by the mid-Devonian Period, a cold event in Africa (the Karoo Glaciation lasting c.3.6-2.6 Ma B.P.) resulted in the carbon dioxide content of the atmosphere plunging to under 500 ppm in the Mid-Carboniferous Period. The latter is surprising at first glance since the abundant forests that were to provide the carbon for the widespread coal measures would have produced a large quantity of oxygen. Obviously, the loss of carbon dioxide by solution into the ocean followed by the precipitation of calcium carbonate was enormous. The coal measures consist of alternating horizons of coal together with clastic sediments including limestone representing near- shore and freshwater swamp deposits due to numerous alternating periods of fluctuating sea levels which represent fluctuations in the Karoo glacial events occurring around high-latitude regions of Africa that were then around the South Pole. The continued low abundance in atmospheric carbon dioxide is consistent with the formation of vast calcareous mud formations formed in the oceans elsewhere during the Devonian and Carboniferous Periods. However, the air temperatures on land were still dropping during the Late Carboniferous period marking the commencement of a major climatic change in the former forested areas together with another mass extinction of the biota. During the Carboniferous Period, atmospheric carbon dioxide dropped as below 1000 ppm.
The Mesozoic ("life") era is subdivided into the Permian, Triassic, Jurassic, and Cretaceous periods [40]. Deserts and evaporite deposits were abundant on the areas that were close to the equator on the North American Plate [42, 43]. The later Jurassic and Cretaceous Periods were times when calcareous marine deposits of organic origin were commonly deposited in the seas. There were two periods with extinction of many species.
Pangaea was a supercontinent that existed from about 300 to 180 Ma. Figure 6 shows the outlines of the modern continents and other landmasses at this time. The supercontinent of Pannotia had broken apart into the smaller continents Laurentia, Baltica, Siberia and Gondwana UCMP [44]. The areas between the continents developed new volcanic sediments causing sea level to rise and inundate the lowlands of the continents.,
The continents Laurentia and Baltica collided between 450 and 400 Ma B.P. during the Caledonian Orogeny, to form Laurussia (also known as Euramerica) [45]. By 180 Ma B.P., Pangaea had broken up into Laurasia and Gondwana.
Deserts were abundant on land that were close to the equator in land areas in North America, while evaporite beds were deposited in shallow seas in Central Europe. The air temperatures on land were about 25°C while the temperatures in the shallow Tethys Sea were close to 40°C.
Cold weather was widespread in the first half of the Permian Period with cold temperatures resulting in a significant extinction event in the fossil record [46]. Mean annual temperatures on land rose from the cold 10°C average temperature during the first half of the Permian to 26C at the Triassic-Permian boundary, dropping a degree until the Mid Jurassic Period. However, the atmospheric carbon dioxide content which had been c. 400 ppm during the Permo-Triassic glaciation rose slowly to 2000ppm. The climatic changes resulted in weak mass extinction of many species including some dinosaurs. It caused low biodiversity for a while.
The climate appears to have been rather variable with an increase in mean air temperature on land to 25°C until late Triassic time when it dipped to c. 16°C. During this time atmospheric carbon dioxide was also variable, rising to 2500ppm in mid Jurassic times before starting a general decrease which continued into the Cenozoic Era. This is probably why the dinosaur species occur throughout the Cretaceous Period, but each species appears to have survived for only a short time. Thus, they had a different history and environmental controls probably with finding adequate food supplies being the critical factor since they were the largest animals present in the food chain.
This was a sudden mass extinction of three-quarters of the living plant and animal species living on the Earth, approximately 66 million years ago [2]. It is also called the K-T extinction or more recently the K-Pg (Cretaceous-Paleogene) extinction. Sea turtles and crocodilians survived in the seas together with some smaller fish and molluscs, while most species of land animals perished with the exception of Mammals. The latter then became abundant in the succeeding Cenozoic Era.
The event is marked by a thin layer of sediment called the K-Pg boundary, which can be found throughout the world in marine and terrestrial rocks [46, 47]. The boundary clay shows unusually high levels of the metal iridium, which is more common in asteroids than in the Earth's crust [48]. It is attributed to the 80 km (112 mi) Chicxulub crater in the Gulf of Mexico's Yucatán Peninsula [26]. It was caused by the impact of a massive asteroid 10 to 15 km (6 to 9 mi) wide [25, 26], which devastated the global environment, mainly through a lingering impact winter which halted photosynthesis in plants and plankton.
The fact that the extinctions occurred simultaneously provides strong evidence that they were caused by the asteroid [48]. A 2016 drilling project into the Chicxulub peak ring confirmed that the peak ring comprised granite ejected within minutes from deep in the earth but contained hardly any gypsum. The usual sulfate- containing sea floor rock in the region: the gypsum would have vaporized and dispersed as an aerosol into the atmosphere, causing longer-term effects on the climate and food chain. In October 2019, researchers reported that the event rapidly acidified the oceans, producing ecological collapse and, in this way as well, produced long-lasting effects on the climate, and accordingly contributed to the mass extinction at the end of the Cretaceous. Other causal or contributing factors to the extinction may have been the Deccan Traps and other volcanic eruptions, climate change, and sea level change [49, 50]. However, these do not satisfactorily explain the sudden event although they could have contributed to it.
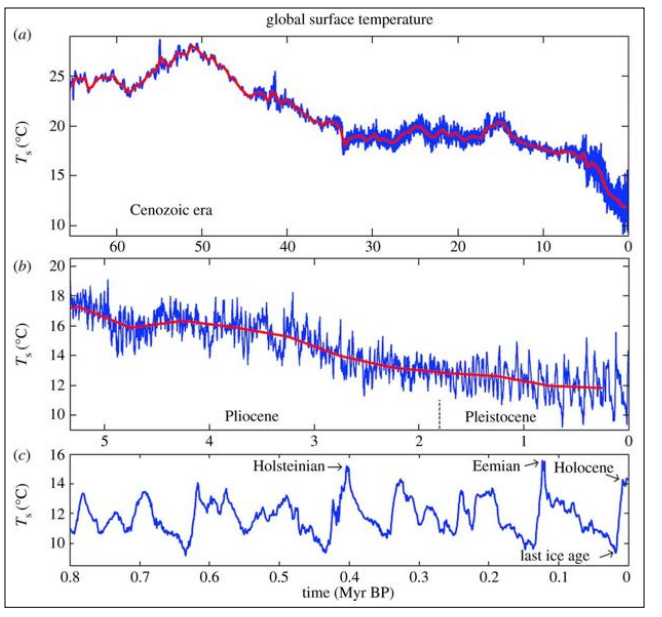
Figure 8: Global surface temperature since the beginning of the Paleogene [51].
The Cenozoic ("new life") era began at 66 Ma B.P. and is subdivided into the Paleogene, Neogene, and Quaternary periods. These three periods are further split into seven subdivisions, with the Paleogene composed of The Paleocene, Eocene, and Oligocene, the Neogene divided into the Miocene, Pliocene, and the Quaternary composed of the Pleistocene, and Holocene [41].
Cenozoic Temperatures and Atmospheric Carbon Dioxde Figure 8 shows the spectacular changes in the mean air temperature during the Cenozoic and to the present day at three different time scales. Initially, there was a spectacular rise in temperature, peaking about 52 Ma B.P. After that there was a gradual drop in temperature followed by an increase in cooling starting about 5 Ma B.P. (the beginning of the Piocene Period). This has caused a succession of changes of the species present available to colonize and adapt to the changing climate. Meanwhile the atmospheric carbon dioxide was dropping from <1000ppm to about 250 ppm except for a minor increase during the Paleocene-Eocene thermal maximum (Figure 7).
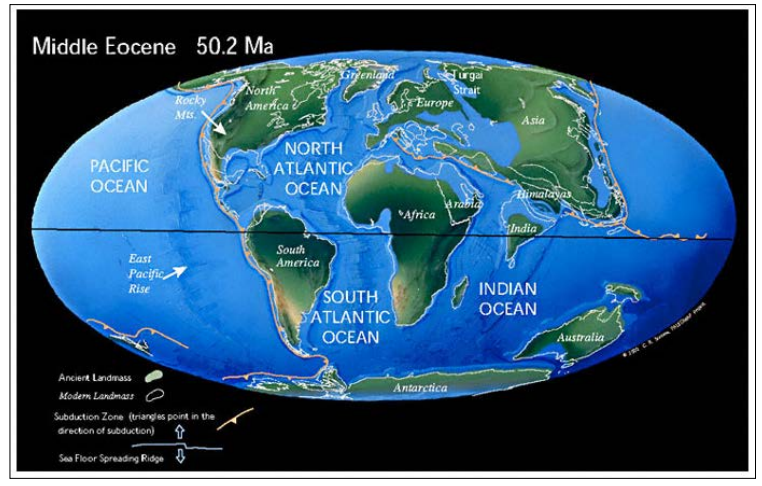
Figure 9: Distribution of continents in middle Eocene times 50.2 Ma (from Paleomap project [52]).
A number of tectonic events during the Cenozoic contributed to persistent and significant planetary cooling since 50 Ma. These include the collision of India with Asia and the formation of the Himalayan range and the Tibetan Plateau as well as the northward movement of the other plates to the west, squeezing and uplifting parts of the Tethyan sediments and building mountain chains such as the Alps. This resulted in a dramatic increase in the rate of weathering and erosion.
The main continents had already formed but sea levels were higher than the present and as a result, gateways through which tropical waters could circulate allowed warm waters to move polewards (Figure 9). Tropical vegetation such as ferns and cycads could flourish in southern Alaska, Australia, and the Antarctic lands covering these areas with forests [51, 53-55]. All this changed after the Paleocene-Eocene thermal maximum as a series of orogenies closed off the circulation of hot water through the gateways of Panama, the Bering Strait and northwards across Russia to the Arctic Ocean. There were also mountains rising in the former eastern part of the Tethys Sea and a series of mountains split this former sea into smaller basins. This caused a steady cooling of the land areas with gradually changing biotas as the species adapted to the considerably colder conditions.
Oxygen isotopes of planktonic and benthic foraminifera in deep- sea cores suggest a significant warming fluctuating around 6-8° C of ocean surface waters at a range of latitudes, as well as of deep waters (Figures 7 and 8). Mean surface temperature of the Earth was 4-5°C warmer than before. The corresponding oxygen isotope shift of -4 to -5 per mil change in carbon isotopes in sediments formed in lakes, rivers, and the sea is used to define the geological extent of the event. The isotope excursion has been identified in sediments deposited in the ocean and those laid down in terrestrial environments such as lakes and rivers [54, 55]. It can be correlated around the world, and it marks the formal definition of the boundary between the Paleocene and Eocene eras. This excursion in terrestrial sediments allows us to correlate the changes that occurred on land during the PETM with those that took place in the ocean. It would correlate with the release of significant quantities of carbon dioxide from the oceans. After the maximum during the Eocene, a marked cooling took place resulting in decreasing atmospheric carbon dioxide as the gas started to return into the seas.
After the Cretaceous-Paleogene extinction, the forests consisted of conifers, ferns and Cycad trees. Birds had appeared about 150 Ma B.P. at the beginning of the Cretaceous Period while Angiosperms evolved about 130 Ma B.P. During the latest Paleocene-early Eocene (about 50–55 million years ago (Ma)), broad-leaved evergreen vegetation extended to latitude 70°–75°, and multitiered evergreen vegetation to 55°–60° [56]. During cool intervals of the Eocene, broad-leaved evergreen forests were restricted to about 50°, with dense coniferous forests polewards. Following the terminal Eocene event, dense coniferous forest occupied areas poleward of 50°–60°, and microthermal broad- leaved deciduous forest (unknown in the Eocene) occupied areas of the northern hemisphere south to 35°. Broad-leaved evergreen forests in both hemispheres were equatorward of 35°, and multilayered evergreen forests equatorward of 20°. In the southern hemisphere, areas between 35° and 50° were occupied by a mixed forest of conifers and broad-leaved evergreens. Grasses first appeared about 34 Ma B.P. During the Neogene, broad-leaved evergreen vegetation slightly expanded (particularly during the mid-Miocene warm interval), as did the coniferous forests at the expense of broad-leaved deciduous forests. Antarctica was deforested by the Miocene, and woodlands replaced forests in southwestern North America and the Mediterranean region during the Miocene. The rising Himalayas produced a steppe vegetation in central Asia during the Miocene while in western North America, steppes developed during the Pliocene. Grasslands in central North America can be no older than late Miocene and may be of younger origin. Taiga is first present in the Arctic region at about 5 Ma north of 65°–70° and has continued to expand. Tundra is first recorded at about 2–3 Ma. Evidence of Tertiary desert is absent.
The small mammals survived the Cretaceous-Paleogene extinction and proliferated in the absence of Dinosaurs. Since the new species were adapted to specific climates and ecological niches, there was a considerable turn-over in species as the environments changed rapidly and the climate cooled. Different species developed on each continent as the land masses moved away from one another although it is thought that North America and Europe remained connected until late Oligocene times. New mountain ranges were the sites for more speciation of plants and animals while populations of plants and animals on isolated islands in the oceans developed varieties and new species [57].
Of particular importance was the Great American Interchange of species between North and South America across the former Panamanian Gateway [58, 59]. The South American continent had remained isolated until about 7.5 ka B.P. when waifs such s baboons washed up on the shore on debris such as driftwood. Subsequently, there was uplift of the Bolivar Trough permitting a wave of animal and plant migration across a narrow land bridge at 2.5 Ma B.P. (Oligocene-Miocene periods.). A similar biotic exchange is postulated for the North Atlantic Ocean to explain the presence of the same species in North America and Europe, While the Bering Strait opened briefly twice during the Cenozoic only to close up quickly [60].
During the Oligocene Period, ice started to form on polar mountains replacing the forests that were there earlier. The Australian and South American continents were moving north away from Antarctica and this opened up the Drake Passage (40 Ma B.P.). From then on, an unrestricted west-to-east flow of water flowed around Antarctica called the Antarctic Circumpolar Current (Figure 10). The region cooled significantly, and by 35 Ma (Oligocene) glaciers had started forming on mountains in Antarctica, resulting in a continuous cold oceanic current surrounding Antarctica consisting of meltwater from the ice sheet that protects the Antarctic from being warmed directly by other warmer ocean currents from the oceans to the north.
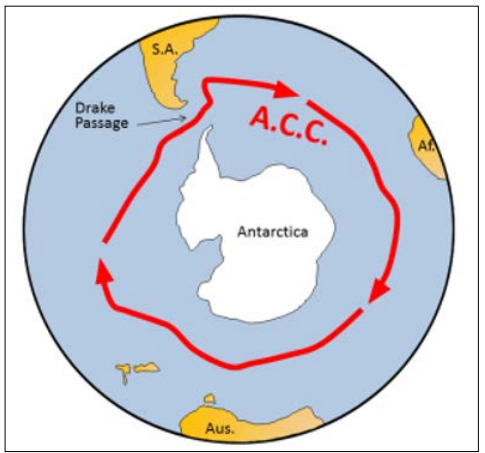
Figure 10: The Antarctic Circumpolar Current
After 46 Ma B.P., the land areas on the islands beneath present- day Antarctica were covered in glaciers which steadily grew until a continuous ice sheet was present c. 35 Ma B.P. (Miocene Period). Global temperatures remained relatively steady during the Oligocene and early Miocene, and the Antarctic glaciation waned during that time. At around 15 Ma, subduction-related volcanism between central and South America interfered with the connection between North and South America, reducing the water flowing east between the Pacific and Atlantic Oceans. This further restricted the transfer of heat from the tropics to the poles, leading to a rejuvenation of the Antarctic glaciation. The expansion of that ice sheet increased Earth’s reflectivity enough to promote a positive feedback loop of further cooling: more reflective glacial ice, more cooling, more ice, etc. By the Pliocene (~5 Ma B.P.), ice sheets had started to grow in the Arctic.
There were two centres outside Antarctica which developed centres of cold. The main one in the northern hemisphere was centred in the triangle between Yakutsk in the south, Oymyakan in the north and in the west. In the southern hemisphere other than Antarctica, glaciers appeared first on the mountains at the southern tip of South America when it was still moving northwards. Harris [61] recognised a Patagonian glaciation at about 3.5 ka B.P. based on reports from Argentina [62-65]. Rabassa [66] reported a glaciation on these mountains at 7.5 ka B.P. with a second at 5.0 ka B.P.
The cold centre in Siberia was growing outwards and the westerly circulation of Arctic air in the northern hemisphere carried the cold air mass eastwards to northwest North America. Hickson & Southern described tuyas dated at 3.5 Ma B.P. from volcanic flows in the Clearwater-Wells Gray area of British Columbia [67]. Using paleomagnetism, demonstrated that the Klondike Gravel, Upper White Channel Gravels, and Midnight Dome Gravel in the Klondike area of the Yukon Territory were significantly older than B.P. 2.58 Ma. This ended with the Colvillian transgression around Alaska coasts [68,69].
Others have reported possible tills of Miocene age from the St. Elias Mountains, but these are currently viewed as being mass wasting deposits [70]. Separation of tills and mass wasting deposits in volcanic areas has proved to be a big problem but glaciations are believed to have commenced at this time in northeastern Iceland [71].
A second glaciation (the Californian glaciation [61]) is based on tills older than 2.58 ka B.P. from California and the west coast of North America as well as in Iceland. It was associated with the Bigbendian Transgression in Alaska dated at 2.6 Ma B.P [69].

Figure 11: (a). Deep ocean temperatures during the last 66 Ma B.P. and (b), Surface water temperatures during the last 66 Ma B.P. based on δ18O (0/00) of Foraminifera [51].
This was based on the age of the first cold water faunas along the coast of Italy [41] and was a period during which atmospheric carbon dioxide amounts were lower than 500 ppm, dropping below 200ppm during the last few glaciations. It also corresponds with the occurrence of the Fish Creekian Transgression (2.14-2.48 Ma B.P.) in Alaska. The global temperature was cooling and the variability of the cycles of air and water temperature increased with time (Figures 11, 12 and 13). The cyclical air temperature was steadily dropping until about 1950 A.D. but was characterized by periodic cold events alternating with warmer interglacials. The cold events became more frequent with the overall cooling. The details of actual glaciations around most of the world during the last 2.58 Ma B.P. will be found in [73]. They vary considerably from place to place due to the factors listed in Table 1 (from [70]).
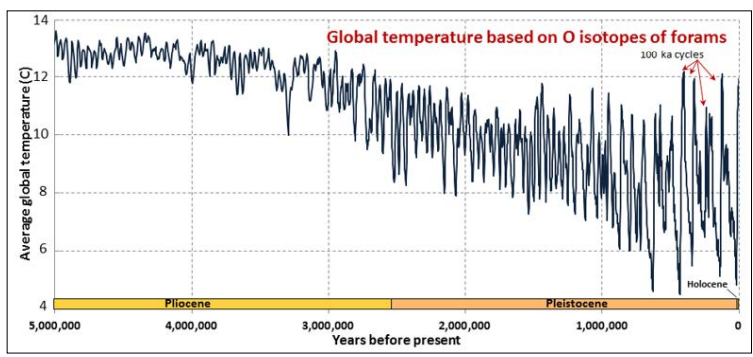
Figure 12: Variation in amplitude of the fluctuations in water temperature based on δO18 isotope temperatures in foraminifera in sediment cores (data from [72]).
|
Order |
Potential change in |
Causative agents |
|
1st |
20–30°C |
Difference in heat absorption by sea and land as Plate Tectonics. Changes in surface ocean currents and thermohaline circulations. Changes in ocean gateways. |
|
2nd |
20-25°C |
Eustatic sae level changes. Movement of air masses. |
|
3rd |
>10°C |
Milankovitch Cycles |
|
4th |
<5°C |
Fluctuations in CO2 and greenhouse gases. Cosmic rays and (cycle. Large-scale volcanic eruptions. Elevation of large tracts of land, e.g., Tibetan Plateau. Oscillatory ocean currents, e.g., El Niño and La Niña. Other short-term cycles, e.g., 2 and 7 years. |
Over the past million years, the glaciation cycles have been approximately 100,000 years. There have also been major changes in the pattern of glaciation at times of change in polarity of the Earth’s magnetism [74]. In the case of the last one (Brunhes- Matuyama, Figure 13), the entire western Cordillera from northern Mexico to the Arctic coast was tilted towards the north and a major range of mountains that had caused the drainage from interior Canada to drain through the Hudson Bay sank to produce the Arctic Islands. This resulted in a rearrangement of the drainage so that the northwest drainage in Canada started to flow through to the Arctic along the Mackenzie River to Inuvik. This also caused rearrangement of the northeast flowing rivers such as the Yellowstone and Missouri that abruptly turn east to join the Mississippi River as moraines blocked their path northwards. In the southern parts of the Cordillera, it resulted in erosion of the canyon of the Colorado River as well as the Copper Canyon in northern New Mexico [75-78].
The last eight glaciation have occurred at 100 ka intervals believed to match the shape of the Earth’s orbit (eccentricity, a 100,000-year cycle), and controlled by four cycles of changes in direction the Earth’s axis of rotation is pointing (precession, in a 23,000 year cycle of the Milankovitch cycles. [79-81]. The data for the average large numbers of measurements of temperature (δO18 from foraminifera) and global average of carbon dioxide are shown in Figure 14. The close relationship of temperature and carbon dioxide content of air is clearly displayed.
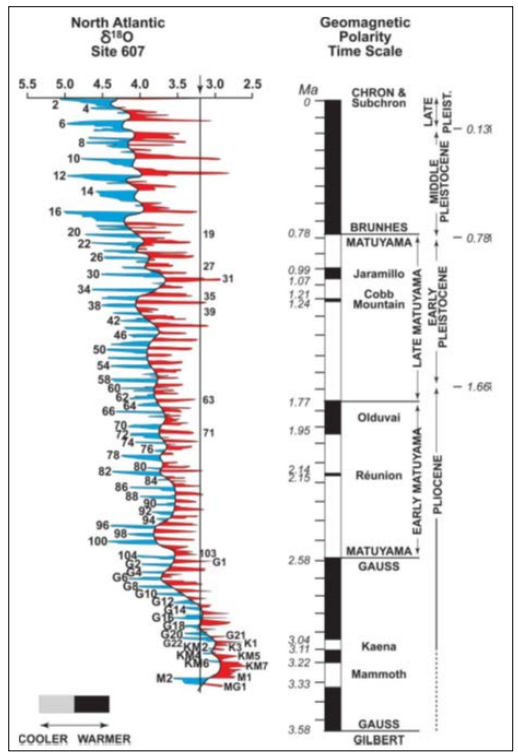
Figure 13: Oxygen isotope palaeotemperature record [76; 77] and geomagnetic polarity timescale [77]. Black and white areas are normal and reversed polarity respectively. The arrow at the top indicates the mean Holocene oxygen isotope value. Numbers on the peaks and troughs are the isotope stages (modified from [78]).

Figure 14: Relationship of carbon dioxide content of air in glacial ice (ppm)and air temperature based on δO18 content in ice for Antarctica (above) and the global average below [79-82].
Have demonstrated that at least three of the Pleistocene glaciations occurred in Patagonia [83]. In the case of the last eight North American glaciations, the atmospheric carbon dioxide decreased during the cold events indicating that carbon dioxide was dissolving into the sea water (Figure 14, [82]). It recovered to varying levels during the next warm event but the level at the cold maximum was perilously close to there being too little atmospheric carbon dioxide to sustain photosynthesis in green plants. “It is clear that the influence of low [CO2] transcends several scales, ranging from physiological effects on individual plants to changes in ecosystem functioning, and may have even influenced the development of early human cultures (via the timing of agriculture)” [84]. Figure 7 shows the decline in atmospheric carbon dioxide between the early Cambrian period until the present with the major decline occurring during the Carboniferous Period when the Karoo Glaciation was occurring in Africa.
If there was no interference in the climate by Humans, the cooling phase of the next precession phase of the tilt of the Earth should have begun a cooling cycle in about 1944 A.D.. This has not happened and instead, the climatic changes and weather have become much more extreme with many parts of the world becoming warmer. However, this is not occurring every where, e.g., the Sahel zone in west Africa undergoes alternating warm dry periods with cooler wet weather with a periodicity yet to be determined [85].
The probable causes are modification of the climate patterns by human activities including urbanization, an exponential growth in numbers of humans, clearing of native vegetation for buildings, farming, and industry including mining and oil and gas production, the cutting down/burning of large areas of the remaining forests; transport of goods by road, rail and by large container ships that are powered by oil or diesel, etc. There is an important concept used in farming called carrying capacity. Human numbers now far exceed the carrying capacity of the Earth with its limited resources, and there have been no similar planets that we could move to when the resources on this plant are exhausted.
Unless we adapt to the limitations of our environment, the human race will find itself in severe difficulties in the not-too-distant future.
This is best dealt with in order starting with the fluctuations in climate and commenting on its consequences.
It started out as a flaming disc of matter moving in an orbit around the sun and slowly differentiated itself into a dense core surrounded by dark coloured rock called sima. The lighter rocks floated to the surface to form a layer called sima. Gases were emitted from the disc as it coalesced into a sphere while flammable and light gases such as hydrogen and helium floated away into space. Water vapour was held in in the colder upper atmosphere and gradually formed lakes and oceans as the Earth cooled. It caused weathering and mass wasting of the unstable minerals in the volcanic rocks carrying rock fragments and chemical by products of weathering downslope to the water bodies where they accumulated. The rock fragments that were stable gradually piled up to form land areas while the waters gradually inundated the rest of the surface above water level. No oxygen or carbon dioxide appears to have been emitted but nitrogen was probably accumulating. Sulphur dioxide and hydrogen sulphide gases reacted with a variety of metals to produce the sulphate and sulphide ores that occur in the older rocks.
As the sulphur gases were used up, first oxygen and then methane were formed by single celled organisms and these reacted to produce carbon dioxide. This then allowed photosynthesis to develop producing considerable amounts of oxygen that could provide the ozone shield to protect life from cosmic rays and it oxidised the iron weathering products to form in iron ores. Meanwhile the size of the land areas was growing, partly by volcanic action along its shores. Multicellular plants evolved and added to the structures using photosynthesis to reduce the carbon dioxide in the atmosphere.
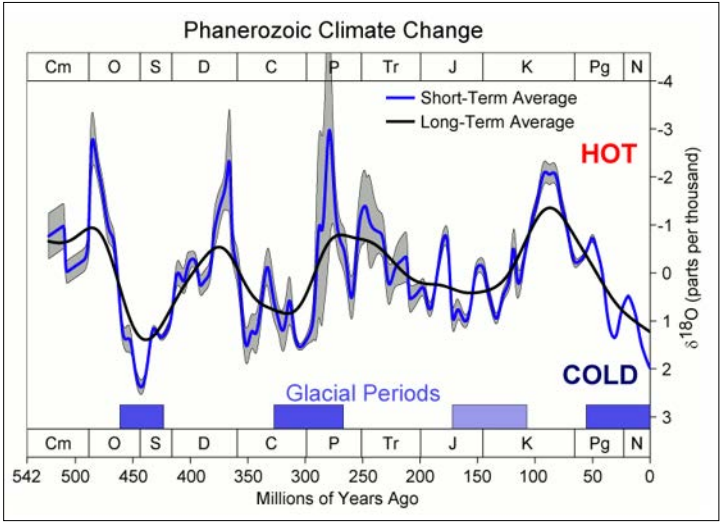
Figure 15: Main Glacial periods during the last 542 Ma consisting of the Andean-Saharan, Karoo, Jurassic-Cretaceous, and the Cenozoic events (from https://www.canada.ca/nature/ naturesolutions).
Once the surface of the Earth had cooled, periodic glaciations occurred. Four Ga B.P., the incoming solar radiation was less than today, and a series of glaciations took place at irregular intervals beginning in the Archean Eon (Figure 3). During the Phanerozoic Eon, four major glaciations occurred up to the present. Each one lasted millions of years, e.g., the longest one, the Karoo lasted 60 Ma (Figure 15). Each one consisted of a series of alternating long cold events (c.85 ka during the recent cold events) separated by shorter (15ka) warm interglacials during which, sea level rose due to melting of the previous ice sheets.
Since the land areas were initially much smaller than today, the glaciations were not world-wide and could occur in a polar region while tropical climates existed in other parts of the land areas. This happened during the Karoo glaciation in Africa which coexisted with the tropical forests of the Carboniferous Period in what is now Europe and Eastern United States. This may explain the illusion of “Snowball Earth” of many authors if the land areas were near one of the poles of rotation and there were no land masses near the Equator. The contemporary deep-sea sediments would show a lack of C13 which is what has been reported by University of Toronto scientists.
It is obvious from Figure 14 that atmospheric carbon dioxide changed in quantity in parallel to the changes in air temperature during the last 800 ka B.P. This also occurred during all the earlier fluctuations earlier in the Earth’s history although it did not always return to the same level. What is happening is that the solubility of carbon dioxide in water increases with decreasing temperature while the opposite occurs during warming resulting in degassing of the excess gas from the water back into the atmosphere [66]. claimed that carbon dioxide degassing preceded warming at many of the stations around the world, but they were using surface water temperature compared with the total carbon dioxide being degassed from the entire column of sea water at each site. Accordingly, they obtained inflated values for degassing which include the quantity of carbon dioxide being released from the entire water column.
Comparing the heights of the peaks for each of the last eight glacial cycles in Figure 14, in most cases the height of the peak atmospheric carbon dioxide in adjacent cycles is similar, indicating negligible loss of the gas while dissolved in the oceans. However, in Figure 7, the atmospheric carbon dioxide dropped from over 4000 ppm before the Karoo glaciation down to only c.350 ppm during the main event, only recovering to c.2000 ppm in the latter part of the Permian Period. While the use of atmospheric carbon dioxide for photosynthesis by vegetation would account for part of the loss, it is at least double that used for that purpose in the preceding Periods. This raises the question as to what happened to the rest of the dissolved gas. The most likely answer is that there were large quantities of calcium ions that had resulted from weathering of mafic rocks It has been accumulated in the seas waiting to react with the dissolved carbon dioxide and oxygen to produce copious amounts of carbonate mud in the adjacent long shallow seas and geosynclines. The Karoo Glaciation was the longest of the four main glaciations during Eons. Many marine species of animals were not affected by the mud which formed the extensive massive limestone and dolomite rocks with large coral masses that characteristic of the many of the rocks formed during the Carboniferous Period in what is now Europe and North America noted that these could not be satisfactorily explained by existing theories, e.g., the hydrodynamic controls described from the Great Bahama Bank [87, 88].
A similar reaction between carbon dioxide and calcium ions probably occurred earlier during the Cryogenian Glaciation. Between them, the available calcium ions in the oceans would have been severely depleted, which may explain why the Triassic-Cretaceous Glaciation did not produce a similar drop in atmospheric carbon dioxide, although it took place just as the gas started its downward trend towards the present low concentrations. The Cretaceous Chalk deposits of western Europe are composed of compacted tiny fossils and are not formed by this process [89].
The low concentrations in atmospheric carbon dioxide have caused some scientists to speculate about the future of life on Earth [84,90]. The oceans cover 70% of the surface of the Earth and will act as a buffer reducing the risk of a sudden collapse of the Biota on Earth. Instead, the more vulnerable species in the trophic pyramid would be those at the top. The biota in the oceans would probably be the last to disappear and the spores and reproductive organs of many viruses can survive for hundreds of years in the ground, whether it is frozen or hot. Even so, if there was no oxygen nor carbon dioxide, the land areas would be likely to become as barren as on the other planets.
The critical group of the biota are the plants who produce sugars, oxygen, etc. Animal species then consume the plants.
If anything exterminates the plants, the system would be in a state of collapse. Plants need nutrients, water, carbon dioxide, and sunlight to function. There are many laboratory experiments that have been carried out on the effects of limiting one or more of these requirements to determine the minimum conditions for their survival, but all these factors are in play on the surface of the Earth. If two or more factors are inadequate, the threshold for death of a plant rises.
Cannabis requirements of atmospheric carbon dioxide have been studied in detail. Stomata function much like pores in the skin but have guard cells that can open and close. They regulate the absorption of water, gas, oxygen, and carbon dioxide into the plant, as well as the evacuation of water and oxygen. Photosynthesis in Cannabis increases as the amount of carbon dioxide in the air increases, as long as there is enough light to power it (to an upper limit) but slows to a crawl and virtually stops at carbon dioxide concentrations of around 200 ppm. With less carbon dioxide, this species continues respiration and growth for a short time, until all their sugars are used up and then they slow down their metabolism to conserve energy. Below the threshold of c. 100 ppm, the plants start to wither as they use up their reserves of sugars before dying.
These critical concentrations vary from one species to another under otherwise ideal conditions, but in general, a lower limit of 100-250 ppm seems to be normal. However, in the real world, both temperature and moisture supply vary considerably depending on the climatic regime and where there are frequent adverse conditions involving other requirements for life, the limits for survival will be considerably higher. A good example of this is found in the survival of the Hominoids in Africa. They did not adapt to droughts and hot weather in the Sahel by moving to places with a more suitable climate and therefore did not last long. Homo sapiens tended to explore other places and environments and clearly moved into more hospitable areas, hence avoiding elimination in subsequent droughts. This is how he adapted to the climatic changes during and after the last glacial maximum.
There have been numerous studies of the effects of elevated concentrations of carbon dioxide in the air on students in classrooms and buildings. The levels of CO2 in the air and potential health problems [91, 92] are:
427 ppm: average outdoor air level.
4004–1,000 ppm: typical level found in occupied spaces with good air exchange.
1001–2000 ppm: level associated with complaints of drowsiness and poor air.
2000 –5000 ppm: level associated with headaches, sleepiness, and stagnant, stale, stuffy air. Poor concentration, loss of attention, increased heart rate and slight nausea may also be present.
In practice, carbon dioxide levels commonly reach 3000 ppm in classrooms and offices and can reach 8000 ppm under the helmet and face shield of motor cyclists. Minnesota Department of Health suggests <10,000 ppm for 8 hour sifts and <30,000 ppm for <15 minutes exposure. Health Canada proposed <1000ppm in classrooms [93,94].
The levels of atmospheric carbon dioxide proposed by the IPCC and recent climate meetings will be difficult to b realized. Unfortunately, they also would set up the world for a loss of life on Earth as we know it next time there is a major cold event [95]. The present rate of increase in atmospheric carbon dioxide is very slow and scarcely a reason for hysteria, although when compared to the levels during the beginning of the Industrial Revolution, they appear to be a problem. Considering the tremendous expenditure by Governments to reduce it or store it underground, it seems paradoxical that they are also spending considerable sums of money on conservation of species. Given the past history of the Earth’s climate, it is only a matter of time before e have to cope with another major cold event. In the meantime, some countries are happy to decimate forests such as the British firms in British Columbia north of Quesnel to generate electricity in Britain, leaving behind a destroyed forest. No replanting is being done and the destruction of the forest is expected to be complete in five years! Is this what we really want to leave for our children and their progeny?
When the disc of swirling matter and dust started to form the Earth 4.543 Ga B.P., it proceeded to compact into distinct layers with a nickel iron core surrounded by a less dense mantle and an outer skin of Sima with lighter rock floating to the surface called Sial. It was very hot and burning off hydrogen and helium like the sun. Before the crust solidified, a passing asteroid at 4.527 Ga B.P. sucked much of the Sial away to form the moon. The period >4.0 Ga is called the Hadean Eon because it resembles the conditions on the sun. The latter was only producing 75% of its present-day irradiance at this time.
Once the crust had cooled sufficiently, water vapour began to be cycled as precipitation starting weathering and erosion of the rocky surface carrying the products down slope into the accumulating water bodies. These soon took over the surface of the Earth leaving small bodies of Sial and Sima as the first land areas. The gasses coming from volcanoes included large quantities of sulphur dioxide and hydrogen sulphide which reacted with many metals to produce the sulphide and sulphate ores found today particularly within the Precambrian rocks. There were negligible signs of oxygen and carbon dioxide coming from the volcanoes, but nitrogen was present among the gasses.
By 3.8 Ga B.P., methane and oxygen had appeared in the atmosphere on the Kola Peninsula and were producing Aragonite (calcium carbonate). By 3.5 Ga B.P., ironstone bands were forming in some parts of the world indicating the waning quantities of sulphur gases from volcanoes. At first, they consisted of Fe3O4 but changed to Fe2O3 as more oxygen became available. Oxygen provided ozone to the Troposphere that began to shield the surface of the Earth and life forms on it from cosmic and ultraviolet rays. By 1.9 Ga B.P. formation of ironstone had ceased. There were five glaciations before the Ediacaran Glaciation (0.6 Ma B.P.) affected the two small land masses near the South Pole of rotation. Also, at this time, there was a change in the position of the magnetic Poles to the present positions. Until then, life forms were single celled though multicellular forms of plants had evolved. Immediately after this glaciation in the Cambrian Period, a remarkable array of multicelled animals appeared in the Oceans. This was soon followed by vegetation including tree Ferns and Cycads. These were followed by animals appearing on land, and atmospheric carbon dioxide built up to c. 7000 ppm only to decrease to c.4200 during the late Ordovician cold event. The latter caused a substantial change in marine faunas and deposition of calcareous muds.
The atmospheric recovered to a limited extent before the major long cold period of the Karoo Glaciation in Africa when it was at the South Pole. The atmospheric carbon dioxide dropped below 1000 ppm during this cold period and resulted in thick calcareous mud deposits in the Seas and a second extinction of life by the Early Triassic Period. The atmospheric carbon dioxide levels rose to over 2000 ppm by the end of the Jurassic Period and then started a decline towards the present levels Air temperatures rose a little until the Late Cretaceous Period when an asteroid hit the Earth. The climate had become drier and less hospitable and a significant loss in species including the last Dinosaurs took place. Mammals that had been small up to then were able to proliferate and grow bigger and cooling began. This resulted in changing biotas as the climate became colder. Around 40 Ma, ice sheets appeared in Antarctica and the first glaciers elsewhere appeared in Patagonia and possibly south Alaska. By 3.5 Ma, the first glaciers affected the Western Cordillera of North America, followed by period but steadily more frequent glaciations in North America and Asia, finally affecting Northern Europe about 1.8 Ma B.P.
The atmospheric carbon dioxide had been steadily dropping. During the last eight cold events space in a 100-year cycle controlled by the Milankovitch Cycles, the loss of atmospheric carbon dioxide to solution in the cold sea water has alarmed many scientists who realized that the amount left was very close to preventing the photosynthesis producing sugars in plants. While there is currently increasing carbon dioxide production boosted by the activities of Humans, it is a slow process and we are overdue for a cold event. If the latter occurs, the level of carbon dioxide could well fall below the critical limits needed by plants to survive due to the higher solubility of carbon dioxide in colder waters. This could easily happen and would probably end the period of life on this planet at least as we know it.
This raises questions about the current Government policies around the world such as carbon taxes, decreasing the carbon dioxide footprint, putting the carbon dioxide under ground, avoiding the use of natural gas and oil, etc. Large sums of money are being used for this purpose without considering possible consequences for our future as a species. Perhaps it is a reason why we cannot find any other heavenly bodies with life as we know it. Is it really worth putting so much money into the Space Program when we face this other problem?