Author(s): Chukwu C Ben*, Ngeri A Paddy and Udota S Benjamin
This study is aimed at evaluating the influence of lithology on seismic wave velocity in part of Niger Delta. A suite of geophysical well log comprising of gamma ray, sonic and density logs in Log Ascii Standard (LAS) format from two exploratory wells (OKO 5 and OKO 7) within the study area was used for this study. Gamma ray log was used to identity and delineate the lithology into shale and sand units, seismic wave velocity was categorized into compressional wave velocity Vp and shear wave velocity Vs. The former was computed from interval transit time while the later from compressional wave velocity. The results of this study show that seismic wave velocity is very much affected by difference in the lithology of formation. Compressional wave velocity (Vp) is higher than shear wave velocity (Vs) in shale and sand lithologies in the two wells. The values of the compressional wave velocity, shear wave velocity, percentage volume of shale and percentage volume of sand ranges from 3485 to 6620m/s, 2159 to 3932m/s, 2682 to 5323m/s, 1736 to 3161m/s, 11 to 60%, 13 to 59%, 40 to 89% and 29 to 87% for the two wells respectively. The knowledge of this study can be applied in civil engineering and engineering geophysics activities like foundation for high rise buildings, dams, bridges and road construction.
Lithology is simply defined as the study of the composition and general physical characteristics or properties of a rock unit which gives distinct geologic features to such unit and distinguishes it from other rock units based on the mineralogical composition, grain size, grain shape, texture etc. The lithostratigraphic units of sedimentary rocks are the easiest to identify and distinguish due to the homogeneity of the lithological characteristics of the different layers of the rock units, classified rocks based on the lithologic chemical composition such as; quartz, feldspar, mica, dolomite etc. Other rocks are lithologically classified based on their texture. There are some other rocks classified according to the shape of the formation particles such as conglomerates and breccia, whereas some other rocks are also classified based on the particle sizes, mode of deposition and mineralogy [1-3].
Velocity is one of the primary (basic or major) petrophysical parameters used in hydrocarbon exploration and other geophysical surveys to easily determine and predict horizons, faults, facies, interfaces (strtigraphic boundaries), unconformities, geologic structures etc. The knowledge of velocity at any given depth is very important in the recognition of reflectors and refractors with dip or plane horizontal beds. In geophysical point of view, velocity is defined as the ratio of the displacement of a seismic wave or signal to the time it takes the wave or signal to travel the space between energy source and receiver. The optimization of a petroleum or gas field operations has proven successful for the effective imaging of the subsurface geology by characterizing the propagation of seismic or acoustic waves which travel through the rocks [4,5].
Reflection seismology also referred to as seismic reflection is the most widely used and well-known geophysical technique. It has been the most successful seismic method for identifying subsurface geologic conditions favourable to the accumulation of oil and gas. In reflection seismology surveys, seismic energy pulses are reflected from subsurface interfaces and recorded at near-normal incidence at the surface [6]. The depth of different geologic boundaries can be determined using the required time for the seismic wave to return to the surface and the velocity of travel. The velocity value of the wave carries information on the type of sediments or rocks. Reflection surveys are most commonly carried out in areas of shallowing dipping sedimentary sequences. In such areas velocity varies as a function of depth, due to the differing physical properties of the subsurface materials or rocks present in the individual layers [6]. As seismic waves encounter a medium with different elastic properties and density, compressional and shear waves are generated. Acoustic (seismic or sound wave) velocity is a geophysical parameter which measures the rate of change of displacement as sound wave propagates through the subsurface materials or rocks or from the source to the receiver [2]. The variation of seismic velocity with depth can be attributed to the variation in the properties of earth materials or rocks in the subsurface [7,8].
This research is carried out within the Niger Delta, Southern part of Nigeria in West Africa. The Niger Delta is situated along the Southern part of Nigeria on the Gulf of Guinea on the west coast of Africa. It lies within latitudes 4o-6oN and longitude 4 o -9o E. The Delta covers an area of about 259,000 sq km as shown in Figure 1 [9].

Figure 1: Map Showing Location of the Study Area [9]
The study area comprised of three major structural geologic formations, namely Akata, Agbada and Benin formations that indicate how the basin was formed as shown in Figure 2.
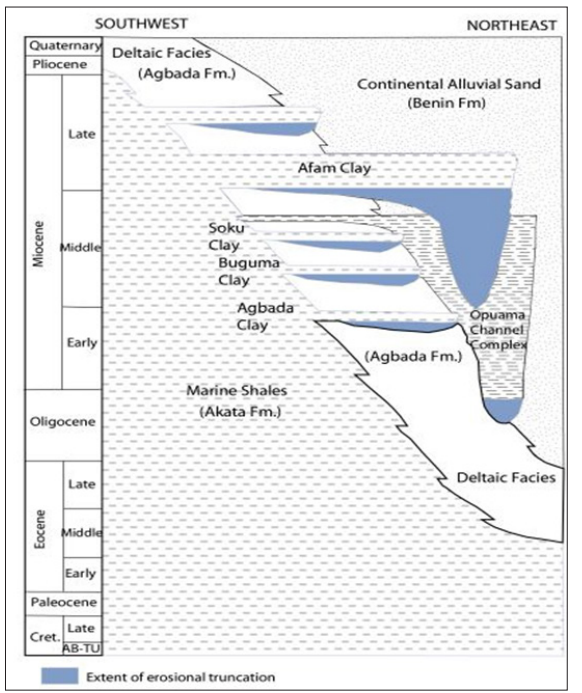
Figure 2: Stratigraphy of the Study Area [10]
Akata Formation underlies the entire delta and originates from marine deposits. It is made up of minute amount of silt and clay and contains shale successions, which serves as potential source rock. Akata Formation started from Paleocene to recent, and was formed during lowstands, this condition permitted the deposition of clays and organic matter in deep waters estimated the formation to be about 21,000 feet thick and it is usually over pressured [10].
Agbada Formation is of fluvio-marine origin and it overlies the Akata Formation. Its thickness is about 3,700m consisting of intercalations of sand and shale. Its Sandstones and sands house the produced hydrocarbon. According to these hydrocarbons are entrapped by rollover anticlines associated to growth fault [11].
Benin Formation is the uppermost part of the unit. It overlies Agbada Formation and consists of mainly sands and gravels, which bear fresh water stated that Benin Formation consist of alluvial sands with thickness of about 200m deposited in early Eocene to recent [12].
A suite of geophysical well log (comprising gamma ray, sonic and density logs) in Log Ascii Standard (LAS) format, petrel software and microsoft excel spreadsheet are the materials used for this study.
To achieve the aim of this study, well log data set from two exploratory wells (OKO 5 and OKO 7) within the study area were used to evaluate the parameters of interest at 10m depth interval. The flowchart of the method used in this study is shown in Figure 3 and explained in the following subheadings (sub-sections).
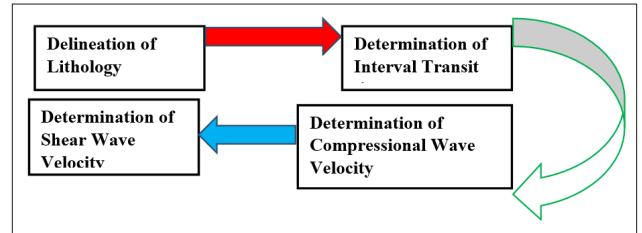
Figure 3: Flowchart of the method used
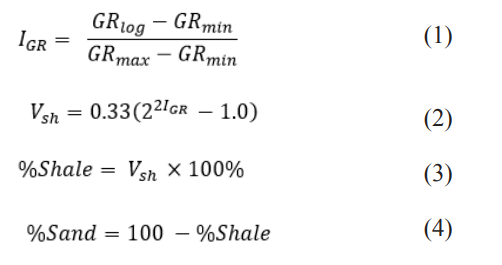
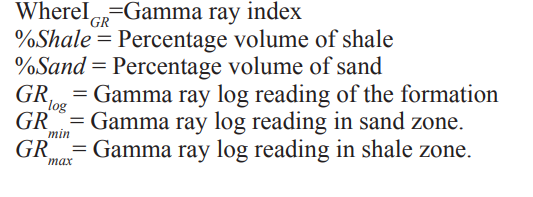
Gamma ray log was used to delineate the lithology into two litho-facies which are sand and shale units or strata, compute the percentage of shale and sand by volume using equations 1 to 4 according to [13]. Gamma ray log values range from 0.00 to 150.0 API, as the reading increases towards the higher values shale units are delineated whereas as the reading decreases towards the lower values sand units are delineated.
Interval transit time is the time sound (seismic or acoustic) waves take to travel a certain distance in the formation [14]. It is represented as the reciprocal of the velocity of travel of travel of seismic wave and was computed from sonic log using equation 5.
Where ?t = Interval transit time in µs/ft read directly from the log Vp = Compressional wave velocity of travel of seismic wave in m/s
Compressional wave velocity, Vp in meter per second (m/s) was computed using equation 6 obtained from equation 5.

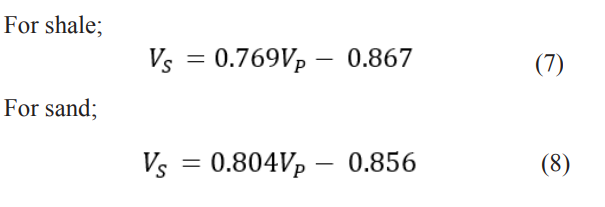
Shear wave velocity (Vs) was computed from compressional wave velocity (Vp) using empirical equations which relates shear wave velocity, Vs and compressional wave velocity Vp for shale and sand beds [15].
The numerical values obtained from the digitization of the well log from the two wells and computation of the various parameters required for this study are presented in Tables 1 and 2 which show the selected depth values in metre(m), gamma ray log values in American Petroleum Institution (API) unit, interval transit time in micro seconds per feet (µs/ft), percentage volume of shale (% shale), percentage volume of sand (% sand), compressional wave velocity (Vp) in meter per second (m/s) and shear wave velocity, Vs in meter per second (m/s) for the two wells.
Figures 4 to 15 shows the cross plots of compressional wave velocity (Vp) versus percentage volume of shale (%shale), compressional wave velocity (Vp) versus percentage volume of sand (%sand), shear wave velocity (Vs) versus percentage volume of shale (%shale), shear wave velocity (Vs) versus percentage volume of sand (%sand), depth versus compressional wave velocity (Vp) and depth versus shear wave velocity (Vs) for the two wells.
|
S/N |
Depth (m) |
?t (µs/ft) |
GR (API) |
%Shale |
%Sand |
V p (m/s) |
V s (m/s) |
|
1 |
1216 |
60.23 |
48 |
32 |
68 |
5062 |
4070 |
|
2 |
1226 |
76.40 |
22 |
14 |
86 |
3991 |
3208 |
|
3 |
1235 |
75.08 |
22 |
14 |
86 |
4061 |
3264 |
|
4 |
1244 |
77.47 |
23 |
14 |
86 |
3936 |
3164 |
|
5 |
1253 |
66.07 |
26 |
17 |
83 |
4614 |
3710 |
|
6 |
1262 |
75.54 |
73 |
48 |
52 |
4036 |
3245 |
|
7 |
1271 |
81.24 |
26 |
17 |
83 |
3753 |
3017 |
|
8 |
1280 |
77.22 |
55 |
36 |
64 |
3948 |
3174 |
|
9 |
1290 |
77.18 |
26 |
17 |
83 |
3950 |
3176 |
|
10 |
1299 |
76.97 |
29 |
19 |
81 |
3961 |
3184 |
|
11 |
1308 |
76.21 |
29 |
19 |
81 |
4001 |
3216 |
|
12 |
1317 |
77.38 |
26 |
16 |
84 |
3940 |
3168 |
|
13 |
1326 |
67.79 |
70 |
46 |
54 |
4498 |
3616 |
|
14 |
1335 |
87.47 |
77 |
51 |
49 |
3485 |
2682 |
|
15 |
1345 |
78.18 |
24 |
15 |
85 |
3900 |
3135 |
|
16 |
1354 |
78.81 |
24 |
15 |
85 |
3868 |
3110 |
|
17 |
1363 |
78.22 |
33 |
21 |
79 |
3898 |
3133 |
|
18 |
1372 |
75.03 |
21 |
13 |
87 |
4063 |
3267 |
|
19 |
1381 |
72.51 |
21 |
13 |
87 |
4205 |
3380 |
|
20 |
1390 |
75.54 |
22 |
14 |
86 |
4036 |
3245 |
|
21 |
1399 |
74.90 |
19 |
12 |
88 |
4071 |
3273 |
|
22 |
1409 |
73.14 |
21 |
14 |
86 |
4168 |
3351 |
|
23 |
1418 |
74.09 |
23 |
15 |
85 |
4115 |
3308 |
|
24 |
1427 |
76.21 |
28 |
18 |
82 |
4000 |
3216 |
|
25 |
1436 |
69.75 |
43 |
28 |
72 |
4371 |
3514 |
|
26 |
1445 |
74.09 |
23 |
15 |
85 |
4115 |
3308 |
|
27 |
1454 |
69.36 |
20 |
13 |
87 |
4396 |
3534 |
|
28 |
1463 |
71.33 |
22 |
14 |
86 |
4274 |
3436 |
|
29 |
1473 |
71.33 |
21 |
13 |
87 |
4274 |
3436 |
|
30 |
1482 |
77.89 |
29 |
19 |
81 |
3914 |
3147 |
|
31 |
1491 |
69.52 |
17 |
11 |
89 |
4386 |
3526 |
|
32 |
1500 |
69.75 |
21 |
13 |
87 |
4371 |
3514 |
|
33 |
1509 |
71.49 |
31 |
20 |
80 |
4265 |
3429 |
|
34 |
1518 |
76.45 |
29 |
19 |
81 |
3988 |
3206 |
|
35 |
1527 |
72.12 |
21 |
14 |
86 |
4227 |
3399 |
|
36 |
1537 |
70.70 |
24 |
15 |
85 |
4312 |
3467 |
|
37 |
1546 |
66-37 |
19 |
12 |
88 |
4594 |
3693 |
|
38 |
1555 |
69.28 |
18 |
11 |
89 |
4400 |
3538 |
|
39 |
1564 |
68.66 |
32 |
21 |
79 |
4440 |
3570 |
|
40 |
1573 |
72.93 |
26 |
17 |
83 |
4180 |
3361 |
|
41 |
1582 |
68.77 |
33 |
21 |
79 |
4433 |
3564 |
|
42 |
1591 |
70.40 |
27 |
17 |
83 |
4331 |
3482 |
|
43 |
1601 |
65.76 |
26 |
17 |
83 |
4636 |
3728 |
|
44 |
1610 |
71.79 |
28 |
18 |
82 |
4247 |
3414 |
|
45 |
1619 |
67.24 |
24 |
16 |
84 |
4534 |
3645 |
|
46 |
1628 |
71.03 |
71 |
47 |
53 |
4292 |
3451 |
|
47 |
1637 |
72.62 |
36 |
23 |
77 |
4198 |
3375 |
|
48 |
1646 |
67.96 |
21 |
14 |
86 |
4486 |
3606 |
|
49 |
1655 |
69.49 |
24 |
16 |
84 |
4387 |
3527 |
|
50 |
1665 |
68.19 |
20 |
13 |
87 |
4471 |
3595 |
|
S/N |
Depth (m) |
?t(µs/ft) |
GR (API) |
%Shale |
%Sand |
V p (m/s) |
V s (m/s) |
|
1 |
1372 |
141.18 |
27 |
17 |
83 |
2159 |
1736 |
|
2 |
1381 |
136.72 |
27 |
18 |
82 |
2230 |
1792 |
|
3 |
1390 |
130.36 |
83 |
55 |
45 |
2339 |
1799 |
|
4 |
1399 |
123.71 |
26 |
17 |
83 |
2464 |
1981 |
|
5 |
1409 |
124.37 |
25 |
16 |
84 |
2451 |
1970 |
|
6 |
1418 |
119.11 |
40 |
26 |
74 |
2560 |
2057 |
|
7 |
1427 |
118.53 |
26 |
17 |
83 |
2572 |
2068 |
|
8 |
1436 |
122.55 |
26 |
17 |
83 |
2488 |
2000 |
|
9 |
1445 |
114.98 |
25 |
16 |
84 |
2652 |
2131 |
|
10 |
1454 |
128.72 |
35 |
23 |
77 |
2369 |
1904 |
|
11 |
1463 |
120.35 |
30 |
20 |
80 |
2533 |
2036 |
|
12 |
1473 |
117.92 |
24 |
16 |
84 |
2585 |
2078 |
|
13 |
1482 |
120.44 |
23 |
15 |
85 |
2531 |
2035 |
|
14 |
1491 |
120.48 |
24 |
16 |
84 |
2531 |
2034 |
|
15 |
1500 |
120.28 |
30 |
20 |
80 |
2535 |
2037 |
|
16 |
1509 |
125.30 |
25 |
16 |
84 |
2433 |
1956 |
|
17 |
1518 |
119.84 |
20 |
13 |
87 |
2544 |
2045 |
|
18 |
1527 |
118.82 |
24 |
15 |
85 |
2566 |
2063 |
|
19 |
1537 |
107.42 |
28 |
18 |
82 |
2838 |
2282 |
|
20 |
1546 |
117.24 |
24 |
15 |
85 |
2600 |
2090 |
|
21 |
1555 |
117.10 |
26 |
17 |
83 |
2604 |
2093 |
|
22 |
1564 |
109.90 |
30 |
19 |
81 |
2774 |
2230 |
|
23 |
1573 |
111.92 |
23 |
15 |
85 |
2724 |
2190 |
|
24 |
1582 |
123.67 |
75 |
50 |
50 |
2465 |
1982 |
|
25 |
1591 |
116.68 |
62 |
41 |
59 |
2613 |
2100 |
|
26 |
1601 |
112.17 |
33 |
21 |
79 |
2718 |
2185 |
|
27 |
1610 |
118.22 |
34 |
22 |
78 |
2579 |
2073 |
|
28 |
1619 |
94.35 |
21 |
13 |
87 |
3231 |
2598 |
|
29 |
1628 |
122.36 |
23 |
15 |
85 |
2492 |
2003 |
|
30 |
1637 |
110.97 |
26 |
17 |
83 |
2747 |
2208 |
|
31 |
1646 |
114.13 |
106 |
71 |
29 |
2671 |
2055 |
|
32 |
1655 |
114.28 |
24 |
16 |
84 |
2668 |
2144 |
|
33 |
1665 |
113.90 |
80 |
53 |
47 |
2677 |
2059 |
|
34 |
1674 |
114.75 |
27 |
18 |
82 |
2657 |
2136 |
|
35 |
1683 |
109.43 |
37 |
24 |
76 |
2786 |
2240 |
|
36 |
1692 |
120.08 |
65 |
43 |
57 |
2539 |
2041 |
|
37 |
1701 |
108.48 |
79 |
52 |
48 |
2810 |
2162 |
|
38 |
1710 |
131.31 |
75 |
50 |
50 |
2322 |
1866 |
|
39 |
1720 |
122.55 |
37 |
24 |
76 |
2488 |
2000 |
|
40 |
1729 |
122.15 |
27 |
18 |
82 |
2496 |
2006 |
|
41 |
1738 |
117.90 |
29 |
19 |
81 |
2586 |
2079 |
|
42 |
1747 |
119.45 |
43 |
28 |
72 |
2552 |
2052 |
|
43 |
1756 |
118.04 |
61 |
40 |
60 |
2583 |
2076 |
|
44 |
1765 |
125.04 |
81 |
54 |
46 |
2438 |
1960 |
|
45 |
1774 |
116.48 |
26 |
17 |
83 |
2617 |
2104 |
|
46 |
1784 |
115.45 |
30 |
19 |
81 |
2641 |
2123 |
|
47 |
1793 |
118.72 |
46 |
30 |
70 |
2568 |
2064 |
|
48 |
1802 |
106.33 |
81 |
54 |
46 |
2867 |
2206 |
|
49 |
1811 |
122.33 |
63 |
42 |
58 |
2492 |
2003 |
|
50 |
1820 |
107.81 |
32 |
21 |
79 |
2828 |
2273 |

Figure 4: Compressional Wave Velocity (Vp) versus Percentage Volume of Shale (%Shale) for Well OKO 5
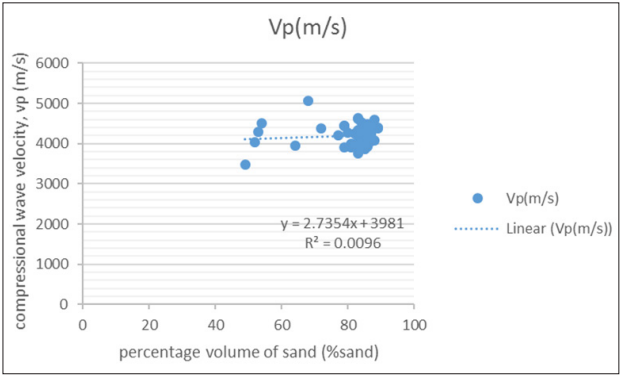
Figure 5: Compressional Wave Velocity (Vp) versus Percentage Volume of Sand (%Sand) for Well OKO 5
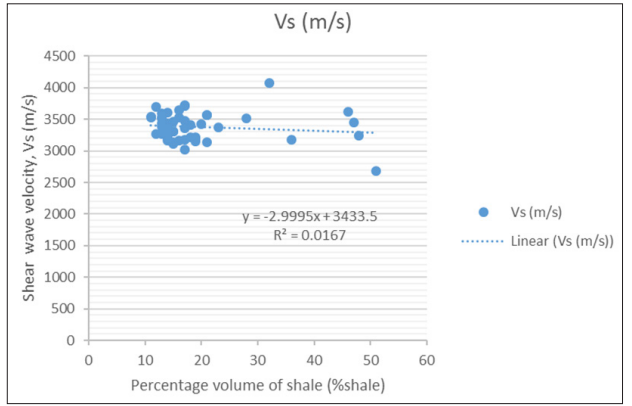
Figure 6: Shear Wave Velocity (Vp) versus Percentage Volume of Shale (%Shale) for Well OKO 5
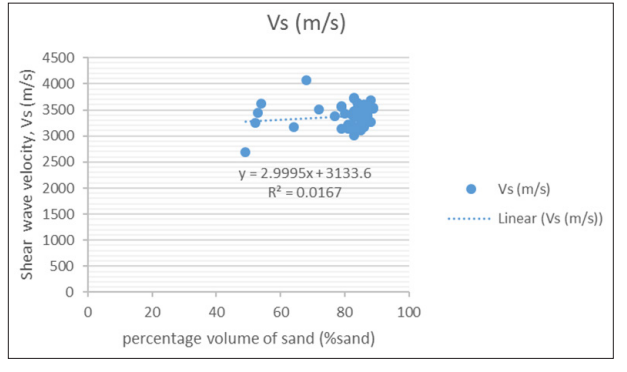
Figure 7: Shear Wave Velocity (Vp) versus Percentage Volume of Sand (%Sand) for Well OKO 5

Figure 8: Depth versus Compressional Wave Velocity (Vp) for Well OKO 5
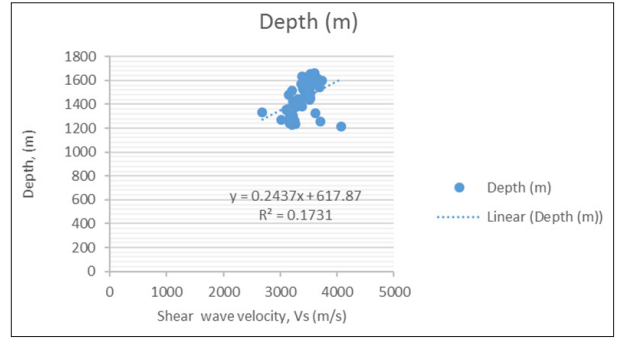
Figure 9: Depth versus Shear Wave Velocity (Vs) for Well OKO 5
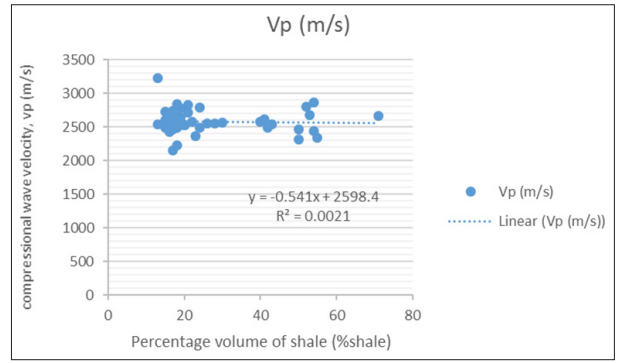
Figure 10: Compressional Wave Velocity (Vp) versus Percentage Volume of Shale (%Shale) for Well OKO 7
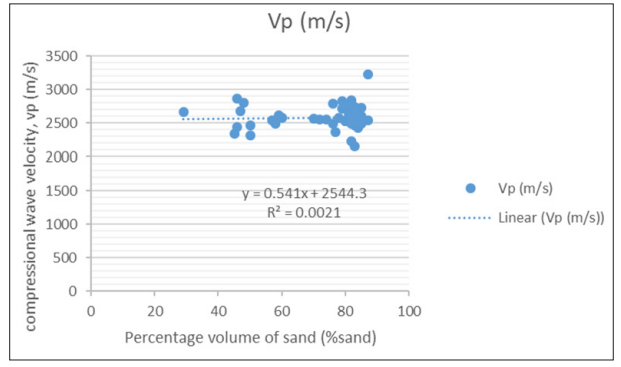
Figure 11: Compressional Wave Velocity (Vp) versus Percentage Volume of Sand (%Sand) for Well OKO 7
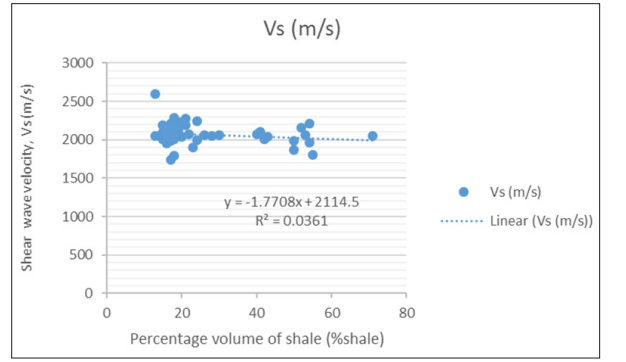
Figure 12: Shear Wave Velocity (Vp) versus Percentage Volume of Shale (%Shale) for Well OKO 7
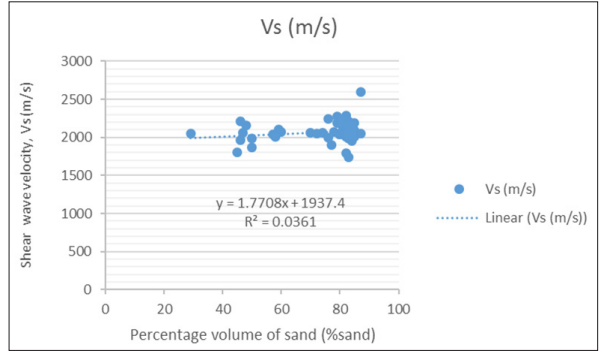
Figure 13: Shear Wave Velocity (Vp) versus Percentage Volume of Sand (%Sand) for Well OKO 7
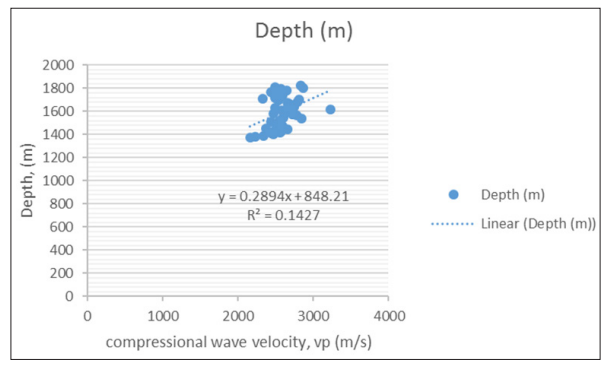
Figure 14: Depth versus Compressional Wave Velocity (Vp) for Well OKO 7
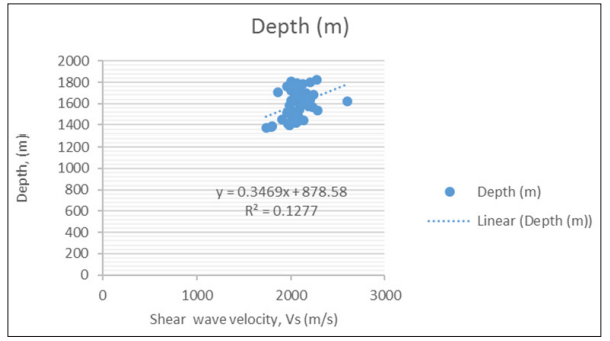
Figure 15: Depth versus Shear Wave Velocity (Vs) for Well OKO 7
Seismic wave velocity is simply the rate at which seismic waves (acoustic or sound waves) travel through the subsurface materials (like rocks and fluids). It can also be said to mean the rate at which elastic waves propagate through the earth material, it could be body or surface waves. Seismic wave velocity is affected or controlled by numerous geologic factors like material composition, porosity, temperature, pressure, pore geometry, pore fluid, density etc [16].
There is a gradual decrease in compressional wave velocity (Vp) as percentage volume of shale (%shale) increases in the two wells (OKO 5 and OKO 7).
There is a linear increase in both compressional wave velocity (Vp) and percentage volume of sand (%sand) in the two wells.
There is a progressive decrease in shear wave velocity (Vs) as percentage volume of shale (%shale) increases in the two wells.
Shear wave velocity (Vs) increases gradually as the percentage volume of sand (%sand) increases in all the wells.
There is a general increase in both compressional wave velocity (Vp) and shear wave velocity (Vs) with depth in the two wells.
Under ideal situation in a homogeneous and isotropic formation, seismic wave velocity increases with depth of burial or age of rocks it was observed from the results of this study that :