Author(s): Alexandre Coelho Serquiz
Obesity represents a risk factor for the emergence of chronic non-communicable diseases, such as Diabetes Mellitus and cardiovascular diseases. Adequate monitoring of blood glucose and lipid profile has been shown to be protective factors for the onset of these diseases. Some preparations based on carbohydrates are part of the culture of the northeast region of Brazil and, depending on how they are consumed, they can trigger different responses to the organism. This study evaluated the glycemic response and the concentration of some plasma fats after intake of preparations with added fibers and/or proteins. The BMI of the participants was calculated and the informed consent form and the FFQ were completed. Blood sampling was performed before food tasting. One hour after food intake, the blood collection procedure was repeated. It was found that, in the preparations with addition of fibers and/or proteins, there was less glycemic response in comparison to the food consumed alone; moreover, there were changes in the lipid profile. Thus, considering the addition of fibers and proteins to these preparations can be an interesting strategy for nutritional management
In the northeastern region of Brazil, according to data from the latest survey conducted by the Surveillance System of Risk and Protective Factors for Chronic Diseases by Telephone SurveyVigitel (2018), it is estimated that 55.7% of men and 52% of women, over 18 years, are overweight. This nutritional status can lead to obesity, which is characterized by excess fat body, making individuals more prone to development of several noncommunicable chronic diseases (NCDs), including diabetes mellitus (DM) and cardiovascular diseases (ALMEIDA et al., 2017).
Food plays a fundamental role in preventing NCDs; improper dietary habits (i.e., with low fruit consumption, high intake of ultra-processed, fat-rich and sugar-rich foods), as well as absence of physical activity, can help maintain the nutritional status of overweight and/or obesity (MONTEIRO, 2018).
Food culture in Brazil’s Northeast region is very diverse, with corn couscous being traditionally consumed as an integral part of the first meal of the day, together with butter, mixed with milk, or other foods. Another relevant food preparation is tapioca, a delicacy considered to be versatile, and it is often served with butter, coconut, chicken, eggs and cheese (CASCUDO, 2004; VERARDI, 2009).
Depending on the components, there may be interference in the glycemic index of foods in these preparations, owing to several factors, such as amount of starch, form of preparation, quality and quantity of carbohydrates contained in the preparation and addition of fibers, proteins and fats in meals containing carbohydrates. Therefore, the way in which they are consumed may affect the postprandial blood glucose level of individuals, as they are sources of carbohydrates that alter glycemic responses when ingested (MARTINS, 2017).
Previous studies have shown that the control of blood glucose and lipid profile can be considered as an interesting alternative for prevention and monitoring of several chronic diseases, since these high levels have been associated with greater insulin resistance, decreased serum levels of HDL cholesterol and high level of triglycerides (TG), thus making individuals more susceptible to various diseases. Many studies that included such monitoring underscored the need to maintain an adequate lipid profile, with an association with prevention of CNCDs. In addition, some foods, e.g., soluble fibers, can also reduce the concentration of plasma fats in individuals (BARROSO, 2017; WEIN; WOLFFRAM, 2014, SBC, 2017).
On a regular basis, health workers remove foods such as couscous and tapioca from people’s diet, which makes adherence to their eating plan more difficult to accomplish, since these foods are part of the Northeastern culture. Other health workers may not eliminate them from the diet, but they often recommend consuming such items as long as they are associated with other foods that are sources of protein and/or added fibers, because the latter components have beneficial effects. However, it is not known how relevant the interaction between these components can be so as to justify their intake.
Given the scarcity of studies of this format with the aforementioned Northeastern preparations in Brazil, this research was conceived as an opportunity to offer findings that can provide nutritionists with insights to carry out more targeted interventions, in addition to encouraging further research on the topic.
This was an experimental study with on-demand sampling, with male and female adults, living in the city of Natal, state of Rio Grande do Norte. The study included individuals who, during the research period, met the following criteria: no diagnosis of metabolic syndrome, diabetes and/or insulin resistance, untreated endocrine disorder, kidney disease, cancer, liver disease; pregnant women, no use of drugs that had an influence on physiological responses. In addition, they had to agree to participate in the research by signing a Free and Informed Consent Form (ICF) and filling out a Food Frequency Questionnaire (FFQ). Those who did not agree to participate in the research and/or did not meet the requirements were excluded, and so were those under 18 and over 60 years old. Data collection was performed on demand in May 2019, in the mornings. All participants were instructed on the purpose of the research to avoid possible errors that could compromise the results.
According to opinion number 3.250.442 and CAAE: 206288919.6.0000.5293, the research was approved by the Ethics Committee of the League from Rio Grande do Norte against Cancer.
Screening was performed by measuring weight and height and calculating the Body Mass Index (BMI) of the participants in the nutritional assessment laboratory of Centro Universitário do Rio Grande do Norte - UNI RN.
Weight was measured with a Welmy W110H electronic scale with a capacity of 200 kg, sensitivity of 100 g. The individuals were weighed while wearing light clothes, with an upright posture, barefoot, with their feet parallel and fully supported on the scale platform and with arms extended along their body. Height measurement was performed with a stadiometer previously attached to the scale. The subjects were erect, with their feet together and heels pressed against the wall. The apex of the ear and the outer corner of the eye were in a line parallel to the floor, forming an angle of 90° with the bar of the stadiometer, so that the horizontal bar could be lowered and supported on the head, allowing reading in centimeters. The weight and height measurements were used for calculating BMI, based on the formula (weight/height2), followed by a classification according to the ranges suggested by WHO (1995).
A food frequency questionnaire (FFQ) proposed by Sichieri (1998) was adapted by the researcher and applied to enable the analysis of the participants’ eating habits, thus achieving higherquality screening. Data collection was performed at the Nutritional Assessment Laboratory of UNI RN. This instrument showed the respondents’ food consumption pattern, since it is a tool that makes it possible to discover the consumption of food groups in a certain period of time (MACHADO, 2010).
Seven preparations were tested, each containing 50g of carbohydrate; one was bread rolls (as a standard food) and another protein preparation, calculated according to a food composition table. All foods were weighed on an Urano US 20/2POP-S electronic digital scale with a maximum capacity of 6 to 20 kg.
The preparations were produced by the researcher at UNI RN’s dietary technique laboratory, according to the manual of good manufacturing practices described in Resolution RDC 216 of September 15, 2004. This ensured a strict sanitary hygienic control. The experiment started 2 (two) hours before blood was collected from the volunteers, who had no expenses whatsoever.
Considering that the sampling was based on free demand, respecting the inclusion and exclusion criteria contained in item 2, the preparations to be tasted during the experiment were distributed according to the number of participants, as shown in Table 1.
| FOOD / PREPARATION | PARTICIPANT |
|---|---|
| Corn couscous only* | No. 01 |
| Bread roll only* | No. 02 |
| Couscous with scrambled eggs* | No. 03 |
| Tapioca with oat bran* | No. 04 |
| Tapioca with mozzarella cheese* | No. 05 |
| Unpeeled sweet potatoes only* | No. 06 |
| Couscous with oat bran* | No. 07 |
| Scrambled eggs only** | No. 08 |
| Tapioca with oat bran* | No. 09 |
| Couscous with oat bran * | No. 10 |
| Bread roll only* | No. 11 |
Caption: * Containing 50g of carbohydrates. ** 2 scrambled eggs made with butter.
Source: Authors’ own data
The 11 participants were numbered to facilitate the distribution of the preparations, as shown in Table 1. Each one tasted one single preparation, e.g., cooked couscous only, or the same preparation with added fibers such as oat bran, and proteins and fats, e.g., scrambled eggs and mozzarella cheese. The sweet potatoes were both cooked and eaten with their peel on. The tapioca preparation was tested in two ways: with added fibers (oat bran) and with the inclusion of protein (mozzarella cheese). Of the 8 preparations tested, only one did not contain 50g of carbohydrates (the 2 scrambled eggs). Such composition was selected to enable the observation of the impact of this protein food, without the influence of the carbohydrate, on postprandial blood glucose level and plasma fat.
Table 2 shows the way of preparing the foods that were used in the research.
| PREPARATION | PREPARATION MODE |
|---|---|
| Corn couscous only* | The cornmeal was moistened and left to rest for 10 minutes. Salt was added to taste, and the mixture was steamed for 10 minutes. Then it was served hot on a plate. |
| Couscous with scrambled eggs* | The cornmeal was moistened and left to rest for 10 minutes. Salt was added to taste, and the mixture was steamed for 10 minutes. Then it was served on a plate and mixed with scrambled eggs (Only 2 units of scrambled eggs and a knife-tip of butter) |
| Tapioca with oat bran* | The tapioca gum was mixed with the oat bran, and salt was added. The mixture was poured in the shape of a disc into a preheated frying pan, and cooked on both sides. It was served hot. |
| Tapioca with mozzarella cheese* | The tapioca gum was mixed with the oat bran, and salt was added. The mixture was poured in the shape of a disc into a preheated frying pan, and cooked on both sides. For the filling, a slice of mozzarella cheese was added. It was served hot |
| Unpeeled sweet potatoes only* | The potatoes were cleaned with a brush and sanitized, cut into slices and taken to the fire until they acquired a soft consistency. They were served with their peel on. |
| Couscous with oat bran* | The cornmeal was moistened and left to rest for 10 minutes. It was mixed with oat bran and salt was added to taste. It was steamed for 10 minutes. Then it was served hot on a plate. |
| Scrambled eggs only** | A knife-tip of butter was placed In a preheated frying pan and two eggs were poured and stirred until cooked. Salt was added to taste, and they were served hot. |
Blood collection was performed at the Nursing Laboratory of UNI RN, and it was divided into 2 moments (assessments 1 and 2):
Assessment 1: Patients had been fasting for at least 8 hours (SBD, 2017) and, according to the recommendations of the Doles colorimetric kit for all biochemical tests, blood was collected by venipuncture by an experienced nurse. After collection, the blood was added to tubes and centrifuged, and the plasma was separated for analysis of biochemical parameters.
Assessment 2: 1 (one) hour after the participants tasted the preparations, their blood was collected again by venipuncture by a previously trained nurse. After collection, the blood was added to tubes and centrifuged, and the plasma was separated for analysis of biochemical parameters. Blood glucose levels can increase within 15 minutes to 2 hours, depending on the type of carbohydrate eaten (SBD, 2017).
To assess biochemical parameters, the following values adopted by the Brazilian Diabetes Society (SBD, 2017) were used: for fasting blood glucose levels, those with values <100mg / dL were considered to be normoglycemic; prediabetes - values between 100 and 126mg/dL; and established diabetes, > 126mg/dL. After ingestion of the preparations, normal values were considered to be <140mg/dL; prediabetes, between 140 to 200mg/dL, and established diabetes> 200mg/dL. For fasting insulin, the reference value of 3 to 25 IU/mL was used. There are no previously established reference values for postprandial insulin. Commercial colorimetric kits (Doles) were used.
For lipoproteins, the values adopted were those of the Update of the Brazilian Dyslipidemia and Atherosclerosis Prevention Directive (2017): total cholesterol (<190mg/dL); LDL (<160mg/ dL), HDL (<40mg/dL for men and <50mg/dL for women) and triglycerides (<150mg/dL). Commercial colorimetric kits (Doles) were used to evaluate these parameters.
The postprandial blood glucose test was carried out. The participants were instructed to have a balanced diet two days before and not to do intense physical efforts in order to reduce the error margins in the results.
During all procedures for filling in the FFQ and the IFC, as well as during food tasting, all activities happened according to plan. There were no complications during blood collection, such as allergies and fainting, or any other episodes that were related to the procedure. Therefore, the process occurred safely and with no harm of any nature to the participants
Importantly, blood collection was made by a qualified and experienced nurse who carried out the collection in the most pleasant way possible, carefully examining each individual’s arm, in addition to using materials that provided the best well-being possible, thereby minimizing and eliminating any discomfort.
The HOMA1-IR index was calculated using the mathematical model described by Matthews et al.; (1985) with the formula: [blood glucose (mM) x insulin (μUI/mL) 22.5]. The cut-off point for insulin resistance was: HOMA1-IR> 4.65 (GELONEZE et al., 2009). The data were presented as mean and standard deviation.
All the results were compiled into a database was built using Microsoft Excel® 2010. All information was organized in a spreadsheet, by preparations with their respective results. Biochemical tests were performed in triplicate, which made it possible to perform descriptive statistics, with calculation of the mean and standard deviation of all exams.
Eleven adult individuals participated in the research, with an average of 27 years of age; 91% (n = 10) were females and 9% (n = 1) were males, who had met the inclusion and exclusion criteria. The average weight of the participants was 63 kg ± 15.2, height of 1.62m 2 ± 0.08 and BMI 23.58 kg/m2 ± 3.79, according to the data shown (Table 3). Also, of the 11 participants, 73% (n = 8) had eutrophic nutritional status, 18% (n = 2) were overweight and 9% (n = 1) were obese, according to the ranges suggested by WHO (1995).
The fact that the participants have an adequate nutritional status can be seen as a positive factor, since it indicates weaker probability of occurrence of metabolic disorders that could have influenced the results of the exams, when compared to individuals with excess weight and higher level of abdominal fat, who are more prone to changes in glucose level and plasma lipid metabolism (ABESO, 2016).
| VARIABLES | RESULTS (mean ±sd) |
|---|---|
| Age in years (mean) | 27 ± 10.3 |
| Sex (%): (n=11) | |
| MALE | 9% (n=1) |
| FEMALE | 91% (n=10) |
| Current weight (kg) | 63 kg ± 15.2 |
| Height (m2) | 1.62 ± 0.08 |
| BMI (Kg/m2) | 23.58 ± 3.79 |
| BMI classification (%): | |
| MALNUTRITION | 0% |
| EUTHROPHY | 73% (n=8) |
| OVERWEIGHT | 18% (n=2) |
| OBESITY | 9% (n=1) |
sd: standard deviation
BMI: BODY MASS INDEX
Source: Authors’ own data
A nutritionally balanced diet with the consumption of all food groups, associated with body weight control, can lead to better blood glucose levels in individuals. Several authors have suggested that being overweight plays a harmful role in changing these levels (FRANCISQUETI, 2015).
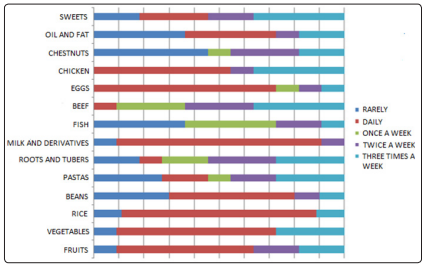
Figure 1: Distribution of habitual food consumption, according to the Food Frequency Questionnaire (FFQ) of the research participants in the year 2019 in Natal (RN)
The results in Table 2 show that participants have a daily intake of foods that are sources of essential macronutrients, vitamins and minerals for maintaining one’s health, including fruits, vegetables, legumes, eggs, milk and dairy products, rice, beans and chicken. The foods most consumed on a daily basis are milk/dairy products and eggs. The recommendation of these food groups and/or foods can be found in the Food Guide for the Brazilian Population (MS, 2014). There was no frequent consumption of oilseeds and fish. For other foods, consumption ranged between 1 to 3 times per week.
It should be noted that an inadequate diet can lead to excess weight, which will cause greater abdominal fat accumulation, characterizing an inflammatory state, and this could decrease insulin sensitivity, leading to an increase in blood glucose (NGUYEN, 2014).
| BIOCHEMICAL EXAMS | RESULTS (mean ±SD) |
|---|---|
| Fasting blood glucose (mg/dL) | 73.1±3.7 |
| Postprandial plasma glucose (mg/dL) | 97.8±22.2 |
| Fasting total cholesterol (mg/dL) | 182.4±30.7 |
| Postprandial total cholesterol (mg/dL) | 191.3±24.1 |
| Fasting LDL (mg/dL) | 122.1±17.4 |
| Postprandial LDL (mg/dL) | 124.4±18.0 |
| Fasting triglycerides (mg/dL) | 96.66±26.2 |
| Postprandial triglycerides (mg/dL) | 127.5±35.1 |
| Fasting HDL - Women (mg/dL) | 42.9±2.60 |
| Postprandial HDL - Women (mg/dL) | 41.0±2.10 |
| Fasting HDL - Men (mg/dL) | 45.0±2.34 |
| Postprandial HDL - Men (mg/dL) | 44.0±3.10 |
| Fasting insulin (IU/mL) | 13.8±1.77 |
| Postprandial insulin (IU/mL) | 10.7±2.73 |
| IHoma | 2.5±0.43 |
Caption:
SD: Standard deviation
Source: Authors’ own data
Considering the reference values specified in the methodology, concerning normal biochemical parameters for blood glucose, total cholesterol, LDL, triglycerides, insulin and Homa index, it can be seen that the average test results (Table 3) were within reference values that are recommended by the Brazilian guidelines for diabetes and cardiology.
The frequent consumption of fruits and vegetables, rice, chicken, milk and dairy products by all participants, as shown in the FFQ (Table 4), may probably be contributing to the results presented in the biochemical tests. The exception is HDL cholesterol, whose average level, in women, was slightly below the recommended one, i.e., normal values are considered to be> /50 mg/dL, whereas, the value was within the normal range (>/40mg/dL) for men.
Most participants had an adequate nutritional status regarding BMI, and their blood glucose and plasma fat levels were within the reference values. However, the non-frequency of consumption of fish and oilseeds, as can be seen in Table 5, may have influenced the low HDL levels, although many factors, such as smoking, alcohol consumption and intake of trans fats may also contribute to this change. The Brazilian Dyslipidemia Directive recommends eating fish rich in omega 3, two or more times a week, as well as eating good sources of monounsaturated fats, such as those present in oilseeds, to ensure good levels of this lipid fraction as a preventive factor for cardiovascular diseases (SBC, 2017).
| Preparation / Food | FG | PPG | FI | PPI |
|---|---|---|---|---|
| Bread rolls | 72 ±1.4 | 130.5±33.2 | 13.2±4.2 | 11.2±1.1 |
| Couscous only | 70±2.6 | 115.7±16.4 | 10.3±3.3 | 6.6±2.7 |
| Couscous with oat bran | 71.5±2.1 | 106.7±28.7 | 14.1±2.4 | 9.4±5.5 |
| Tapioca with oat bran | 71.7±1.7 | 87.5±24.7 | 14.7±2.4 | 11.8±6.5 |
| Tapioca with mozzarella cheese | 72.3±2.9 | 78±1.8 | 14±2.7 | 9.2±1.2 |
| Baked unpeeled sweet potatoes | 82±2.5 | 77±2.4 | 13±2.6 | 12±1.8 |
| Couscous with scrambled eggs | 72.3±3.1 | 71±2.6 | 15±1.9 | 10±1.3 |
| Scrambled eggs only | 73±2.1 | 116.4±3.8 | 16.3±1.5 | 16±1.9 |
FG - Fasting blood glucose
PPG - Postprandial glycemia
FI - Fasting insulin
PPI - Postprandial Insulin.
Source: Authors’ own data
According to the data (Table 5) on the behavior of baseline and postprandial blood glucose, it was found that the increase in blood glucose level was lower in almost all preparations, when compared to the intake of bread rolls, the staple food used by David Jenkins (1981).
Figure 2 shows the change in baseline and postprandial blood glucose levels of the participants in different types of preparations. In Figure 2A, a comparison can be made of the impact on the blood glucose level of the participants who ingested bread rolls and tapioca with oat bran. Both foods have high glycemic index (GI); the difference was that fiber was added during the preparation of tapioca.
The ingestion of soluble fibers seems to decrease the postprandial glycemic response because of their viscosity, which causes a delay in gastric emptying and the absorption of nutrients by the small intestine (EL KHOURY, 2012).
Figure 2B shows a greater increase in the blood glucose values of the participant who ingested the couscous only, when compared to the one who consumed the couscous with the addition of oat bran with beta-glucans.
Effects of oat bran have been reported in a study with healthy subjects, after they had eaten bread enriched with this component. The findings suggested that this type of fiber, depending on level of processing, can increase the viscosity of the bolus in the small intestine, interfering with the absorption of nutrients and, thus, influencing glycemic responses (YANNI, 2016).
A meta-analysis also showed that the consumption of dietary fiber from cereals, as a result of their protective action, reduces the risk of diabetes. Such study also underscored the role of several types of fiber, e.g., beta-glucans, which are polysaccharides present, for example, in oats and barley. Products which contains betaglucans (e.g., oat bran), are currently used to improve one’s health, and several clinical trials have demonstrated their potential in the treatment of cardiovascular diseases and diabetes mellitus (ANDRADE et al., 2015).
In Figure 2C, there was a decrease in the glycemic levels of the participant who ingested the sweet potato, when compared to the one who ate the bread rolls, who had higher glycemic levels.
One of the possible mechanisms attributed to this reduction in the participants who ate sweet potatoes is the composition of the food, which already has soluble fibers, according to the Food Composition Table (TACO). These fibers are found in the form of pectin, which not only increases satiety, but also reduces increases in blood glucose level by delaying the digestion of sugars and starches (SLAVIM, 2013).
This slowness in the digestive process, which generates a reduction in the absorptive rate of glucose and inhibits the hormone glucagon in the pancreas, can cause a lower increase of postprandial blood glucose, as a result of lesser stimulation of insulin secretion (LUDWIG, 2012).
According to Traver (2001), when foods are in their most natural form, they maintain a layer of germ that works as a type of barrier to enzymatic digestion. It can affect glycemic response, when compared to foods without this layer, e.g., refined foods, which have low fiber content (TACO) and are absorbed more quickly, as is the case of bread rolls.
A: Glycemic response after intake of bread rolls and tapioca with oat bran
B: Glycemic response after intake of couscous only and couscous with oat bran
C: Glycemic response after intake of bread rolls and unpeeled sweet potatoes
D: Glycemic response after intake of couscous only and couscous with scrambled eggs
E: Glycemic response after intake of bread rolls and scrambled eggs
F: Glycemic response after intake of bread rolls and tapioca with cheese
Source: Authors’ own data
Figure 2D shows a reduction in the blood glucose levels of those who consumed the couscous with scrambled eggs, when compared to the ingestion of couscous only. Such an effect is suggested by the presence of egg proteins and fats in the food preparation, which can contribute to a reduction in the rate of gastric emptying, delaying the glucose absorption process (SMART et al., 2013). There was a different outcome for those who ate couscous only because it has a high GI when eaten alone, and this may have caused a greater increase in blood glucose levels.
As a strategy to reduce the glycemic response, the Brazilian Diabetes Directive recommends replacing foods with a high GI, if they are to be eaten alone, with foods that contain a low GI (SBD, 2017).
The same result can be seen in Figure 2F, with tapioca, which is also considered to be a preparation with high GI, according to international dietary tables Foster (2002). When mozzarella cheese was added, there was a slight increase in blood glucose. The consumption of carbohydrate sources, mainly those with high GI, such as tapioca, associated with protein sources, such as mozzarella cheese, can cause an effect in reducing digestion speed in the stomach, which, consequently, may delay glucose absorption (BOZZETTO, 2016).
For insulin results, (Table 6), there was no change whatsoever, when compared to the reference values, all of which are within the normal range.
| Preparation | HDL (F) | HDL (PP) | LDL (F) | LDL (PP) | TGL (F) | TGL (PP) | TC (F) | TC (PP) |
|---|---|---|---|---|---|---|---|---|
| Bread rolls | 42.5 ±2.1 | 39±0.0 | 91.5±10.9 | 91.8±11.3 | 70.1±6.9 | 119±9.6 | 148±11.48 | 154.5±19.9 |
| Couscous only | 42± 2.5 | 44± 3.1 | 136.8±11.6 | 128.4±8.9 | 141 ±13.2 | 158.9 ±11.2 | 215.0 ±7.8 | 204.2 ±15.4 |
| Couscous with oat bran | 44.5 ±6.3 | 42.5±3.5 | 142.1±24 | 146.6±18.8 | 117.5±3.4 | 158.1±10 | 222.3±10.7 | 220.7±17.2 |
| Tapioca with oat bran | 41.5±2.1 | 41.5±3.5 | 116.0±9.9 | 118.9±2.6 | 79.9±4.9 | 109.45±13 | 145.3±11.4 | 182.3±9.4 |
| Tapioca with cheese | 40 ±2.18 | 38±3.6 | 107.4±10.9 | 108.4±10.4 | 78.3 ±6.94 | 78 ±12.7 | 163.1 ±13.5 | 162.0 ±13.2 |
| Baked unpeeled sweet potatoes | 45 ±2.2 | 44±3.3 | 120.2±8.4 | 126.6±12 | 89 ±5.4 | 82 ±13.21 | 183.0 ±14.6 | 187.0 ±18.3 |
| Couscous with scrambled eggs | 48 ±3.1 | 40±3.2 | 39.8±12.94 | 143.9±10.5 | 121.5 ±4.7 | 155.7±12.2 | 212.1 ±9.5 | 215.0 ±19.3 |
| Scrambled eggs only | 41±3.6 | 42±34.5 | 123±11.93 | 131.2±13.2 | 76 ±8.4 | 159±11.3 | 171.0 ±12.5 | 205 ±16.6 |
High Density Lipoproteins - HDL
Low Density Lipoproteins - LDL
Fasting - F
Postprandial 1 hour after food intake (PP)
Triglycerides - TGL
Total Cholesterol - TC
Source: Authors’ own data
Analyzing the values of plasma fats (Table 6), particularly for the participants who ate bread rolls, there was a decrease in HDL levels, an increase in triglycerides and total cholesterol and a small increase in LDL levels.
A possible mechanism that may be attributed to the rise in triglyceride levels is the quality of foods that are a source of refined carbohydrates, with a high glycemic index and low fiber content. Such components can promote the increase of blood sugar and blood insulin levels, and contribute to the synthesis of triglycerides (CASSANI, 2012)
There was a reduction in HDL cholesterol values for the participants who consumed almost all preparations, except for values that remained stable for those who ingested tapioca with oat bran, and there was a slight increase in the levels of those who ate couscous only and couscous with scrambled eggs.
Changes in HDL are very common and can be influenced by body weight, smoking, alcohol consumption, eating habits, and physical inactivity. They are a significant indicator for diseases that affect cardiovascular health. Diets high in saturated or trans fats and processed carbohydrates that quickly raise glucose levels can lower HDL levels. Thus, maintaining a diet rich in unsaturated fatty acids, consuming oilseeds, avocado, olive oil and inclusion of fish, at least twice a week, associated with the maintenance ofhealthy lifestyle habits, can contribute to an improvement in the lipid profile (SBC, 2017).
For the participants who ingested couscous only and couscous with oat bran, there was a reduction in TC levels. In addition to the above-mentioned hypoglycemic effect, soluble fibers, especially beta-glucans present in oat bran, can reduce plasma fats, corroborating with several studies that used oat bran in the diet and reported a reduction in LDL and TC (JANKIEWICZ, 2014).
Fibers can reduce serum cholesterol because they are soluble and have a typical gelatinous form that binds with bile acids in the intestine. They are excreted in feces, which reduces their reabsorption and, consequently, induces the production of more acids, reducing the cholesterol available for incorporation into lipoproteins. Another mechanism attributed to this reduction is fermentation of soluble fibers by the colon and synthesis of SCFAs, especially propionate, which inhibits cholesterol production by the liver, resulting in a decrease in plasma cholesterol levels (COSTA, 2016).
In line with such findings, a decision by the Food and Drug Administration (FDA) recommends foods such as oat flour and bran, and oat flakes for cholesterol reduction, based on several studies with consumption of products composed of these items, which cause a decrease in the serum levels of plasma fat.
When the tapioca preparation was eaten with added oat bran, the values of TGL and TC increased, which no longer occurred when mozzarella cheese was added to the tapioca, which caused a reduction.
This fact can be justified by the longer digestibility time required by cheese proteins. Moreover, in addition to carbohydrates, tapioca also presents lipids and proteins in its composition after addition of cheese. As a result, it can delay the gastric emptying time and influence the reduction of cholesterol absorption (NOAL, 2015; COZZOLINO, 2016).
In the plasma levels of those who ate boiled sweet potatoes and couscous with scrambled eggs, there was a small increase in LDL and TC. There was a reduction of TG for those who ate sweet potatoes, which did not happen with couscous with eggs, because it is a meal rich in cholesterol (FERNANDES, 2012).
Regarding those who ate only scrambled eggs, a food that contains a large amount of cholesterol, there was a small increase in LDL and a small increase in HDL. In a study cited by Dimarco et al., (2017), the daily intake of 1 whole chicken egg by healthy individuals increased the functionality of HDL, improving its anti-inflammatory and antioxidant action. The concentration of large LDL particles does not mean a negative aspect, but a positive modulation of the molecule, because the greater its volume, the lower the propensity to endothelial dysfunction in the arteries, which does not happen with smaller LDL particles.
It should be noted that, although there are values already recommended by the dyslipidemia guidelines regarding cholesterol intake, the individual’s lifestyle factor should be considered. The practice of physical exercise as well as a balanced diet, along with the intake of whole eggs, will probably not cause harm to the plasma fat profile. There may also be a protective factor against cardiovascular events, in addition to the fact that, in lipid metabolism, there are also many genes involved in the synthesis of proteins and enzymes. This can influence these variations of the plasma fat profile of each individual (HUNTER, 2017).
In conclusion, there was a lower increase of blood glucose levels in individuals who ingested preparations containing carbohydrates with addition of oat bran with beta-glucan, cheese and eggs, when compared to the intake of bread rolls, staple food and other foods consumed alone. This result shows that the inclusion of fibers and proteins can influence this glycemic response.
In addition, there was also a change in serum total cholesterol levels and their fractions, suggesting the role of beta-glucan fibers in oat bran in reducing lipid levels.
In northeastern Brazil, according to Cascudo, (2004) preparations such as couscous and tapioca are culturally consumed at different times of the day, with addition of butter, milk, and eggs when eaten for breakfast or dinner. These foods are often excluded from the usual diet of a person with diabetes, for example, based on the claim that they should be banned because of they cause greater stimulus in insulin secretion.
The preparations that were tested are part of the eating habits of a large part of the population of the Northeast from Brazil, as a result of cultural tradition. Therefore, this research may help health workers to offer advice on possible nutritional interventions for the population
Thus, addition of fibers and proteins to these preparations can be an interesting strategy, since several studies have shown the association of blood glucose monitoring and cholesterol reduction as preventive factors for the development of several non-communicable chronic diseases. It is worth mentioning that an individual’s environmental and genetic factors may also cause changes in these values; therefore, further studies are needed to corroborate these findings.