Evaluation and Bias correction of Tropical Applications of Meteorology using SATellite (TAMSAT) daily rainfall estimates over the data-scarce region of Southern Ethiopia
Author(s): Dawit Girma
Abstract
Precipitation data is an intrinsic parameter of rainfall-runoff simulation. since it is strongly hooked into the accuracy of the spatial and temporal representation of the precipitation. In regions where rainfall stations are scarce, additional data sources could also be needed. Satellite platforms have provided a satisfactory alternative because of their global coverage. Tropical Applications of Meteorology using SATellite (TAMSAT) is one such data source provided by the research group of the University of Reading, UK. This dataset provides rainfall estimates across Africa which captures the rainfall pattern in GenaleDawa River basin (southern Ethiopia) but with a magnitude bias of over-estimation and under-estimations. In this study, magnitude bias correction of the TAMSAT dataset with a linear scaling technique resulted in a rainfall grid of the area with ~4 km spatial resolution of a 35 year (1983–2017) daily rainfall dataset.Intercomparison between Satellite rainfall product and observed data were done using point to grid method selecting nine representative metrological stations.The average correlation R is 0.45 and the average NS is 0.028 and the Categorical index POD, FAR, FB and HSS, values were 0.49,0.4,0.84, and 0.4) before bias correction. After bias correction, these values were improved to the average value of R=0.87 and NS =0.764 and POD, FAR, FB, and HSS of (0.71,0.22, 0.92, and 0.66 respectively.
Introduction
A precise analysis of water resources issues (e.g., flood,
drought, extreme events, socio-economic analysis) entails
accurate measures/estimations of hydroclimatic variables.For a
comprehensive of the impact of rainfall on the environment, one
must use appropriate spatial and temporal resolution for rainfall
measurements [1]. Satellite-based precipitation estimates with
high spatial and temporal resolution and enormous areal coverage
provide a possible alternative source of data for hydrological
models in areas where conventional rain gauge precipitation
measurements are not readily available or sparsely available and no
radar technology for measuring representative rainfall magnitude
[1-4]. These applications would even have far-reaching effects
for several developing countries whose ground-based rain gauges
are sparse and no radar technology for measuring representative
rainfall magnitude. However, there are errors associated with
satellite-based rainfall estimates which prompt several questions
[7]. How accurate are satellite-based rainfall products? Can highresolution satellite rainfall products be used for hydrological
applications? Lack of knowledge on the accuracy of those
satellite products is a challenge to the hydrological community,
especially under complex terrain.Satellite rainfall products are
subject to the various sourceof errors related to temporal sampling,
instrument, algorithm, gaps in revisit times, indirect relationship
between remotely sensed signals and rainfall rate, and also its
performance varies with region, elevation, and season [4-6]. A
wide range of satellite-based estimations of precipitation isout
there in high spatial and temporal resolution, which makes them
useful for distributed hydrological models. However, not all
the satellite products are suitable for all the regions (i.e., their
suitability and performance vary from region to region) [7,8].
There is, therefore, a requirement to quantify their uncertainties
before selecting the acceptable product for the region. Therefore,
hydrologists are still uncertain in applying these products directly
in hydrological applications knowing that many uncertainties
are still involved in such techniques [9,10]. Given the practical
limitations of the hydro-metrological station has brought about
the utilization of satellite remote sensing as a potential method of
quantifying rainfall such as visible and infrared techniques that
derive qualitative or quantitative appraise of rainfall from satellite
imagery. Inadequate hydro-metrological network coupled with
inadequate maintenance of rainfall gauge measuring instruments,
human error, and inaccessible areas such as sloping areas has
resulted in the existence of gaps in rainfall measurements as most
occasions are not recorded requires a means to improve on the
available data accessible from the gauge precipitation network.
Satellite precipitation estimation will, therefore, be important
to address issues such as precipitation occurrence, magnitude,
and apportionment at all-time scales for many applications in
meteorology, climatology, hydrology, and environmental sciences.
Besides this, it will provide much information required in the
management of water resources and flood forecasting. To utilize
these rainfall estimates appropriately it is essential to know their
accuracy and expected error characteristics [11,12].
Several studies assessed the performance of satellite rainfall
products on streamflow simulation capability, Bias correction,
and Validation Worldwide. Regarding our country Ethiopia,
some studies have been conducted to evaluate performance,
validation, Inter-comparison of satellite-based rainfall products
especially for the Blue Nile basin [1,13,6,14,7,8]. In other parts
of Ethiopia high- resolution rainfall products have been evaluated
for different purposes [15,16,2,10,5,7,8]. The rainfall data sets and
the modeling activities were used to characterize and determine
performance in input precipitation data; high-resolution satellite
rainfall products bias-corrected TAMSAT. The main objective of
this study is to evaluate and bias correct high-resolution satellite
rainfall products (TAMSAT).
Materials and Methods
Study area description
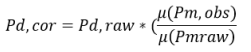
GenaleDawa river basin lies in the southern part of Ethiopia,
covering parts of Oromia, SNNP, and Somali regions (figure 1).
Geographically located between 30 30? and 70 20? North latitude
and 37005? and 430 20? East longitude. The basin covers an
area of 172889 km2 [17]. It is the third-largest river basin, after
Wabi Shebelle and Abbay river basins. Neighboring river basins
are the Wabi Shebelle to the north and east, Rift Valley basin to
the west. GenaleDawa river basin hasavery scarce metrological
station and Mountainous topography and is provided as the area
where satellite rainfall products are beneficial. The easterly and
southeasterly moist air currents ascend over the highlands in
spring, produce the main rainy season in southern Ethiopia in
general, and in GenaleDawa basin in particular and bring ?small
rains? of spring (March to May) to most parts of the country.
Southeast (GenaleDawariver basin), therefore, gets its first maxima
rainfall during spring and receives the year?s secondary maxima
rainfall during autumn from the Indian Ocean easterlies. While
the basin receives little rainfall in summer compared to spring
(March to May) and autumn (September to November) due to
the case that the Southerly Indian Ocean air currents lie in the lee
side of the highlands in summer and Atlantic westerly?s reach the
southeastern lowlands (GenaleDawa) after losing their moisture
on the highlands to the west.
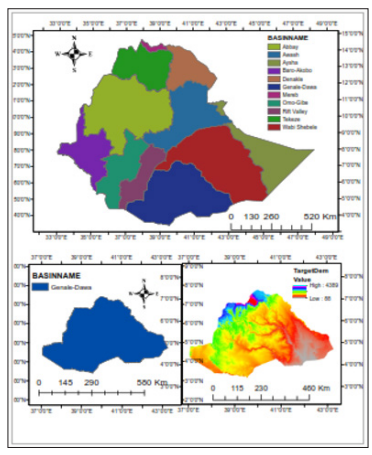
Figure 1: Study area map
Dataset
The TAMSAT daily rainfallestimates have been available for
all of Africa since January 1983at a spatial resolution of0.0375°
(about 4 km);The data was compiled in 9998 grid point file as
time series excel file.The daily observed datasets for 9rain gauge
stations throughout the area were accessed fromthe Ethiopian
NMA (National Meteorology Agency).The climatic data and
satellite data used for this study covers 22 years from January
1996 to December 2017.
Comparison/Evaluation
There are two commonly used methods for evaluating the satellite
rainfall products, namely, point to grid (point-based) and grid to
grid (interpolated grid to satellite grid) methods. Individual gauge
stations-based rainfall is compared with grid-based satellite and
reanalysis rainfall products in point-based comparison methods,
while in the grid-to-grid comparison, the gauge-based observed
rainfall is interpolated and then evaluated at the same resolutions
of the selected grid-based satellite and reanalysis rainfall products.
The grid-grid assessment approach is approved forthe area is
covered with a high number and uniformly networked gauge
stations. In the regionwhere the distributionnumber of rain gauge
stations sparse and complex terrain as in the case of the present
study, point to grid comparison method is the best way to evaluate
each satellite and reanalysis rainfall product independently using
their native resolution [10]. Hence, point to grid method is adopted
for this study.
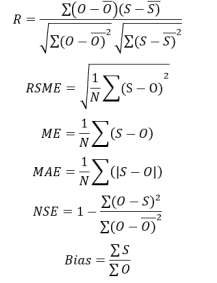
Bias Correction
Studies on the comparison of TAMSAT with ground-observed
rainfall data confirmed that TAMSAT is excellent alternative
data set for hydrological modeling on a large scale showing that
TAMSAT precipitation can reproduce the observed rainfall pattern
in Ethiopia, with magnitude variation. Therefore, a bias correction
method that focuses mainly on the magnitude rather than the
pattern or trend of the datasets is important. From among the
various arrays of rainfall data bias correction techniques, most
of which are statistical, the linear scaling (LS) bias correction
method was selected for this study as it aims to match the monthly
mean of corrected values as closely as possible with that of the
observed ones. It operates with monthly correction values based
on the difference between observed and raw data. The bias factor
for precipitation is a multiplier that is computed from the ratio of
the monthly mean of the observed to the raw dataset:
Where Pdcor is the corrected daily precipitation and Pdraw is the
daily raw precipitation data from TAMSAT, μ (Pm,obs)is the longterm mean value of monthly rainfall of observed data, and μ(Pm
raw)is the long-term mean value of the monthly raw rainfall data.
Performance Analysis
To evaluate the model simulation outputs relative to the observed
data, model performance evaluation is necessary.Weuse both
statistical indices and categorical statistical indices were adopted to
evaluate the precision of the satellite rainfall products. Statistical
indices evaluate the performance of the Satellite rainfall product in
estimating the cumulative rainfall over a timeframe. The statistical
indices are:
Where O is the rainfall total at a reference gauging station, Ō is
the average observed rainfall total at a reference gauging station,
S is a rainfall total for a satellite product, and N is the number of
data pairs compared. The dimensions of ME and MAE are mm,
whereas NSE and Bias are dimensionless. ME and MAE both
provide information on the average estimation error. ME ranges
from -∞ to ∞, whereas MAE ranges from 0 to ∞, and a perfect
score for both is 0. MAE was used here instead of the root mean
square error to avoid the effect of extremely high rainfall values
or outliers [18]. The Bias statistic indicates how well the mean
estimate and gauge mean correspond; its value ranges from 0 to
∞, with 1 being a perfect score. Values of Bias >1 and positive
ME values indicate an overestimation, whereas values of Bias
<1 and negative ME indicate an underestimation. NSE shows the
skill of the estimate relative to a reference (in this case, the mean
of the gauge observations); it ranges from -∞ to 1, with higher
values indicating better agreement between the Satellite rainfall
and gauge measurements. Negative NSE values indicate that the
reference mean is a better estimate than the SREs; 0 indicates that
the reference mean is as good as the Satellite rainfall. A categorical
statistical index assesses the rainfall detection capacities of satellite
rainfall products. To assesses the rainfall detection capabilities
of the Satellite rainfall estimate (rainfall product threshold ≥1
mm), we take a suite of binary skill scores that encapsulated
information on rain/no-rain days in a contingency table (Table 1).
The contingency table was constructed to calculate categorical
statistics that included the probability of detection (POD), false
alarm ratio (FAR), frequency bias index (FBI), and Heidke skill
score (HSS) as follows:
Table 1: Contingency table for comparing rain Station-based
measurements and satellite-based rainfall produc
|
Gauge >=1 mm |
Gauge <1 mm |
| Satellite >=1 mm |
A (Hit) |
B (false detection) |
| Satellite <1 mm |
C (Miss) |
D (Correct No rain) |
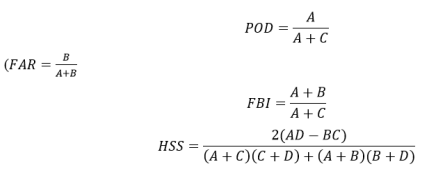
Where A, B, C, and D showing hits (the satellite successfully
detected rain), false alarms (the satellite failed to detect the norain case), misses (the satellite failed to detect rain), and correct
negatives (the satellite successfully detected the no-rain case),
respectively (Table 2). POD indicates the proportion of observed
rainfall days that were correctly estimated by the satellite product.
FAR is the proportion of satellite-estimated rainfall days when
there was no rain. Both POD and FAR range from 0 to 1, with
1 being a perfect POD and 0 being a perfect FAR. FBI, ranges
from 0 to ∞, compares the rainfall-day detection frequency of the
Satellite rainfall product with that of the rain gauge measurements:
an FBI of less than (greater than) 1 indicates an underestimation
(overestimation) of rainfall days. HSS ranges from -∞ to 1, is a
measure of the overall skill of the rainfall-day estimates after rain
events detected by random chance have been removed: an HSS
less than 0 indicates that random chance is better than the Satellite
rainfall product; an HSS of 0 means the Satellite rainfall product
has no skill; and an HSS of 1 indicates a perfect estimation of
rainfall days by the Satellite rainfall product [4,5,7].
Result and Discussion
Bias Correction of TAMSAT Rainfall Product
Hydrometeorological datasets have significant importance
on sustainable water resources management, as well as for
differentsocio-economic activities. However, it is noted that
acquiring an accurate and consistent set of precipitation data
is a challengingtask throughout the world especially in Africa
[7,19,8,10]. When comparing TAMSAT rainfall product with the
in-situ rainfall of selected stations, it shows a large discrepancy.
To use the bias-corrected dataset for hydrological modeling and
other importance, the raw TAMSAT rainfall data were corrected
with LS bias correcting techniques [20,7,21,4]. Both statistical and
categorical tests clearly describe that the raw TAMSAT rainfall
dataset has been biased in both directions (underestimation and
overestimation) of the daily rainfall [4,11]. However, the overall
magnitude of the raw TAMSAT rainfall dataset overestimates
or underestimates the daily rainfall of the basin, indicated with
a value of R, NSE, and RSME (0.26 - 0.58), (-0.41 - 0.26) and
(5.21 - 10.3) respectively for all representative station (Figure
2 and 3). Categorically the values of POD, FAR, FBI and HSS
(0.38 - 0.6), (0.26 - 0.65), (0.75 - 1.22), (0.25 - 0.47) respectively.
The corrected TAMSAT rainfall dataset was the best fit with the
observed dataset, with a small range of RMSE (1.77-5.6) and
a strong range of NSE co-efficient (0.74 - 0.91) and a strong R
(0.84 - 0.95). The bias correction gave a better result and lower
values of PBIAS, ranging from 0.98 to 1.25. The categorical
improvement is indicated by a strong value of POD, FAR, FBI
and HSS (0.75 - 0.85), (0.17 - 0.3), (0.75 - 1.1) and (0.58 - 0.89)
respectively.
Table 2: Comparison of categorical Evaluation Statistics for
raw, bias-corrected TAMSAT
| Evaluation Statistics |
TAMSAT
raw |
TAMSAT
Cor |
| Categorical |
Categorical |
0.49 |
0.71 |
| FAR |
0.40 |
0.22 |
| FB |
0.84 |
0.92 |
| HSS |
0.41 |
0.66 |
| Continuous |
R |
0.45 |
0.88 |
| ME |
0.11 |
0.05 |
| BIAS |
1.06 |
1.08 |
| RSME |
7.6 |
3.70 |
| NSE |
0.028 |
0.76 |
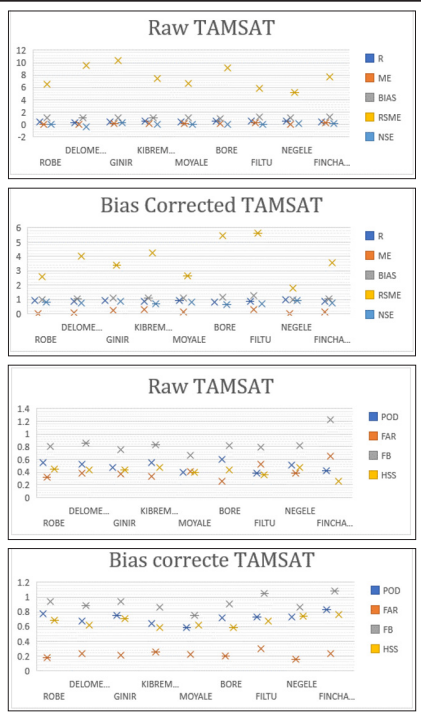
Figure 2: Statistical and Categorical index for raw and bias
corrected TAMSAT
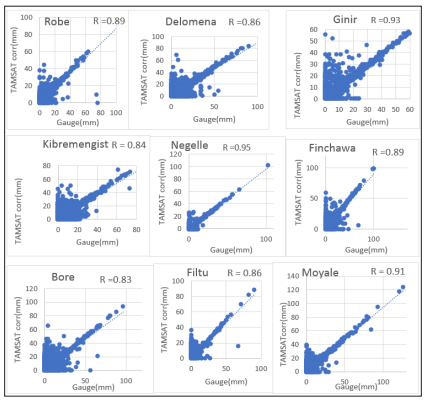
Figure 3: Intercomparison of daily rainfall TAMSAT and rain
gauge
To use the corrected dataset for hydrological modeling and other
purposes, the rawTAMSAT data was adjusted with Linear Scaling
bias correcting techniques.However, the spatial distribution of the
corrected TAMSATdataset shows a betterrepresentation of the
observed rainfalldistribution of the area than the raw TAMSAT data.
Comparingthe mean annual time series data for the threerainfall
datasets using different statisticalmeasures (Figure 4 and 5). The
statistical index clearly describes that the raw TAMSATdataset
has biased in both directions (underestimation and overestimation)
of the mean annual rainfall. However, the overall trend of the
raw TAMSAT dataset underestimates the mean annualrainfall of
the area, indicated with a negative value of PBIAS (-0.03- -0.35)
and overestimates with a positive value of PBIAS (>0.04) and
an NSE value of -0.4. On the other hand, the correctedTAMSAT
data shows a positive and small PBIAS value, 0.98-1.25, anda
strong NSE co-efficient, 0.67-0.95.
A bias correction performance test was also carried out usingthe
statistical measures that include root-mean-square error (RMSE),
Nash-Sutcliffe Efficiency (NSE), and percent bias (PBIAS) to
evaluate the quality of the adjusted dataset on differenttime scales
[20,10,1,5,22]. The annual performance assessmentindicated
that the whole grid point and gave a strong NSE co-efficient
(>=0.78),the positive low magnitude of PBIAS (>=0.98), and
significantly smallRMSE, unlike the raw TAMSAT data. The
monthlyand daily performance evaluationshave been found
useful for sampleground-observation gauging stations that were
distributedacross the basin.On daily time scales, the performance
measures of RMSE,NSE, PBIAS, and R produced results in
the range of 0.177-5.62,0.67-0.92,0.98-1.2, and 0.82-0.92
respectively, which are indicators ofthe good performance of the
bias correction conducted.
The annual variation of rain observed by rain gauges was generally
captured by both satellite rainfall products for all selected stations.
TAMSAT product shows an overestimation of annual maximum
rainfall from 84.4 to 2054.81mm/yr. for the whole study period
when compared with Observed data. In capturing both magnitude
and trend of annual rainfall bias-corrected TAMSAT shows best
performance [20,23].
The trend of monthly rainfall observed at rain gauges iscorrectly
captured by Biascorrected TAMSAT satellite rainfall products.
Bias corrected TAMSAT overestimate monthly peak rainfall
observed by rain gauge in the range of 0.75% to 3.94%for all
stations except three stations; Robe, Bore, and Moyale Stations
Which underestimate monthly peak by (2.16%,3.75%, and 5.89%)
respectively.
An inter-comparison of daily rainfall estimates, the comparison
statistics (R = Pearson?s correlation coefficient) between TAMSAT
rainfall values and rain gauge values were very good which ranges
from 0.827 to 0.951for Selected representative stations.
The inter-comparison, especially the daily basis is vital. Therefore,
bias-corrected TAMSAT rainfall estimates gave a very good result,
and this result also consistent with findings in Eastern parts of
Ethiopia [5,24,20,2,25,26]. There have been subsequent studies
conducted in Ethiopia to evaluate satellite rainfall products in
the estimation of rainfall, [1,5,11,27,23]; based on their studies
and the result of this study, it is concluded that TAMSAT is much
closer to the actual rainfall fields in Ethiopian basins [12,23,7,8].
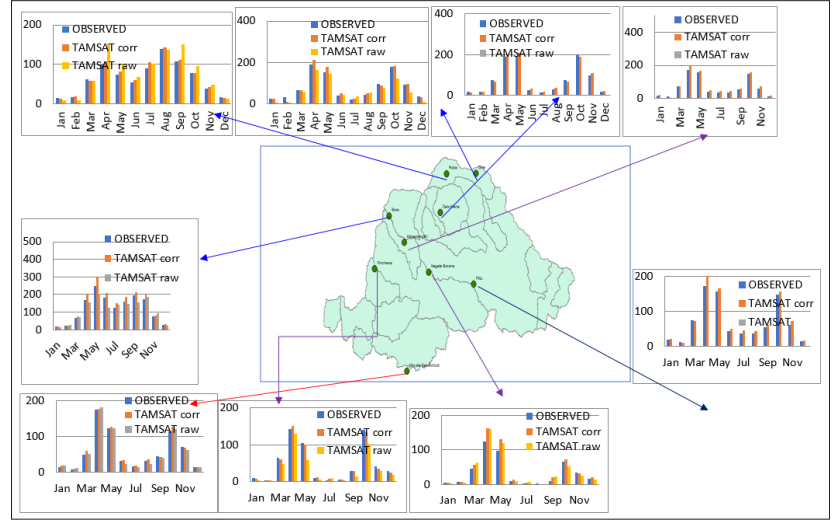
Figure 4: Inter- Comparison of Mean Monthly Rainfall
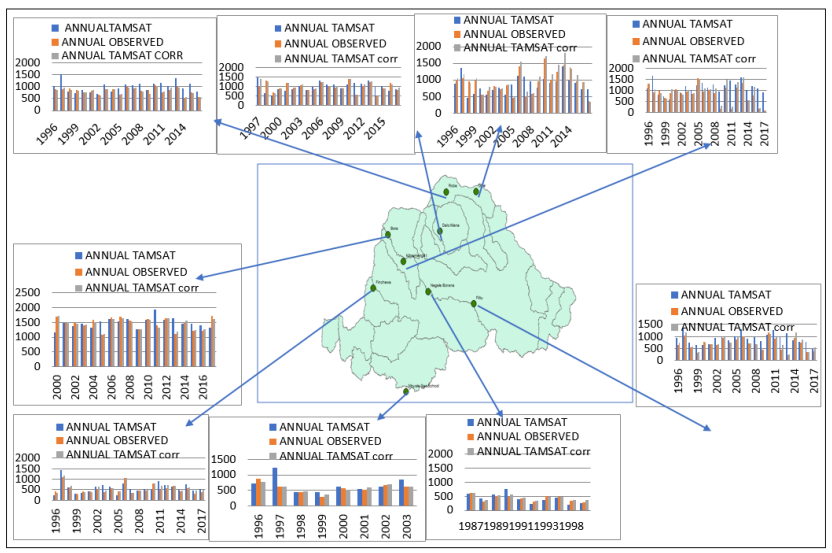
Figure 5: Inter-comparison of annual rainfall
Conclusion
High-resolution satellite rainfall product is getting very high
recognitions as a source of rainfall data in data-scarce regions.
The Southern part of Ethiopia (GenaleDawa river basin) can be
provided as a good example where the use of satellite-derived
precipitation could be beneficial. Satellite-based precipitation
estimates exhibit large systematic and random biases. The biases
persist when the estimates are aggregated over time and, hence, may
cause large uncertainties. The study mainly focused on ?Evaluation
and Bias correction of Tropical Applications of Meteorology using
SATellite (TAMSAT) daily rainfallestimates over the data-scarce
region of Southern Ethiopia? Both statistical and categorical
tests clearly describe that the raw TAMSAT rainfall dataset has
biased in both directions (underestimation and overestimation)
of the daily rainfall. However, the overallmagnitude of the raw
TAMSAT rainfall dataset overestimates or underestimates the
daily rainfall of the basin, indicated with a value of R, NSE, and
RSME (0.26 - 0.58), (-0.41 - 0.26) and (5.21 - 10.3) respectively
for all representative station. Categorically the values of POD,
FAR, FBI and HSS (0.38 - 0.6), (0.26 - 0.65), (0.75 - 1.22), (0.25
- 0.47) respectively. The bias-corrected TAMSAT rainfall dataset
was the best fit with the observed dataset, with a small range of
RMSE (1.77-5.6) and a strong range of NSE co-efficient (0.74
- 0.91) and a strong R (0.84 - 0.95). The bias correction gave a
better result and lower values of PBIAS, ranging from 0.98 to
1.25. The categorical improvement is indicated by a strong value
of POD, FAR, FBI, and HSS (0.75 - 0.85), (0.17 - 0.3), (0.75 - 1.1)
and (0.58 - 0.89) respectively, which are indicators ofthe good
performance of the bias correction conducted.
Data Access and Format
The daily rainfall estimates (in mm per day) are freely available
as netCDF files for each day from the TAMSAT website (http://
www.tamsat.org.uk) and the University of Reading Research Data
Archive. The spatial resolution is 0.0375° latitude by 0.0375°
longitude with estimates provided for all land points in Africa,
including Madagascar. In addition, the TAMSAT website contains
quick look images for each day and a time series extraction tool can
be used to extract area-averaged data for countries, administrative
districts, and user-defined rectangular regions or user-defined
pixels in CSV format.
The weather input data required for SWAT simulation includes
daily data of Precipitation, maximum and minimum temperature,
relative humidity, wind speed, and solar radiation. These were
obtained from the Ethiopian National Meteorological Agency.
The weather data used were represented from six stations inside
GenaleDawa River basin. The climatic data used for this study
covers 22 years from January 1996 to December 2017.
Acknowledgement
We would like to extend our sincere gratitude to the Ethiopian
Ministry of Water and Energy; Ethiopian National Metrology
Agency,Wolkite University, and Addis Ababa Universityfor their
generous help throughout this research work.
References
- Getachew Tesfaye Ayehu Tsegaye Tadesse, Berhan Gessesse,
Tufa Dinku (2018) Validation of new satellite rainfall products
over the upper blue nile basin. Atmospheric Measurement
Techniques p1-16.
- Chad Furl Dawit Ghebreyesus and Hatim O. Sharif (2018)
Assessment of the Performance of Satellite-Based Rainfall
product overupper Blue Nile River basin. Geosciences. [s.l.]:
Remote sensing, pp1-18.
- T Dinku P Ceccato, E Grover-Kopec, M Lemma, SJ Connor
(2006) C F Validation of satellite rainfall products over East
Africa?s complex topography, International Journal of Remote
Sensing p2-25.
- Belete Berhanu Yilma Seleshi, Solomon S Demisse, Assefa
M Melesse (2015) Bias correction and characterization of
climate forecast system re-analysis daily precipitation in
Ethiopia using fuzzy overlay, Royal Meteorological Society.
- Gella Getachew (2019) Workineh Statistical Evaluation of
High Resolution Satellite Precipitation Products in Arid and
Semi-Arid Parts of Ethiopia: A Note for Hydro-meteorological
Applications. Water and Environment Journal p86.
- Menberu M Bitew, Mekonnen Gebremichael Lula T
Ghebremichae, Yared A Bayissa (2011) Evaluation of HighResolution Satellite Rainfall Products through Streamflow.
Journal of Hydrometrology pp2-15.
- Haileyesus Belay Lakew Semu Ayalew Moges,Dereje Hailu
Asfaw Hydrological performance evaluation of multiple
satellite precipitation products in the upper Blue Nile basin,
Ethiopia [Journal]. - [s.l.]: Journal of Hydrology: Regional
Studies 2020.
- Tesfa Gebrie Andualem, Demelash Ademe Malede, Mamuye
Tebebal Ejigu (2020) Performance evaluation of integrated
multi satellite retrieval for global precipitation measurement
products over Gilgel Abay watershed, Upper Blue Nile
Basin, Ethiopia [Journal]. [s.l.]: Modeling Earth Systems
and Environment.
- Dejene Sahlu Semu A Moges, Efthymios I Nikolopoulos,
Emmanouil N. Anagnostou, Dereje Hailu (2017) Evaluation
of High-Resolution Multisatellite and Reanalysis Rainfall
Products over East Africa. Hindawi Advances in Meteorology
pp1-15.
- Estifanos Lemma Shruti Upadhyaya, RAA J Ramsankaran
(2019) Investigating the performance of satellite and
reanalysis rainfall products at monthly timescales across
different rainfall regimes of Ethiopia. International Journal
of Remote Sensing p9-10.
- Yared Bayissa Tsegaye Tadesse, Getachew B Demisse,
Andualem Shiferaw (2017) Evaluation of Satellite-Based
Rainfall Estimates and Application to Monitor Meteorological
Drought for the Upper Blue Nile Basin, Ethiopia. Remote
Sensing pp1-18.
- Mohammed Basheer Nadir Ahmed Elagib (2019) Performance
of satellite-based and GPCC 7.0 rainfall products in an
extremely data-scarce country in the Nile Basin. Atmospheric
Research 2019.
- Shimelis B Gebere Tena Alamirew, Broder J Merkel (2015)
Performance of High Resolution Satellite Rainfall Products
over Data Scarce Parts of Eastern Ethiopia. remote sensing
pp1-25.
- Gebremichael MM Bitew, Meneberu M (2011) Assessment
of satellite rainfall products for streamflow simulation.
Hydrology and Earth Sciences p1-9.
- Bumke K Clemens M (2001) A comparison of precipitation
in - situ measurements and model predictions over the Baltic
Sea Area. hydrology, Oceans and Atmosphere pp5-6.
- Haile AT Rientje T, Reggiani P (2009) Model sensitivity
to rainfall representation: the representative elementary
watershed. Water Resource Research pp1-5.
- FDRE Ministry of Water (2013) Energy and electricity Water
resources integrated development master plan.
- Legates DR, McCabe GJ (1999) Evaluating the use of
goodness-of-fit measures in hydrologic and hydroclimatic model validation.Water Resources Res p233-241.
- Mesfin Benti Tolera Il-Moon Chung, Sun Woo Chang (2018)
Evaluation of the Climate Forecast System Reanalysis,Weather
Data for Watershed Modeling in Upper Awash Basin, Ethiopia.
Water 2018.
- Ayele Almaw Fenta Hiroshi Yasuda, Katsuyuki Shimizu,
Yasuomi Ibaraki, Nigussie Haregeweyn, Takayuki Kawai, et
al. (2018) Evaluation of satellite rainfall estimates over the
Lake Tana basinat the source region of the Blue Nile River.
Athmospheric Research p1-36.
- Solomon Hailu Gebrechorkos (2018) Stephan Hülsmann,
and Christian Bernhofer Evaluation of multiple climate data
sources for managing environmental resources in East Africa.
Hydrology and Earth System Science.
- Tesfay G Gebremicael Yasir A Mohamed, Pieter van der Zaag,
Amdom G Berhe, Gebremedhin G Haile, Eyasu Y Hagos,
Mulubrhan K Hagos (2017) Comparison and validation of
eight satellite rainfall products over the rugged topography of
Tekeze-Atbara Basin at different spatial and temporal scales.
Journal of Hydrology and Earth System Science. p1-31.
- Tufa Dinku Kinfe Hailemariam, Ross Maidment, Elena
Tarnavskyc, Stephen Connord (2013) Combined use of
satellite estimates and rain gauge observations to generate
high-quality historical rainfall time series over Ethiopia.
International Journal of Climatology.
- AW Worqlul B Maathuis, AA Adem, SS Demissie, S Langan,
TS Steenhuis (2014) Comparison of rainfall estimations by
TRMM 3B42, MPEG and CFSR with ground-observed data
for the Lake Tana basin in Ethiopia. Hydrology and Earth
System Science 1-11.
- Bewket Tibebe (2011) Assessiment of Surface Runoff
Generation and Soil Erosion Rates for a Small Watershed in
Awash River Basin. Journal of Hydology.
- Feyera A Hirpa, Mekonnen Gebremichael (2009) Thomas
Hopson Evaluation of High-Resolution Satellite Precipitation
Products Over Very Complex Terrain in Ethiopia. Journal of
Applied Meteorology and Climatology p1-9.
- Matthew P Young Charles JR Williams, J Christine Chiu,
Ross I Maidment (2014) Investigation of Discrepancies
in Satellite Rainfall Estimates over Ethiopia. Journal of
Hydrometeorology p2347-2368.
View PDF