Author(s): <p>Pooja Badgujar</p>
As the digital era evolves, the demand for reliable and efficient big data ecosystems intensifies, especially within financial institutions like Wells Fargo. This paper explores the critical role of continuous monitoring and alerting systems in maintaining the integrity and performance of these ecosystems. It draws on experiences and strategies implemented at Wells Fargo up to November 2023, showcasing how these practices ensure operational excellence and compliance. By examining a range of techniques, tools, and case studies, this paper provides a comprehensive guide on establishing effective monitoring frameworks that proactively identify potential issues, optimize resources, and maintain data privacy in line with regulatory standards. Continuous monitoring and alerting systems are indispensable components of modern big data ecosystems, serving as the backbone for maintaining system health and performance. This paper delves into the critical role played by these systems in ensuring the stability and efficiency of big data processing pipelines. Organizations can gain valuable insights into system behaviour, identify potential issues, and proactively mitigate risks by establishing robust monitoring mechanisms. By exploring various techniques, tools, and best practices, this paper aims to understand effective monitoring and timely alerting strategies comprehensively. Furthermore, real-world scenarios and case studies will be analyzed to offer practical insights into the challenges faced by organizations in maintaining the reliability and resilience of big data environments, along with the corresponding solutions employed to address them.
In the context of Wells Fargo’s operations up to November 2023, the importance of continuous monitoring and alerting in managing extensive big data ecosystems has never been more pronounced. With an increasing reliance on data analytics for decision-making, ensuring the seamless performance and reliability of these systems is paramount.
This paper will discuss the evolution of monitoring strategies at Wells Fargo, highlighting the bank’s approach to leveraging these systems for enhanced data integrity, system reliability, and regulatory compliance. With the exponential data growth in today’s digital landscape, organizations rely heavily on big data systems to process, analyze, and derive valuable insights [1]. However, ensuring these systems’ continuous availability, reliability, and performance could be improved. Continuous monitoring and alerting are indispensable components in the arsenal of techniques to mitigate risks and optimize the operation of big data pipelines.
Continuous monitoring plays a critical role in the efficient functioning of modern big data systems by allowing organizations to identify issues proactively before they escalate into major problems. In today’s data-driven world, where businesses rely heavily on the insights derived from vast amounts of data, any disruption or downtime in data processing can have significant repercussions. Therefore, establishing robust monitoring mechanisms is essential to maintain big data pipelines’ stability, reliability, and performance.
One of the primary benefits of continuous monitoring is its ability to detect anomalies and deviations from normal behavior in real-time [2]. Organizations can identify potential issues at their inception by continuously monitoring key metrics such as system throughput, latency, resource utilization, and error rates. This proactive approach enables IT teams to take immediate corrective actions before these issues escalate into critical problems that could disrupt operations or lead to data loss.
For example, suppose a sudden increase in data ingestion latency is detected during peak hours. In that case, it could indicate a bottleneck in the processing pipeline, potentially leading to delays in data delivery or even system downtime. With continuous monitoring, IT teams can promptly investigate the root cause of the latency spike, such as resource contention or network congestion, and implement remedial measures to restore normal operations.
Inefficient resource utilization and performance bottlenecks can significantly impact the overall efficiency of big data systems. Without continuous monitoring to identify and address these issues proactively, organizations may experience suboptimal performance, longer processing times, and increased costs associated with scaling infrastructure to compensate for inefficiencies.
Effective monitoring of big data systems requires identifying and tracking essential performance metrics to assess system health and performance effectively [3]. By monitoring key metrics such as throughput, latency, resource utilization, and error rates, organizations can gain valuable insights into their big data pipelines’ operational efficiency and reliability
Throughput is the rate at which data is processed or transferred through a system within a given time frame. It is a critical metric for assessing big data systems’ overall performance and capacity. High throughput indicates that the system can handle large volumes of data efficiently, while low throughput may signify performance bottlenecks or resource constraints.
Tracking throughput allows organizations to monitor the efficiency of data processing workflows and identify opportunities for optimization. By analyzing throughput metrics over time, IT teams can proactively adjust system configurations, scale infrastructure resources, or optimize data processing algorithms to maintain optimal performance.
Latency measures the time taken for a data request to be processed or a response to be generated within a system. In big data systems, latency directly impacts the speed and responsiveness of data processing tasks. Low latency is desirable as it ensures timely delivery of insights and enables real-time decision-making.
Monitoring latency metrics gives organizations insights into the responsiveness of their big data infrastructure and applications. By tracking latency trends and identifying spikes or anomalies, IT teams can pinpoint areas of inefficiency or contention within the system. Addressing latency issues promptly helps optimize system performance, improve user experience, and ensure timely data delivery.
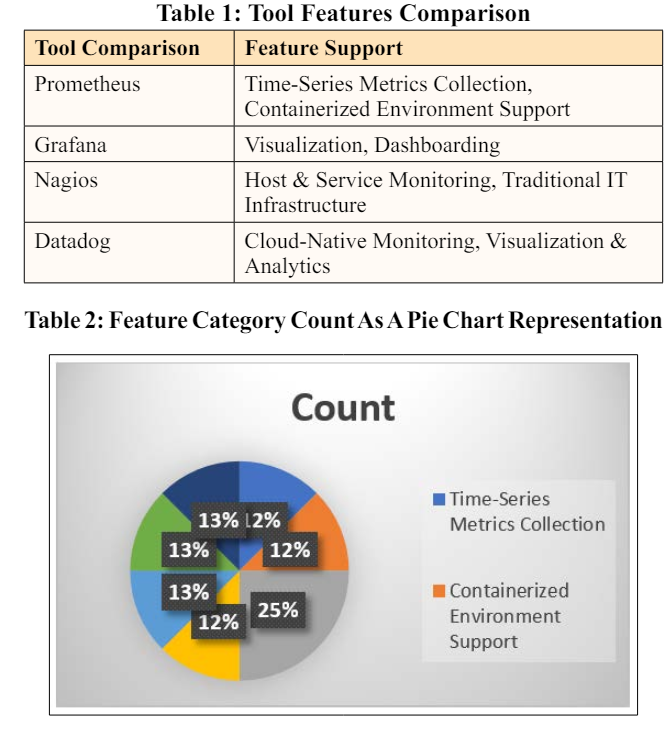
Effective monitoring is crucial for ensuring optimal performance, identifying potential issues, and maintaining system health in big data systems [4]. Several monitoring tools and technologies have emerged to address the diverse needs of organizations operating in this space. This section explores popular monitoring tools such as Prometheus, Grafana, Nagios, and Datadog, comparing and contrasting their features, capabilities, and suitability for different use cases.
Prometheus is an open-source monitoring and alerting toolkit for monitoring highly dynamic containerized environments. Using a pull-based model, it collects metrics from various targets, such as applications, services, and infrastructure components [3]. Prometheus stores collected data as time-series metrics, enabling real-time monitoring, analysis, and visualization of system performance.

Grafana is an open-source analytics and visualization platform that complements Prometheus by providing a rich set of visualization tools for creating dashboards, graphs, and alerts. Grafana integrates seamlessly with Prometheus and other data sources, allowing users to aggregate and visualize metrics from multiple sources in a unified dashboard.

Nagios is an industry-standard open-source monitoring system renowned for its robustness, scalability, and extensibility. It offers a wide range of monitoring capabilities, including host and service checks, event handling, and performance monitoring, making it suitable for monitoring diverse IT infrastructure components.
Datadog is a cloud-native monitoring and analytics platform for monitoring distributed cloud environments, microservices architectures, and modern applications. It offers comprehensive monitoring, visualization, and alerting capabilities, making it a popular choice among organizations embracing cloud-native technologies.
Alerting mechanisms are fundamental components of effective monitoring systems for big data environments [4]. They serve the critical function of notifying stakeholders about potential issues or anomalies in system performance, allowing for timely intervention and resolution. Central to the establishment of these mechanisms is the definition of thresholds for key metrics and the implementation of strategies to minimize false positives and false negatives.
Thresholds represent predefined values or ranges for key performance metrics such as throughput, latency, resource utilization, and error rates [2]. These thresholds are established based on various factors, including organizational objectives, service level agreements, and historical performance data. For instance, a threshold for latency might be set to trigger an alert if the average response time exceeds a specified limit over a defined period.
In order to ensure the effectiveness of alerting mechanisms, organizations employ strategies to minimize false positives and negatives. One approach involves conducting baseline analysis to understand typical system behaviour and establish realistic thresholds [3]. By analyzing historical data and performance trends, organizations can define thresholds that accurately reflect normal operating conditions, reducing the likelihood of false alarms.
Another strategy involves using dynamic thresholds that adapt to changing system conditions. Rather than relying on fixed thresholds, dynamic thresholding techniques continuously adjust alerting criteria based on real-time data and workload patterns. This enables the system to respond dynamically to fluctuations in performance, minimizing the risk of false alerts triggered by transient spikes or outliers.
Furthermore, organizations can implement multiple thresholds and hysteresis to enhance the robustness of alerting systems. Multiple thresholds with varying severity levels allow for the differentiation between minor fluctuations and significant deviations from normal behaviour. Hysteresis, conversely, introduces a delay or buffer between alert triggers and resets, preventing rapid oscillations between alert states in response to minor fluctuations.
Intelligent alerting systems can leverage correlation and aggregation techniques to streamline alerting and prioritize responses. By correlating events across different metrics or components, organizations can identify root causes and assess the impact of alerts on critical business processes [4]. Aggregating similar alerts into higher-level summaries helps reduce alert fatigue and improve the efficiency of incident response.
In various industries such as finance, e-commerce, and healthcare, effective monitoring and alerting strategies have proven essential in identifying and resolving issues promptly, thereby ensuring the stability and reliability of critical systems. Below are reallife examples illustrating the significance of these strategies in different sectors:
In finance, high-frequency trading (HFT) firms rely on sophisticated monitoring and alerting systems to maintain competitive advantage and minimize financial risks. For instance, a leading HFT firm implemented a real-time monitoring solution to track market data feeds, execution latency, and trading volumes [5]. By setting up alerts based on predefined thresholds for latency and trading volume, the firm could promptly detect anomalies such as sudden spikes in latency or unusual trading patterns. This enabled traders to take immediate corrective actions, such as adjusting trading algorithms or rerouting orders to alternative venues, to avoid losses and capitalize on market opportunities.
In the e-commerce sector, ensuring the availability and performance of online shopping platforms is critical for delivering a seamless customer experience and maximizing sales revenue. A major e-commerce retailer deployed a comprehensive monitoring and alerting solution to monitor website uptime, page load times, and transaction processing rates. The retailer could detect real-time performance degradation or downtime incidents by configuring alerts based on thresholds for page load times and transaction failures. This allowed IT teams to promptly investigate and address underlying issues, such as server overloads, network congestion, or software bugs, to minimize disruptions and ensure uninterrupted service for online shoppers.
Maintaining the reliability and security of electronic health record (EHR) systems in the healthcare industry is paramount for ensuring patient safety and compliance with regulatory requirements [2]. A large healthcare provider implemented a proactive monitoring and alerting system to monitor EHR system availability, data integrity, and access control events. By setting up alerts for abnormal system behaviours, such as unauthorized access attempts or database errors, the provider could promptly identify and mitigate potential security breaches or data corruption incidents. This helped prevent unauthorized access to sensitive patient information and ensured the integrity and confidentiality of healthcare data.
The Chart Visualizes the Impact of Monitoring and Alerting Strategies Across Three Key Sectors: Finance, E-Commerce and Healthcare
In each case study, effective monitoring and alerting strategies were crucial in identifying and resolving issues promptly, thereby minimizing the impact on business operations and customer satisfaction. By leveraging real-time monitoring data and proactive alerting mechanisms, organizations could detect anomalies, diagnose root causes, and initiate timely remedial actions, preventing potential financial losses, service disruptions, and security breaches.
Furthermore, implementing comprehensive monitoring and alerting solutions enabled organizations to gain actionable insights into system performance, identify areas for optimization, and drive continuous improvement. By analyzing historical monitoring data and alert trends, organizations could identify recurring patterns, address underlying issues, and implement preventive measures to mitigate future risks.
Designing robust monitoring architectures is essential for ensuring the effectiveness and reliability of continuous monitoring systems in big data environments. By following best practices and incorporating proactive maintenance, automated remediation, and continuous improvement processes, organizations can enhance the performance and resilience of their monitoring solutions.
Define Clear Objectives: Define clear monitoring objectives aligned with business goals and operational requirements. Identify key metrics, critical systems, and potential risk areas to prioritize monitoring efforts effectively
Select Appropriate Tools and Technologies: Choose monitoring tools and technologies that align with the organization’s needs and requirements. Consider scalability, flexibility, integration capabilities, and ease of use when selecting monitoring solutions.
Implement Scalable and Distributed Architectures: Design monitoring scalable and distributed architectures to accommodate growing data volumes and infrastructure complexity. Distribute monitoring agents strategically across the network to minimize overhead and ensure comprehensive coverage.
Proactive Maintenance: Prioritize proactive maintenance activities to prevent potential issues before they escalate into critical problems. Regularly review monitoring configurations, update thresholds, and optimize monitoring rules to adapt to changing system conditions and requirements.
Automated Remediation: Implement automated remediation workflows to address common issues and perform routine maintenance tasks proactively [5]. Configure automated responses to predefined alert triggers, such as restarting services, scaling resources, or reallocating workloads, to minimize manual intervention and reduce downtime.
Continuous monitoring and alerting are indispensable components of a successful big data strategy. By implementing robust monitoring mechanisms and leveraging advanced alerting systems, organizations can ensure their big data processing pipelines’ stability, reliability, and performance. As data volumes grow, investing in effective monitoring solutions becomes crucial for staying ahead of potential challenges and maximizing the value derived from big data analytics.