Author(s): <p>C Flores J, J Hernández A, E Camarillo G, D Acosta N, L Mariscal-Becerra, Salvador Carmona T, A. Speghini, M Bettinelli, Ciro Falcony<span style="font-size:10.8333px"> </span>and H Murrieta S<sup>*</sup></p>
The Yb3+-Mn2+codoped zinc metaphosphate glass gives rise to several processes such as upconversion, downshifting and double ion absorptions producing light from the visible to the IR wavelengths. These processes are possible since the Mn2+ and the Yb3+ ions replaces the Zn2+ ion in nanoparticles of the α phase of the compound Zn(PO3)2. An important result is that the α structure presence allows the formation of Yb3+-Mn2+ dimers, that gives rise to a superexchange coupling that allows an upconversion process from the IR to the red region of the electromagnetic spectrum. The experimental results also show that these dimers can couple to produce Yb3+ ion pairs that led to a cooperative emission in the green, around 500nm, coupling also the Mn2+ ions that in turn allows to produce a double absorption of this ions in the red region of the electromagnetic spectrum and as well a downshifting process conducting to the Yb3+ emission in the infrared. If the manganese ion concentration is higher than 10% most of these effects are masked. All these results make the material an effective option for different applications, due to the large wavelength variety that can be selected for excitation or emission.
As an indispensable component of full-color luminescence, the development of light emitting materials in a large wavelength scale, such as green, red and infrared cannot be ignored. On the other hand, over the years, phosphate glasses have attracted much attention because of their potential use in various devices, among them optical ones. On the other hand, glasses are very versatile materials because they can be easily doped with different types or amounts of impurities, making them attractive for a large range of applications. In particular zinc metaphosphate glasses are very interesting because they can be used as optical devices such as optical waveguides, glass-polymer composites and solid state laser sources. Phosphate glasses are relatively easy to prepare and show various interesting chemical and physical properties which make them also attractive as hosts for luminescent ions. Moreover, such glasses have been used as solders and welds between glassy and metallic parts in electronic circuits due to the similarity of their thermal expansion coefficients to that of many metals. Similarly glasses containing transition metal ions have been of special interest due to their electrical, optical and magnetic properties [1-17] that makes them suitable for many application fields such as electronics [12,13], catalysis [18,19] and magnetic information storage [16,20]. Also, there are physical and chemical properties that arise due to the presence of transition metal ions in different valence states [11,21,22].
On the other hand, the Mn2+ transition metal ion gives rise to a broad emission band in the visible range due to the spin forbidden transition 4 T1g(G) → 6 A1g(G), partially allowed by spin-orbit interaction [23-27]. This Mn2+ transition appears as a green or red emission band, depending on the ligand coordination number (CN) and/or the crystal field strength produced by the host. Usually the optical and EPR spectra of Mn2+ in zinc phosphate glasses have been interpreted in terms of an equivalent octahedral coordination of this ion [25,28]. In a recent work it has been suggested [29] that in Mn2+ doped metaphosphate Zn(PO3 ) 2 glasses the transition metal ion might act as a modifier structure due to its large ionic radii. The excitation of Mn2+ in this material produces an emission spectrum whose maxima lie in the range 515-620 nm depending on the manganese ion concentration since acts as a structure modifier, allowing CN=4 (tetrahedral) producing a green emission for low concentrations and octahedral coordination (CN=6) producing a predominant red emission for high concentrations. Also, studies by x-ray diffraction [30] of crystalline Zn(PO3 )2 have shown that in the so called α phase the Zn ions can be found in ZnO6 octahedral chains parallel to (PO3 )∞ chains. The sixfold coordination around the Zn ion is not perfect since the zinc ion is off-center in this structure.
Furthermore, the optical properties of trivalent rare-earth ions (RE3+) are very valuable when these ions are doped into materials since the electronic transitions take place within the partially filled 4f shell, or involving the 4f and 5d shells, transitions that extend over a large wavelength region. As a consequence, these ions have contributed to the development of optical amplifiers and high power lasers [31,32]. Among these optical centers, the Yb3+ ion exhibits a simple electronic structure [Xe]4f13 with a 2 F7/2 ground state and a 2 F5/2 excited state which gives rise to a broad structured absorption band between 900-1000 nm.
The main peak is at around 980 nm. On the other hand, in the latest years, with advances of high performance laser diodes with wavelength between 900 and 1100 nm, interest in Yb3+- doped materials has been increasing for applications in high-efficiency and high power diode pumped laser systems, since the Ytterbium trivalent ion is ideally suited for diode pumping since it gives rise to a broad emission band located around 970 to 1090 nm. Considering the importance of finding efficient luminescent materials for the design of optical devices based on the zinc metaphosphate composition, in the present work the luminescence of Mn2+ and Yb3+ ions, mutually sensitized, in a co-doped zinc metaphosphate glass has been analyzed by means of photoluminescence measurements and also electron microscopy techniques to have a full characterization of the material. The luminescence results pointing out an energy transfer processes between Mn2+ and Yb3+ ions as well as an Yb3+ and Mn2+ individual double excitation process. A previous work has been reported for the case of a zinc metaphosphate doubly doped glass (Ce3+, Mn2+) [33].
The molar compositions of the studied glasses were 97%Zn(PO3 ) 2 - 1%Mn(PO3 )2 -2%Yb(PO3 )3 , 96%Zn(PO3 )2 -1%Mn(PO3 )2 - 3%Yb(PO3 ) 3 and 88%Zn(PO3 ) 2 -10%Mn(PO3 ) 2 -2%Yb(PO3 ) 3 . The zinc metaphosphate glasses were prepared by mixing appropriate quantities of ZnO (Aldrich 99%), NH4 H2 PO4 (Carlo Erba RPE), MnO and Yb2 O3 (both Aldrich 99.99%) in a sintered alumina crucible, and melting the composition for 2 h at 1250 °C. The melts were quenched onto a copper plate. To obtain thermal and structural stability the glasses were annealed for additional 12 h at 350°C.
Luminescence spectra were recorded with a Perkin Elmer 650 10S and an Edinburgh Inst. M. 960S spectrophotometers and the absorption was measured with a Varian Cary 5000 spectrometer. Lifetime data of the Mn2+ emission spectra were obtained using an optical fiber to collect the emission. The signal was analyzed by means of a half-meter monochromator. A GaAs photomultiplier and a digital oscilloscope were used to measure the emission decay curves. The decay times were obtained from the emission decay curves using a deconvolution procedure which takes account of the shape and duration of the excitation pulse. Optical absorption and luminescence measurements were carried out at 12K, 15K, 18K, 77K and 300K(RT). Lifetime measurements were carried out at 10K, 65K, 150K and 300K.
Scanning Electron Microscopy (SEM) observations were performed in secondary electron images and in analytical mode respectively with a JEOL FEG SEM 7800 electron microscope. Analytical EDS information was obtained in the SEM with an Oxford instrument provided with a solid state detector. Transmission Electron Microscopy (TEM) observations in Bright Field (BF), Selected Area Electron Diffraction (SAED) and High Resolution Electron Microscopy (HREM) modes respectively, were performed with a JEOL FEG STEM 2010 microscope. For SEM observations, samples were ground in a mortar with a pestle and dispersed on a holder previously covered with an adhesive conductive carbon strip. For TEM observations the samples after grounding were dispersed in an ultrasonic bath for several minutes, then a small drop of sonicated solution was deposited in a 200 mesh copper grid covered with a holey carbon film. Analytical EDS information was obtained in the SEM with an Oxford instrument provided with a solid state detector (SSD).
Figure 1 shows the optical absorption spectra at 12K and RT of the 97Zn(PO3 ) 2 2Yb(PO3 ) 3 Mn(PO3 ) 2 glass ( from now on referred as Zn(PO3 )2 2Yb1Mn with similar notation for other concentrations); as it can be observed at low temperature three peaks can be resolved at 927nm, 962nm and 981nm respectively while at 300K they appear at 920nm and 985nm; they correspond to the transitions among the Stark multiplets of the 2 F7/2 → 2 F5/2 Yb3+ spin allowed transition; these multiplets consist of four and three sublevels respectively, according to the crystal-field theory and since the Kramers doublets components splitting is four for J = 7/2 and three for J = 5/2, the absorption spectrum therefore, should be resolved into three bands occurring from the lowest J = 7/2 Kramers doublet to the excited Kramer doublets with J = 5/2. The total crystal field splitting of the excited state is around 595 cm-1, which is comparable to the one reported by Legendziewicsz et al. for crystalline double phosphates [34]. At RT around the region of 950-960nm the central transition barely appears, and this may be due to the fact that the corresponding transitions between the different sublevels are under the broad bands produced by the inhomogeneous broadening must probably due to different neighborhoods of the emitting centers. The spectra for the other concentrations are not shown for brevity since they are very similar to the one presented in this figure. Similar spectra have been previously reported [34] and the full splitting has been assigned to low symmetry emitting centers.
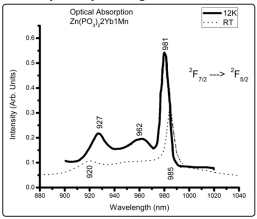
Figure 1: Absorption Spectra of Trivalent Ytterbium Ion at Low and High Temperature (RT)
The Yb3+ emission spectra for the three concentrations of the dopants are shown in Fig. 2. Two discernible peaks at 976nm and 1012nm over the whole emission range can be observed and might be attributed to the Stark splitting of both 2 F7/2 and 2 F5/2 Yb3+ states. It should be noticed that as the Mn2+ concentration increases from 1 to 10 for a fixed Yb3+ concentration (2%) the emission intensity of the last ion also increases.
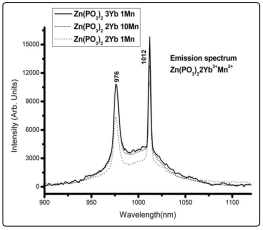
Figure 2: Emission Spectra at Room Temperature of the Different Studied Samples under YAG: Nd Third Harmonic Laser Excitation
It is worth to notice that this behavior, as will be discussed below, points out to an energy transfer process between Mn2+ and Yb3+. Figure 3 shows, as an example, the room temperature absorption spectrum for wavelengths from 300nm to 1200nm in the case of the Zn(PO3 )2 2Yb1Mn sample, the spectra being similar for the other concentrations. As can be seen the sample presents not only the absorption of the ytterbium ion but it also shows the manganese ion absorption, indicating that both impurities were successfully incorporated into the glasses.
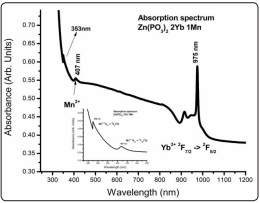
Figure 3: Absorption Spectrum Showing That Both Impurities Were Successfully Incorporated In the Metaphosphate Compound
This spectrum corresponds to the Zn(PO3 ) 2 2Yb1Mn sample. Other Yb3+, Mn2+ concentrations present similar spectra. The inset shows more clearly the divalent manganese transitions from the ground state to other excited states. This amplified spectrum shows a peak around 350nm that also appears in the excitation spectrum. The inset in fig. 3 shows the Mn2+ ion absorption spectrum for the very same sample but at 12K where some of the transitions can be seen with a better resolution. Bingham et al [35] studied various manganese doped phosphates and silicate glasses (3Na2 O7P2 O5 , 3K2 O7P2 O5 , CaO7P2 O5 , 3Na2O7SiO2 , 3Na2 O7SiO2 ) being our results similar for the absorption bands. According to Bingham et al. the Mn2+ ion can be located with a sixfold (phosphates) and fourfold (silicates) ligand coordination in these glasses, pointing to different symmetries that give rise to a green or a red absorption band, respectively. They obtained values for Dq (crystal field strength) and Racah parameters for the different phosphates they studied, from which an average value for the Racah parameter B can be obtained as <680> cm-1 and using the Tanabe-Sugano diagrams for Mn2+ ion the strength of the crystal field, for the present case, can be obtained as Dq ≈ 542 cm-1. Also, the ratio between the Racahs parameter of phosphates average value and the free ion value (950 cm-1, used in ref. 35) can be obtained as β ≈ 0.716, which represents the degree of covalency of the manganese ion in the present compounds (the so called nephelauxetic effect). This result of about 70% of the free ion value represents a reduction of the Mn2+ interelectronic repulsion energy due to covalency effects, pointing then to a high degree of covalency in the bond between the Mn2+ ion and the phosphate groups [36]. The feature appearing at about 350nm also appears in the excitation spectra, as will be shown later.
Fig. 4 shows the low temperature (77K) divalent manganese ion emission spectra for the sample Zn(PO3 ) 2 2Yb3 +1Mn2+, the typical main emission being around 600nm. As can be seen several excited states can be reached. It is known that the Mn2+ ion emission comes from the 4 T1g electronic excited state towards the 6 A1g ground state, using the conventional crystal field theory notation, and when other electronic states are excited there are relaxation processes towards the 4 T1g emitting state. As can be seen in Fig. 4 when the 4 Eg ( 4 D) state is excited there is a red shift in the emission as the excitation wavelength is increased; this fact might be simply due to the presence of at least two different ligand configurations, which might be produced by different near neighbors distances, producing different interacting fields. The energy states associated to the electronic 4 G term present a small blue shift as the excitation wavelength is increased, again probably due to different ligand configurations (according to Tanabe-Sugano the ligand field interaction matrices for the 4 D and 4 G states include different matrix elements). The RT spectra present a similar behavior (the spectra are not presented by brevity). Also, it can be noticed the presence of another broad emission band around 500 nm, which is more visible when the excitation occurs at 420nm. This emission band might be associated to possible Yb3+/Mn2+ interactions, as will be discussed later. As has already been mentioned, according to Bingham et al [35] et al these results show that the Mn2+ ion can be found with sixfold coordination, and most probably with different ligand distances. The sixfold coordination results can be confirmed by the experimental results about the typical Mn2+ emission around 600nm (shown in Fig. 4) for this compound.
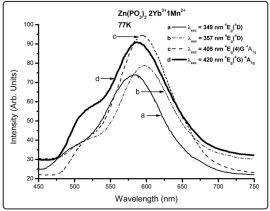
Figure 4: Low Temperature Emission Spectra of Mn2+ for Different Excitation Wavelengths. It Should Be Noticed the Shoulder Present Around 500nm in All Cases, But With A Predominant Emission in the Red Region Wavelength, Typical Of an Octahedral Environment.
Today the process of energy upconversion [37-46] is a phenomenon well known i.e. when a near-infrared photon to green/red photon energy conversion takes place, for example in Mn2+ and Yb3+ codoped lattices. In this case Yb3+ excitation in the nearinfrared around 1 µm leads to a mainly red Mn2+ luminescence according to the manganese ion ligand coordination (six). It has been stablished that the upconversion process can take place through several mechanisms: (a) ground state absorption (GSA) to an intermediate level, followed by an absorption from this level (excited state, ESA) usually involving just one ion. (b) GSA/ ETU (ETU, Energy Transfer Upconversion), usually involving two ions excited simultaneously, followed by the emission and energy transfer between them. (C) Cooperative sensitization exciting simultaneously two ions from the ground state in such a way that the sum of their emission energy can be transferred to a third ion (the sensitizer one, which does not have an energy level close to those of the excited ions). (d) Cooperative energy transfer in which a donor is excited transferring its energy to an acceptor ion which simultaneously absorbs another photon from which the emission occurs as an upconversion. (e) GSA/ESAExchange in ions coupled through an exchange mechanism. This process involves coupled ions (dimers) formed by the excited ion and the emitting ion.
In Figure 5a it is shown the room temperature upconversion process, for all studied concentrations, observed through the Mn2+ emission spectra, by exciting the Yb3+ion. It can be noticed that all samples present again a shoulder around 500nm. On the other hand, as the Yb3+ ion concentration increases the intensity of the upconversion process also increases as well when the Mn2+ ion concentration increases. Then, as the ion concentration increases a substantial energy upconversion between them can take place and it should be remembered that this energy transfer rate must strongly depend on the distance between them. Before discussing the possible upconversion mechanism other experimental results will be presented.
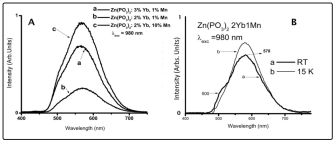
Figure 5: (A) Upconversion Spectra at Room Temperature for the Different Concentrations of Divalent Manganese and Trivalent Ytterbium Ions. (B) Shows Mn2+ Ion Emission Spectra, at Room Temperature (RT) and 15K, under Yb3+ Excitation
Figure 5b presents Mn2+ ion emission spectra, at room temperature (RT) and 15K, under Yb3+ excitation for the sample Zn(PO3 )2 2Yb1Mn. As can be seen the low temperature spectra presents a quenching of the green 500nm emission. The Zn(PO3 )2 3Yb1Mn and Zn(PO3 )2 2Yb10Mn samples present the same characteristics at low temperature. One can easily think that this quenching might be associated to the fact that the energy of the emitting manganese ion level 4 T1 depends on the crystal field strength [47], the 10Dq value determines the emission in green or red, and that the low temperature produces a lattice contraction increasing then the crystal field strength, shifting the emission to the red wavelength, in agreement with the Tanabe-Sugano energy diagrams. But this effect might be really related to Mn2+- Yb3+ interactions as will be discussed below.
The Zn(PO3 ) 2 :xYb3+:yMn2+: codoped glasses present the upconversion phenomenon without a doubt, as shown in figure 5a, when the divalent manganese and the trivalent ytterbium ions can interact for example forming dimers in this material and mixing their energy levels, involving in turn a sequence of ground-state absorption (GSA) and excited-state absorption (ESA) steps among the dimers mixed states. Certainly, the host is a glass, but the following results can also be interpreted in terms of dimers with a particular structure as will be discussed below
Figure 6a shows the inverse process. In this case the Mn2+ion is directly excited observing its typical emission around the red but it is also possible to observe the Yb3+emission around 1000nm, that might be interpreted as a downshifting process [48], possible due to an Yb3+ and Mn2+ energy levels mixing. This in turn imply that both ions are forming dimers. Fig. 6a shows the typical RT manganese red emission by exciting at 360 nm, while Fig. 6b shows the corresponding infrared ytterbium emission, also at RT, when exciting the manganese ion at this wavelength. Figure 6 corresponds to the Zn(PO3 )2 3Yb1Mn sample being the spectra for other concentrations similar and not shown by brevity. However, it is important to notice that the shoulder around 500nm is also present in the manganese emission. However, it should be remembered that these spectra, the manganese and the ytterbium emissions, can also be observed at 15K but the emission shoulder at 500nm is not observed at this temperature similarly to Fig. 5b. This might imply the presence of dimers.
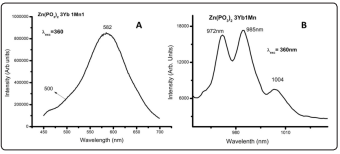
Figure 6: (A) Mn2+Ion Directly Excited Allows the Observation of Its Typical Emission around the Red but It Is Also Possible to Observe the Yb3+Emission Around 1000nm. (B) Shows the Yb3+Emission around 1000nm Due To the Mn2+ Excitation Process
Figure 7 represents the processes of upconversion and downshifting in terms of the mixed energy levels of both ions, due to an exchange coupling as has been proposed before. Acknowledgement is given to authors of references [37-40].
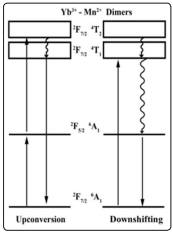
Figure 7: Representing the Yb3+ and Mn2+ Energy Levels Mixing In a Dimer State.
The formation of Yb3+ - Yb3+ ion-dimers [44-46,48] can lead to a cooperative process where two adjacent Yb3+ ions forming a dimer can emit or absorb collectively. In the first case, two Yb3+ ions excited simultaneously around 1-µm can emit a photon with double energy (in the 0.5-µm region, in the green region); in the second case an Yb3+ - Yb3+ dimer might absorb in the visible.
As has been previously discussed the Mn2+ emission spectra always show a shoulder in the region around 500nm, also beforehand it has also been mentioned that the Mn2+ and Yb3+ impurities might be forming dimers with a mixing of energy levels allowing the upconversion and downshifting processes. Under these conditions, if the ytterbium impurities are also forming a dimer, it is possible to observe the Yb3+ cooperative emission just in the green region, if the ytterbium ions are close enough. It has been previously shown [29] that in Mn2+ only doped Zn(PO3 )2 , the Mn2+ emission spectra do not present this feature at 500nm. Fig. 5b shows that for an excitation of the Yb3+ ion at 980nm at RT a superposition of two emission bands can be observed, one at 578nm and another at around 500nm, being the last one just the corresponding cooperative Yb3+ dimers emission. The same figure also shows that this is a phonon assisted process since it does not appear at 15K.
On the other hand, the downshift process also allows the ytterbium cooperative emission, as can be seen in Fig. 6a. This emission band can be fitted with 3 gaussian bands, whose maxima can be located at 503nm, a second one at 587nm and a third one at 656nm. It can be mentioned that similar fittings are possible for the emission bands corresponding to the other concentrations. But there is also an excitation wavelength dependence, by exciting for example with 340nm the emission spectrum can be fitted with 3 gaussian curves with maxima at 494nm, 555nm and 658nm, other excitation wavelengths produce gauss curves with the first one in between 494nm and 503nm. This variation might be simply due to coupled dimers located in octahedral surroundings with slightly different small distortions. From these results, it is evident that the green band cooperative emission is strongly dependent on the excitation wavelength
These results allow to propose a structure model as follows: the manganese and the ytterbium ions replacing the Zn ions in two contiguous octahedra [according to the structure given in ref. 30] (probably distorted) forming a dimer which is next neighbour to another dimer, as illustrated in Fig. 8.
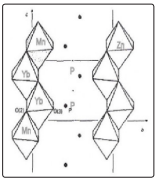
Figure 8: Zn(PO3 ) 2 Structure Showing The Possible Dimer Structure. (The Octahedral ZnO6 Basic Structure After Ref. 30).
In this way there might be two Yb3+ ions nearby to produce the conjugation of their emitted photons as a visible photon around 500nm. Also, this structure allows the upconversion and downshifting processes already mentioned. In order to sustain this model electron microscopy studies were performed. The results show the presence of nanostructures of the phase of the zinc phosphate compound, results consistent with the proposed model. Figure 9 shows a low magnification SEM micrograph of a softly ground sample. Faceted big grains suggest the crystalline nature of the Zn(PO3 )2 2Yb1Mn sample. Figure 9 shows a typical SEM micrograph of a softly ground sample, grains with different sizes are displayed.
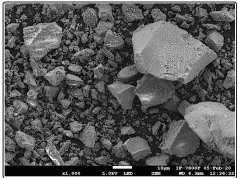
Figure 9: In This Typical SEM Micrograph of a Softly Ground Sample, Grains with Different Sizes Are Displayed
Figure 10 represents a typical bright field TEM micrograph of the Zn(PO3 ) 2 2Yb1Mn sample, showing laminates with supported nano grains or nanostructures with different shapes and sizes. In the inset in upper right corner, white small spots corresponds to holes indicating that our samples are very sensitive to electron irradiation.
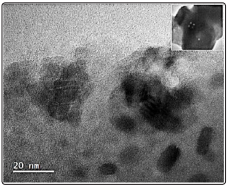
Figure 10: A Bright Field TEM Micrograph Showing The Presence of Zn(PO3)2 Nanostructures with Different Shapes and Sizes Respectively
Figure 11 HREM micrograph shows a compact cluster of nano grains. Grain boundaries, like the one marked with a thin white arrow are observed. Coalescence of grains are indicated under number 1 and 2; the thick arrow indicates a typical coalescence neck between two grains. In the upper left inset an optical diffractogram from grain number 1 is displayed, the reflections seen corresponding to α Zn(PO3 )2 phase (30). Important result since it proves the presence of nanoparticles with the Zn(PO3 )2 structure. Other samples show the same behaviour. Optical diffractometry analysis performed with the Digital Micrograph computing program in zones like the one marked with number 1 in the micrograph, let us find coincidences with interplanar lattice distances corresponding to the α phase in our zinc phosphate glasses (zinc phosphate compounds displayed in PDF cards 030-1488 and 01- 076-162900 respectively).
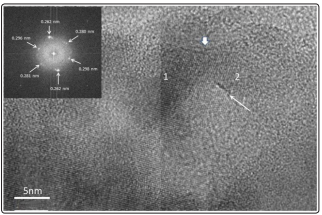
Figure 11: HREM Micrograph Showing the Presence of Zn(PO3 ) 2 Nanostructures Corresponding To α Phase of This Compound
EDS results are displayed in figure 12; the spectra and the corresponding quantification tables are presented. It can be appreciated that all the elements forming the doped zinc metaphosphate glass are present. It can also be noticed the presence of Silicon, due to the sample Silicon holder, as small peaks.
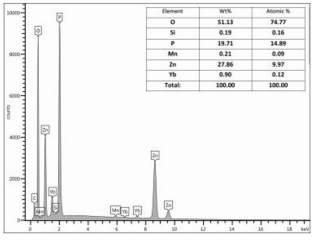
Figure 12: Shows The EDS Results. In The Upper Right A Table Showing The Elements Composition Is Given. As Can Be Seen All the Elements Composing the Sample Are Present
The Electron Microscopy results show that there are nanoparticles of Zn(PO3 )2 : xMn: yYb composition. According to AverbuchPouchot et. al. [30] the crystal structure of this compound is made of long chains polyphosphates Zn(PO3 ) 2 as shown in Fig. 8. They mention that there are ZnO6 octahedra differing in the size and angles between the Zn2+ and O2+ ions, which might produce different interacting crystal fields. These resultant nanoparticles with the structure shown in Fig. 8 then proves the proposed structure model to explain all the experimental results mentioned before about upconversion, downshifting and double absorption of neighbouring Yb3+ ions.
Another interesting result about this system is the fact that it can be efficiently excited with the Mn2+ second harmonic wavelengths around 310nm, which also could be thought as a double Mn2+ absorption, since there are not manganese ion energy levels with wavelengths around 620nm. On the other hand, there must be a Mn2+ → Yb3+ energy transfer as a downshifting process, as with the excitation with 320nm, producing the Yb3+ emission. The result is shown in Fig. 13 This is an interesting result because it gives a broad wavelength range to excite the system giving light from the green-red to the infrared wavelengths.
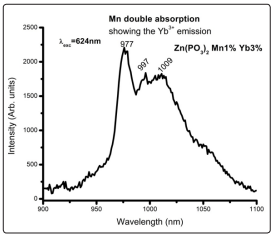
Figure 13: The excitation of Mn2+ with the Second Harmonic Of The 310nm Absorption Wavelength Also Produces a Downshifting Process Allowing to Observe Also the Yb3+ Emission in the Infrared
Finally, the manganese emission lifetimes were measured as a function of the temperature for the Zn(PO3 )2 2Yb 1Mn sample. The results are shown in table 1.
Table 1: Divalent manganese ion lifetime measurements from 10K to 300K
| Table I Temp. (K) τ (msec) 10 18.9 65 18.1 150 16.9 300 11.0 |
The lifetime measured at 10K for the sample containing Mn2+ 10% was 32ms; in this case, for this type of sample, due to the large amount of Mn2+ ions, there must be just less Mn2+ - Yb3+ dimers, being then the lifetime result larger since a large amount of manganese ions must be isolated, showing the typical lifetime for isolated manganese ions [49].
The Mn-Yb codoped zinc meta-phosphate glass (Zn(PO3 )2 ) is a very versatile system since it allows upconversion, shiftdown and double absorption processes, giving light from the UV to the IR wavelengths. The Mn2+ and the Yb3+ ions enter replacing the Zn2+ ion sites in nanoparticles of the α phase of this compound, with an octahedral coordination most probably distorted by the ion sizes differences, giving rise to wide emission bands. An important consequence is that they tend to form dimers, which allows a superexchange coupling that gives rise to an upconversion process from the IR to the red region of the electromagnetic spectrum. Also, the Mn2+ ion excitation produces a downshifting process with the Yb3+ ion emission in the infrared wavelength. The experimental results show that these dimers also couple to produce Yb3+ ion pairs that led to a cooperative Yb3+ emission in the green, around 500nm, coupling also the Mn2+ ions to produce a double absorption, around 620nm that produces a downshifting process with the resulting Yb3+ emission around 1000nm. If the manganese ion concentration is larger than 10% most of these effects are masked. All these results make the material a very effective one for different applications due to the large wavelength variety that can be selected for excitation as well as for emission. The presence of nanocrystals in the metaphosphate glasses under investigation might be due to the clustering of the two impurities of different valence and/or size with respect to the divalent Zn ions. Now we are performing new studies in this direction.
We acknowledge the technical support of Dr. Carlos Magaña and Ms Sc. Roberto Hernández in electron microscopy work and Ing. Z. Rivera for help in optical work.