Author(s): WANG Shaojie and XIANG Fujun*
The match formation is the football player’s position arrangement on the field, the attacking and defending strength collocation and the duty division form. It is the match tactics important constituent. This study took the three most commonly used match formations (4-5-1, 4-4-2, 3-5-2) of the 2018 FIFA World Cup as independent variables and the running performance index as dependent variables, aiming to explore the influence of different match formations on the running performance of players in the team as a whole and at various positions. The research results showed that :1. Teams in 4-5-1 and 3-5-2 formations completed more sprints than teams in 4-4-2 formations. 2.3-5-2 Centre-backs needs to complete more intense runs and sprints, as well as more sprints, than a 4-4-2 Centre-backs. Wide positions in a 4-5-1 formation complete more intense runs and sprints, as well as more sprints, than those in a 4-4-2 formation. The Centre midfielders of 4-5-1 and 3-5-2 get more sprints than 4-4-2; Strikers in a 4-5-1 formation showed a more marked decrease in the intensity of running distance, sprints and sprints in the second half than those in a 4-4-2 formation. 3.The 3-5-2 Centre-backs have a significantly higher proportion of half-court activity than 4-5-1 and 4-4-2, and a significantly higher proportion of running time than 4-5-1; In 4-5-1 and 3-5-2 formations, the Centralmidfielders running time proportion in half court and attacking three zones is significantly higher than that in 4-4-2 formation. Therefore, when each team conducts daily training, it should take into account the different physical needs of different teams and players in different formations and positions.
The match formation of the football team on the field is a position arrangement model that reflects the division of duties of the players in each position and the combination of attack and defense forces [1]. With the development of modern football, the match formation of football changes constantly. To meet change of formation, it requires players to continuously improve their tactical awareness and running ability. Scientific training is an inevitable trend in the development of competitive sports. To master the load characteristics of events accurately is a prerequisite for scientific training and a logical starting point for effectively improving competitive level [2, 3]. In football, the performance of a player’s running is an important part of the match load, which reflects the player’s physical condition and the match effort. It is an important part of the coach’s analysis and evaluation of the player’s match performance. Moreover, it is the starting point and end point of training content and load design. Therefore, the research on the performance of running is an important research direction in the field of football performance analysis [4, 5]. Correspondingly, this sudy takes the 2018 FIFA World Cup Russia as the research object, and analyzes the relationship between the match formation and the running performance of the team and the players in each position, aiming to help coaches and football practitioners better understand the physical requirements of different game formations for players, and provide a theoretical basis for coaches to deploy game formations and formulate targeted physical training.
The comprehensive level of the team being high is one of the outstanding characteristics of modern football matches. To win the game, the team stresses the combination of attack and defense forces and relies on the group attack. Therefore, the individual and the team’s technical and tactical ability essentially affects the result of the competition [6]. When arranging the team formation, it is important to make analysis according to circumstances and avoid rigidly adhering to the fixed formation. According to the characteristics of the opponent’s players, the opponent’s game style and competition level, the formation can be flexibly changed, so as to optimize the combination of the players and enhance the teamwork ability and the overall competitiveness of the team [7]. Game style is the playing characteristic that the team adopts in the game. This characteristic will be repeated regularly in a certain special situation. Therefore, the value of the measure index that reflects the game style, such as player-ball movement and player-player interaction, will be relatively stable [8]. The physical performance of players is an important factor in team dynamic performance and tactical performance [9]. Different game formations show different game strategies and tactics. The choice of game strategies and tactics will directly affect the athletes’ running situation in the race [10]. Different formations used by opponents in a match can affect the movement of players. For example, if the other side adopts a 4-4-2 formation, players run farther in a 4-4-2 formation than in a 4-2-3-1 formation [11].
However, the difference of high intensity running distance between different formations is not definite, only relative differences appear in different positions. The analysis of the performance of the game formation is also affected by factors such as the coaches’ adjustments to the formation during the game and frequent shifts between players [12].
Running is the basic activity ability of players in football matches, and it is the basis and guarantee for the performance of technical and tactical levels. The tactics system is an organic whole composed of individuals, and there is a certain order and rhythm in the connection between them. Therefore, running is not only determined by the responsibilities and requirements of the competition, its running effect and efficiency are also restricted by individual ability, which in turn affects the running distance and running intensity [3]. At the same time, the performance of running is also affected by the situation variables such as: the location of the match (home/away); the score (leading/falling/ deadlocked), the result (winning/tying/losing), the quality of the opponent (weak/strong), temperature, altitude, and distance all significantly affect the performance of the team and the players during the game [13-20]. In the football match, a player must run about 9.6-13.5 km, among which the distance of high intensity running is about 650-700m, sprints range from about 152 to 446m [21]. High-intensity running will decrease after the most intense stage of the race and when the race is about to end [22]. In addition, the running of the players in the match showed obvious positional characteristics: the running distance of the centre-back and the forward was the shortest (< 10km), followed by the fullback and the full-back (10.1 km ~ 10.6 km), and the most running distance was the centre-half (about 10.8 km). The characteristics of running distance and intensity of players in the same position in the major leagues of the world are basically the same, but the distance between total running distance and high-intensity running distance is an important reason that affects the level of the league [3].
Measuring the physical performance of the same player in different positions within the same team formation gives us a better understanding of the actual requirements between different lines [23]. The football training programme should be based on the specific requirements of the match position to allow players to better perform tactical tasks in the game [24]. Automatic trajectory tracking by computer is the main research method of modern football match load. Through automatic tracking technology of match, the data of running distance and speed of players are automatically collected. As the model can be built by big data, the general characteristics of each speed level in race running can be analyzed and the running load intensity model and load quantity model of different positions can be established [25]. A detailed understanding of the precise requirements for execution of formation and position in the game will help to carry out targeted training on the training ground. There are a lot of valuable previous research on the running performance. Some scholars have put forward that as a technical and tactical leading sport, the running of the players in the game should serve for the tactical play. Therefore, in the analysis of running performance, tactical factors should be taken into account [26, 27]. The game formation is an important part of the game tactics, which is the arrangement of players’ position, the collocation of attack and Defense Forces and the division of duties. Therefore, it is of practical significance to explore the effects of different formations on the running performance of teams and players, which can help head coaches, physical coaches and sports scientists better understand the characteristics of different formations, further for the team and players to design more personalized physical training program. Looking at the current research, the research results in this area are still relatively deficient.
Based on the analysis of the relationship between the match formation and the running performance of the team and players in different positions, this study takes the 2018 FIFA World Cup in Russia as the research object. The purpose of this paper is to help the coaches and football professionals to better understand the physical demands of players in different match formations, and to provide theoretical basis for the coaches to deploy match formations and formulate the specific physical training.
Samples and Variables The sample consists of data on the running performance of all players in 64 matches of the 2018 World Cup in Russia. The data comes from match reports on FIFA’s official website. The data is provided by STATS and has been widely used by scholars both at home and abroad to conduct research on various sports events [18, 21, 28, 29]. The reliability and accuracy of the data have been verified by relevant studies [23, 30].
The study variables included: each team’s game formation, each team and each player’s running performance in the game. In this paper, the match formation is regarded as an independent variable, and the running performance of the team and the players is regarded as a dependent variable.
Drawing from the predecessors’ method of dividing the game formation, the 4-2-3-1(4-5-1) and 4-3-2-1(4-3-3) are classified as 4-5-1 formation, and 3-5-2 and 5-3-2 as 3-5-2 formation [31]. According to the match formation used by 32 teams in 64 matches, the three most frequently used match formations (N = 114) in this World Cup are selected: 3-5-2(N = 12), 4-4-2(N = 18) and 4-51(N = 84). As for the analysis of the match position, the full-court players are selected as the research object (N = 930), the positions of players are divided according to the main areas covered in the game: centre-back (N = 267), full-back/wing halfback/wing-back (N = 339), centre-half (N = 241) and striker (N = 83). There are three reasons to analyze the full-back, the wing halfback and the wing-back as a unified match position: ?the activity area of the three positions is quite similar, they are all the side areas; ?research shows that, there was no significant difference in the running performance between the full back and the wing halfback; ?it facilitates the comparative analysis of players in the same position among formations.
Based on the availability of data and reference to previous research indicators [13, 27, 32], the running performance of teams and players in competition is divided into three categories:
First of all, this paper makes descriptive statistical analysis on the running performance of teams in different match formations and the running performance of players in the same match position in different match formations. The results are presented in the form of X±SD.
Secondly, ANOVA is used to compare the difference of running performance between different formations and the difference of running performance of the same position players in different formations. 12 indexes which reflect running performance are firstly tested by Levene variance homogeneity test, and then all indexes are analyzed by ANOVA. lDS (L) method or Dunnett’s T3 method is used to compare each index.
Excel 2016 is used to arrange the running performance data of the game, and SPSS 24.0 is used to calculate the ANOVA. P < 0.05 was defined as significant difference.
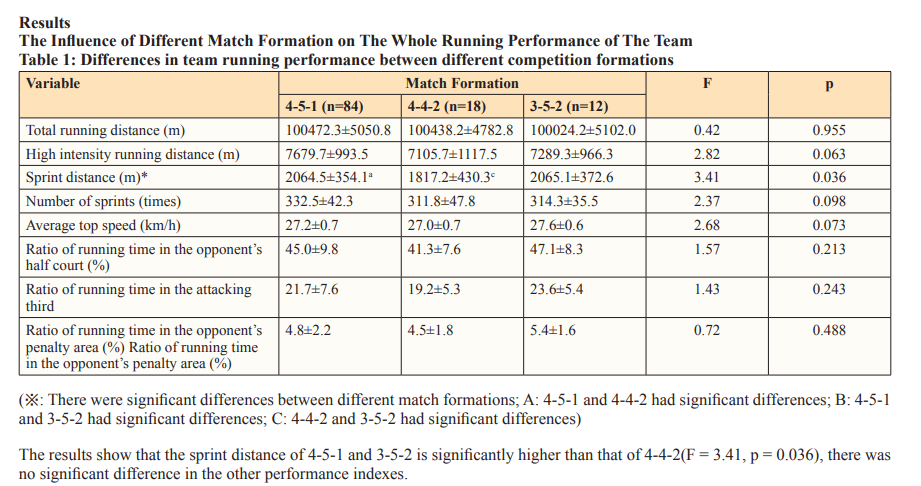
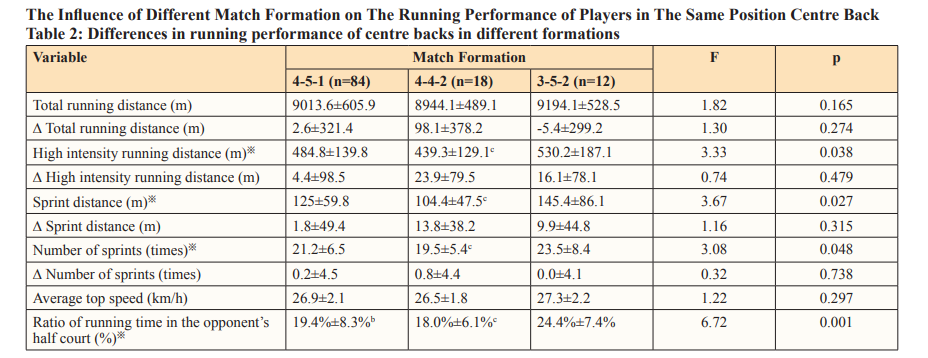
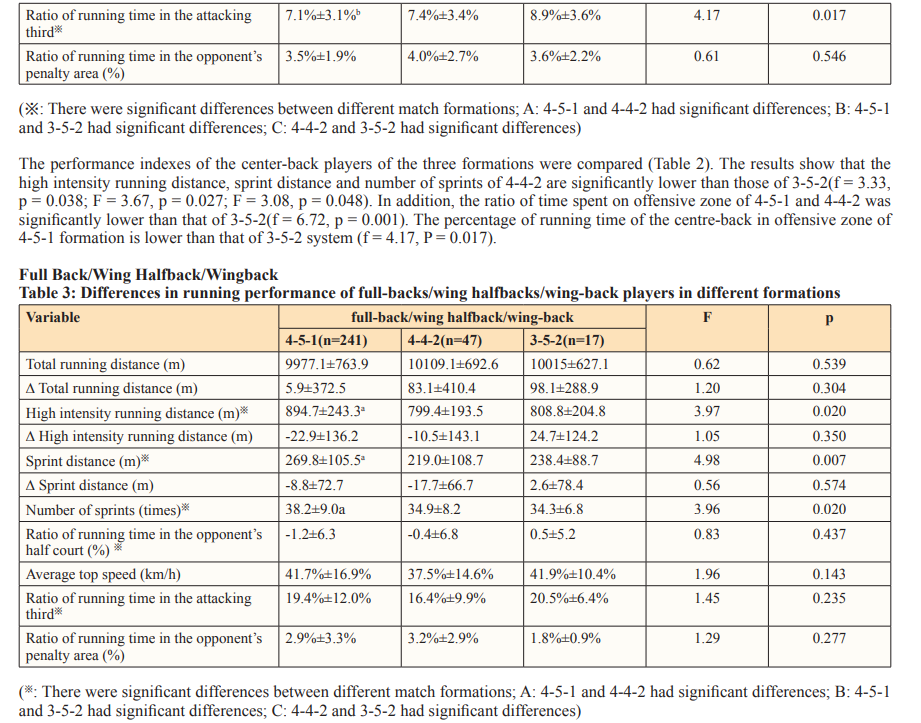

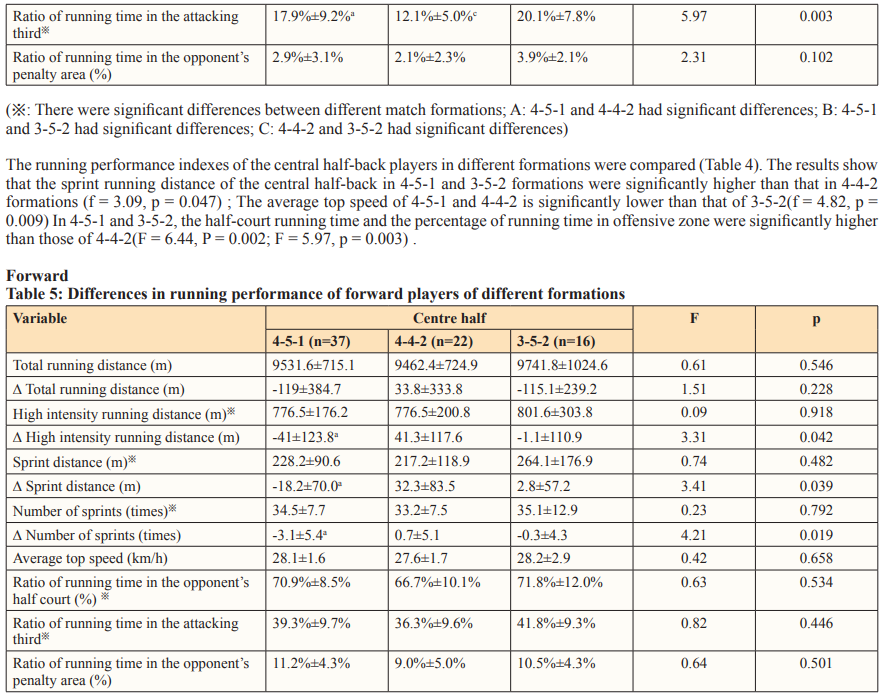
There were significant differences between different match formations; A: 4-5-1 and 4-4-2 had significant differences; B: 4-5-1 and 3-5-2 had significant differences; C: 4-4-2 and 3-5-2 had significant differences
The running performance of forwards in different formations was compared (table 5), the results show that the 4-5-1 formation has significantly lower Δ high intensity running distance, Δ sprint distance and Δnumber of sprints than that of the 4-4-2 formation (f = 3.31, p = 0.042; F = 3.41, p = 0.039; F = 4.21, p = 0.019).
For the demands of competition, this study defines the relationship between the common match formation (4-5-1,4-4-2,3-5-2) and the indexes of running performance in 2018 FIFA World Cup. This paper makes a deep analysis on the difference of the running performance of the teams in different match formations and the difference of the running performance of the players in different positions in different match formations. The purpose of this paper is to to examine the physical requirements of teams and players in different positions in different game formations, and to provide a more in-depth understanding of the running performance in matches.
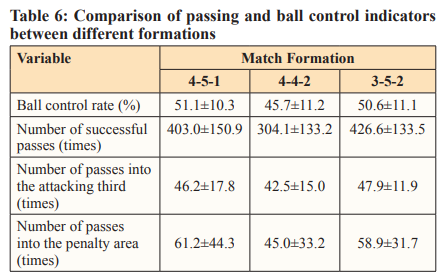
The study showed that 4-5-1 and 3-5-2 teams in the 2018 FIFA World Cup had significantly higher sprint distances than those in the 4-4-2 formation. Compared with the previous results, there are some differences. Some scholars have studied the three formations (4-4-2,4-3-3,4-5-1) in the Premier League and found that the lowspeed running distance (7.2 km/h < V < 14.3 km/h) of 4-4-2,4-3-3 and 4-5-1 is significantly higher than that of 4-5-1, there is no significant difference in the other indexes, which shows that the match formation does not affect the running performance of the whole team [33]. Other studies have shown that the total running distance and high intensity running distance (V ≥19.8 km/h) of 4-4-2 and 4-5-1 formations are significantly lower than those of 3-5-2 formations, which indicates that 3-5-2 formation is the most physically demanding competitive formation [34]. However, there are also research results that do not support this view: 4-51 formation requires more high-intensity runs and sprint runs than 3-5-2 formation, and other indicators are not significantly different [31]. It can be seen that the results of different reports are not consistent, which may be due to the fact that the running performance of the team is affected by many factors and fluctuates greatly [35]. On the other hand, there are some differences in the sample size, the level of competition and the understanding of the formation division of different studies, which leads to the diversity of the research results. This research selects the world’s highest-level national team competition as the research object, therefore, the result has the certain representativeness. In addition, this study found that players in the 4-4-2 formation spend less timing running in the opponents’ half-court, attacking third and the opponents’ penalty area than those in the 4-5-1 and 3-5-2 formation. Therefore, it is inferred that the 4-4-2 formation prefers the Direct play, which is confirmed by the statistics of the technical and tactical indexes related to passing and ball control. As can be seen from Table 6, the 4-4-2 formation has lower ball control rate, successful pass times, three-zone pass times and penalty-zone pass times than the 4-5-1 and 3-5-2 formations. The latest research shows that, compared with Possession Play, the Direct Play has more time to focus on the overall defense of slow running, and while attacking, it needs to finish a lot of fast forward and other tactical behaviors, but there are fewer players on the attack, so the overall performance is that the team will run fewer sprints and higher intensity runs, resulting in less sprinting distance in a 4-4-2 formation [36].
The centre back plays a very important tactical role as the defender of the last line of defence [37]. The results show that the high intensity running distance, sprint distance and sprint times of 3-5-2 are significantly higher than those of 4-4-2. This may be due in part to the fact that the centre back system has a larger per capita coverage than the back four system and requires more rapid recovery and blocking [31]; on the other hand, in terms of the proportion of time spent running in different areas, in the 3-5-2 formation, centre backs in the opposing half-court and the attacking three-zone were significantly higher than those in the 4-4-2 formation, which indicated that the 3-5-2 centre-backs have a wider running range and participate in more offensive behaviors in the match, leading to more intense running.
Wide players (full-backs/wing halfbacks/wing-backs) play mainly in the wide area, where the density of players is relatively low, so they have more chances to complete high-intensity runs and sprints than players in other positions [38]. The results of this study show that the high intensity running distance, sprint distance and sprint times of 4-5-1 are significantly higher than those of 4-4-2. This may be the 4-4-2 formation has been arranged in the front two forward players, four wide players in the game to participate in the attack. Compared with the 4-5-1 formation, there is less highintensity running. Research on the Chinese Super League matches also confirmed the conclusion above. Regardless of whether it is a full-back or a wing-back, the high-intensity running and sprint distances of the 4-5-1 formation when in control of the ball are significantly higher than that of the 4-4-2 formation. When the opponent is in control of the ball, the high-intensity running and sprint distances of the 4-5-1 formation are significantly lower than that of the 4-4-2 formation, indicating that the 4-4-2 formation’s wide players undertake more defensive tasks than offensive task [39]. In addition, the 3-5-2 wing-backs, with one player covering the entire wide area, may in theory need to perform more highintensity runs. However, this study and previous studies have found that there is no significant difference between their running performance and that of other formations [31].
The centre halfback is the pivot of the attack and defense of the team, taking on the dual task of attack and defense in the game. The centre halfback’s activities cover a large area, and the total running distance is generally higher than that of other players [40]. In the 4-4-2 formation, the running distance of the centre halfback is significantly lower than that of the 4-5-1 and 3-5-2 formations, and the average top speed of the centre halfbacks in the 4-4-2 and 4-5-1 formations is significantly lower than that of the 3-5-2 formations. The two-centre-half system covers less midfield area than the three-centre-half system. This may be due to the relatively small number of midfielders. As the midfield area tends to be empty during the transition from attack to defence, the coach will specifically arrange for the two central halfbacks to reduce the number of forward thrusts in attack. It can also be seen from the running performance in different court areas that in 4-4-2 formation, the proportion of half-court running time and attacking third area running time is significantly lower than that of 4-5-1 and 3-5-2 formation.
The forward is at the head of the formation, the main force of the team’s attack, and is responsible for tearing down the defence, capturing chances in front of the goal and scoring goals [3]. Among the different formations, the 4-5-1 forwards’Δ high intensity running distance, Δ sprint distance and Δ sprint times are significantly lower than those of the 4-4-2 formation. This may be due to the fact that the single forwards often have to face the defense of two central defenders. Forwards may need to spend more energy to get out of the defensive line, resulting in a significant drop in high intensity running, sprint distance, and number of sprints in second half.
Previous studies have shown that the combination of performance indicators and the playing area can evaluate the performance of players or teams more objectively, comprehensively and accurately [10]. For example, while there was no significant correlation between the percentage of ball control and the number of goals scored, the rate of ball control in the attacking third and opponents’ half court is significantly related to the number of goals [41]. The number of successful attempts into the opposing team’s penalty area is considered one of the key factors affecting the outcome of the game [6], while the number of successful attempts into the attacking third and the opposing team’s penalty area can also distinguish different tactical styles [42].
The purpose of this study is to reflect the influence of match formation on running performance more comprehensively by analyzing the ratio of running time in different fields. The results show that there is no significant difference in the proportion of running time between different formations, but there is a significant difference in some positions. As for centre backs, players in the 3-5-2 spend significantly longer time running in the opponent’s half-court than those in the 4-5-1 and 4-4-2 and spend significantly longer time running in the attacking third than those in the 4-51 formation. As for centre half backs, players in the 4-5-1 and 3-5-2 formations spend significantly longer time running in the opponent’s half-court and in the attacking third than those in the 4-4-2 formation. It can be seen that if more players are deployed in the same area, both the centre-back and the centre-half, the players in that position will have more movement in the opponents’ half court and in the attacking third. It may be a phenomenon of “Economies of scale”in personnel deployment [1]. In modern football games, more emphasis is placed on total offense and defense. When too many people are accumulated in a certain area, it may restrict the whole team’s attack and defense efficiency. For example, the three centre backs, although they will occupy the defensive advantage in the middle, but when attacking, they will appear to be overmanned in the backcourt. In order to ensure the efficiency of the attack, it is necessary for the centre backs to take on more roles in initiating and organizing the attack. Three centre half backs, although both sides of the attack can be better control of the midfield area, but the attack will lead to lack of support in the front, when there is need to have more centre half backs active in the other half and attack in the attacking third to support their team’s attack. In summary, it can be said that different game formations have different requirements for the coverage area of each position in the game.
Previous studies have shown that the performance of a player’s running in a match is closely related to his position in the match, and the specific physical training to meet this position has become an important part of the preparation and training of the team [39, 43-45]. This study further digs the problem and explores the relationship between different match formations and the running performance of teams and players. The conclusions are as follows:
The results of this study can help coaches and football practitioners to have a deeper understanding of the specific characteristics of the match formation and the physical requirements of different match formations on the team and players, and then help them to scientifically and accurately match the team formation and player location and design special physical training to allow the team to show a higher level of competition in the game [46-51].
Disclosure of Interest: The authors report no conflict of interest.