Author(s): Erasmus L. Owusu
This paper examines the empirical linkage between stock market development and sustainable economic growth in Botswana. The paper employs Auto-Regression Distributed lags (ARDL)-bounds testing approach and multi-dimensional stock market development proxies to examine this relationship. The paper finds that in the long run, stock market development has a minimal and negative impact on economic growth in Botswana. However, stock market development, especially, market capitalisation development has some short-term impact on economic growth. The paper, however, failed to any impact of stock value traded and the stock value turnover on economic growth. This finding supports the numerous past studies, which have reported negative or inconclusive results on the effects of stock market development on economic growth. The paper, therefore, concludes that there is the need for increasing financial deepening and the reform and diversification of the ownership structure of the capital markets by providing further public and institutional education on the value of stock markets for economic development.
On 8 March 2018, the Governor of the Central Bank of Botswana, in a speech on the topic: Botswana Stock Exchange (BSE) - A platform for economic growth and diversification stated and I quote “Suffice to say, the wide-ranging agenda has touched on a host of issues that are fundamental to the success of enabling the BSE to serve as an effective platform for economic growth and diversification”. He follows up with the statement that “Empirical research has repeatedly indicated a positive correlation between financial sector development, economic growth and poverty reduction. Regrettably, however, the financial systems in most African countries remain small, fragmented and not well diversified, providing only a limited number of services and, evidently, at relatively high cost”. The last statement is what this paper will test for Botswana [17].
In this investigation, the paper constructs a stock market development index, which combines all the 3 stock market indicators into one factor. The paper employs the Auto-Regression Distributed lags (ARDL) - bounds testing approach in an attempt to establish a long-term relationship between stock market development and economic growth in Botswana using data from 1993 to 2016. This paper contributes to the debate on the impact of stock market development on economic growth with evidence from Botswana, one of the countries in Southern Africa. It follows on with the growing discussions that investigation into stock market- economic growth nexus should be narrowed down to country-specific, time series studies which provide the opportunity to account for country-specific conditions. The rest of the paper is divided into 3 sections. In Section II, we review some of the empirical literature. Section III describes the methodology used, the empirical analyses, as well as the discussion of the results. Section IV concludes the paper [1,3,7,14,15].
Numerous attempts have been made to stretch the boundaries of the financial development- economic growth debate by narrowing it down to the discussions of stock market development and economic growth. The stock market/financial development and economic growth nexus have received some attention, however, with mixed results. For example, Akinboade examines the relationship between financial development and economic growth in Botswana using a Granger-causality methodology between real per capita income and financial development. He finds that there is bi-directional causality between per capita income and the financial development indicators in Botswana. Eita and Jordaan also analyse the causal relationship between financial development and economic growth in Botswana for the period 1977-2006, using Granger causality and co-integrated Vector Auto-regression methods and applied these methods on two proxies for financial development. They find that there is a stable long-run relationship between financial development and economic growth regardless of which proxy for financial development is used [2,11].
In a further paper on this discourse, Adusei analyse time series data from 1981 to 2010 from Botswana. He uses Fully Modified Ordinary Least Squares regression technique and Pairwise Granger Causality for the analysis. He finds that, when domestic credit to the private sector as a share of GDP is used to proxy financial development, there is a negative, significant relationship between financial development and economic growth in Botswana. However, when the ratio of liquid liabilities (M3) to GDP is used to measure financial development, a positive, significant relationship is found. He, therefore, concludes that finance may promote growth in Botswana via the expansion of the size of the financial intermediary sector. Carp also analyses the dynamics of the stock market in Central and Eastern Europe under the impact of the macroeconomic imbalances by emphasising the volatility of the foreign capital inflows. He tests the impact of stock market development on the correlation between foreign capital inflows and economic growth. He concludes that the availability of stock markets attract an investor who invest their capital for economic growth [1,9]
Additionally, Owusu and Odhiambo examine the relationship between stock market development and sustainable economic growth in Ghana. They employ the recently developed ARDLbounds testing approach and multi-dimensional stock market development proxies to examine this linkage. They find that in the long run, stock market developments and capital account liberalization policies have no positive effect on economic growth in Ghana. They conclude that it is the increase in credit to the private sector, rather than stock market development that drives the real sector development in Ghana. Finally, Owusu examines the relationship between stock market evolution and sustainable economic growth in Nigeria employing Auto-Regressive Distributed Lag (ARDL)-bounds testing approach and a combined stock market indicators index to examine the relationship. He finds that, in the long run, the stock market has no positive and at the best-mixed effect on economic growth in Nigeria. As can be seen from the available literature on Botswana, most of them looked that the linkage between the broader financial development and economic growth. This paper differs from the previous ones in two aspects. Firstly, it uses the most recent time series data from 1993 to 2016. Secondly, it looks specifically into the impact of stock market development and economic growth [14-15].
To derive the required models, it is known theoretically that, stock market development is expected to lead to economic growth. This paper specifies four simple log-linear equations of economic growth with stock market development indicators as the variables. Each equation will include one of the three proxies for stock market development indicators, .i.e. stock market capitalisation, values of traded stocks and stock turnover. However, in the fourth equation, a composite stock market development index will be included in order to capture the effects of the combined three stock market development proxies on economic growth [12].
The required equations are specified as follows:
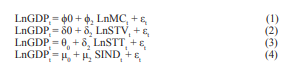
Where: GDPt, = real GDP at constant local currency; MCt = stock market capitalisation (% of GDP); STVt = stock value traded (% of GDP); STTt = stock market turnover (%); SIND = stock market development index; ?0,δ0, θ0 and μ0 = constant parameters; εt = the white noise error term; and Ln = natural log operator. The equations are run on annual time series data from 1993 to 2016 sourced from World Bank, World Development Indicators, World Bank, Africa Development Indicators and Botswana Stock Exchange, Annual Report then rebased across the sources for consistency [8,20,21,].
Beck et al. outline three key stock market indicators in measuring size, activity, and efficiency. The ratio of stock market capitalisation to GDP (MC), for example, measures the size of the stock market, because it aggregates the value of all listed shares in the stock market. However, the size of the stock market does not provide any indication of its liquidity. To measure stock market liquidity, Beck et al. proposed the use of the value of stock traded to GDP variable (STV). This indicator is equal to the value of the trades of domestic stocks divided by GDP. Lack of liquidity in the stock market reduces the incentive to invest, as it diminishes the efficiency at which resources are allocated; and hence, it affects economic growth and development. In order to capture the efficiency of the domestic stock market, they suggested the use of the Stock Market Turnover Ratio (STT), which is equal to the value of trades of shares on the stock markets divided by market capitalisation. Other writers, including Bencinvenga et al.are also of the view that more efficient stock markets can foster better resource allocation and spur growth [5,6,13].
To account for the combined effect of stock market development on economic growth, an index of the three proxies of stock market development (SIND) is included. SIND is a composite index of the three stock development indicators, constructed by using their growth rate. To derive the index, the paper first computes the annual growth rate for market capitalisation (MC), the ratio of total stock value traded to GDP (STV), and the turnover ratios (STT) for each year. Thereafter, the average of the growth rates is taken, in order to obtain an overall index of the stock market development for each year. This index allows us to examine the overall effects of stock market development on economic growth in Botswana.
The methodology used in this paper is based on the ARDLbounds testing approach, which was popularised by Pesaran et al. This approach involves two stages. In the first stage, the ARDL model of interest is estimated by using the ordinary least squares (OLS), in order to test for the existence of a long-run relationship among the relevant variables. In order to test the null hypothesis of no long-run relationship among the variables in the equation, a Wald F-test for the joint significance of the lagged levels of the variables is performed. If the F-statistic is above the upper critical value, the null hypothesis of no long-run relationship can be rejected, irrespective of the orders of integration for the time series. Conversely, if the test statistic falls below the lower critical value, then the null hypothesis cannot be rejected. However, if the statistic falls between the upper and the lower critical values, then the result is inconclusive [18].
Once the long-run relationship or cointegration has been established, the second stage involves the estimation of the long-run coefficients (which represent the optimum order of the variables after selection by AIC or SBC). Thereafter, a general error-correction model (ECM) can be formulated as follows:
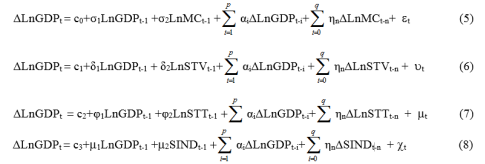
Where: σi, δi, φi and μi = long run multipliers corresponding to long-run relationships; c0 , c1, c2 and c3 = drifts; and εt, υt, μt and χt = white noise errors
The short-run effects in the above equations are captured by the coefficients of the first-differenced variables in the UECM model. According to Bahmani-Oskooee and Brooks, the existence of a long-term relationship does not necessarily imply that the estimated coefficients are stable. This suggests that there is the need to perform a series of tests diagnoses on the model established. This involves testing the residuals (i.e. homoscedasticity, non-serial correlation, etc.), as well as stability tests - to ensure that the estimated model is statistically robust. To test the existence of a long-run relationship for each of the above equations, we conduct an F-test for a joint significance of the coefficient of the lagged levels, by using the ordinary least square (OLS). The general UECM model is tested downwards sequentially, by dropping the statistically non-significant first differenced variables for each of the equations - to arrive at a “goodness-of-fit” model - using a general-to-specific strategy [4,16].
The results of the Augmented Dickey-Fuller and the Phillips and Peron unit root tests for the relevant variables are reported in Tables 1 to 4 below.
Table 1: ADF unit root tests for the variables in levels
| Variable | No Trend | Result | Trend | Result |
|---|---|---|---|---|
| LnGDP | -0.838 | N | -3.867 | -3.867 |
| LnMC | -2.767 | N | -1.461 | -1.461 |
| LnSTV | -2.885 | N | -3.554 | -3.554 |
| LnSTT | -1.669 | N | -2.273 | -2.273 |
| SIND | -4.712 | S | -4.598 | -4.598 |
Notes: 95% published asymptotic critical value including an intercept but not a trend is -3.004 and the value including an intercept and a trend is -3.633. S = Stationary and N = Nonstationary. Ln is the natural log operator. Source: Data output via Microfit 5.0 [10,19].
Table 2: ADF Unit Root Tests for the Variables in the First Difference
| Variable | No Trend | Result | Trend | Result |
|---|---|---|---|---|
| δLnGDP | -4.461 | S | -4.372 | S |
| δLnMC | -4.100 | S | -5.492 | S |
| δLnSTV | -4.509 | S | -4.390 | S |
| δLnSTT | -4.657 | S | -4.767 | S |
Notes: S = Stationary and N = Non-stationary. δ is the difference operator and Ln is the natural log operator: 95% published asymptotic critical value including an intercept but not a trend is -3.012 and the value including an intercept and a trend is -3.645 Source: Data output via Microfit 5.0
Table 3: PP Unit Root Tests for the Variables in Levels
| Variable | No Trend | Result | Trend | Result |
|---|---|---|---|---|
| LnGDP | -1.058 | N | -3.944 | S |
| LnMC | -3.220 | S | -1.422 | N |
| LnSTV | -3.535 | S | -4.078 | S |
| LnSTT | -1.712 | N | -3.499 | N |
| SIND | -10.110 | S | -9.967 | S |
Notes: 95% published asymptotic critical value including an intercept but not a trend is -2.997 and the value including an intercept and a trend is -3.623. S = Stationary and N = Nonstationary. Ln is the natural log operator. Source: Data output via Microfit 5.0
Table 4: PP Unit Root Tests for The Variables in the First Difference
| Variable | No Trend | Result | Trend | Result |
|---|---|---|---|---|
| δLnGDP | -8.402 | S | -8.403 | S |
| δLnMC | -5.899 | S | -12.206 | S |
| δLnSTT | -9.671 | S | -13.407 | S |
Notes: S = Stationary and N = Non-stationary. δ is the difference operator and Ln is the natural log operator: 95% published asymptotic critical value including an intercept but not a trend is -3.004 and the value including an intercept and a trend is -3.633 Source: Data output via Microfit 5.0
The results in Tables 1 to 4 indicate that all the variables are either I(0) or I(1) - using both the Augmented Dickey-Fuller and the Phillips and Peron - widow length =10 - unit root tests. The paper, therefore, rejects the null hypothesis that the variables are non-stationary [10,19].
The results of the cointegration test, based on the ARDL-bounds testing approach, are reported in Table 5. The results show that, in one of the equations, the null hypothesis of no co-integration is rejected and for the remaining three, the null hypothesis is not rejected. This implies that there is a long-run co-integration relationship between stock market capitalisation and economic growth Botswana. The long-run results of the co-integrated relations are reported in Tables 6.
Table 5: Bounds F-Test for Cointegration for All the Economic Growth Models
| Dependent variable | Functions | F-test statistics | ||||
|---|---|---|---|---|---|---|
| LnGDP | FLnGDP (LnGDP| LnMC) | 7.210*** | ||||
| FLnGDP (LnGDP| LnSTV) | 2.778 | |||||
| FLnGDP (LnGDP| LnSTT) | 2.291 | |||||
| FLnGDP (LnGDP| SIND) | 3.273 | |||||
| Asymptotic Critical Values | ||||||
| Pesaran et al., p.301, Table CI(iv) Case IV | 1% | 5% | 10% | |||
| I(0) | I(1) | I(0) | I(1) | I(0) | I(1) | |
| 6.10 | 6.73 | 4.68 | 5.15 | 4.05 | 4.49 | |
Note: *, ** and *** denote statistical significant at 10%, 5% and 1% levels respectively [18]. Source: Data output via Microfit 5.0
Table 6: Economic Growth and Market Capitalisation - Results of ARDL (1, 6) Long Run Model Selected on AIC
| Regressor | Co-efficient | Standard Error | T-Ratio | Prob. |
|---|---|---|---|---|
| C | 4.745 | 0.497 | 9.516 | 0 |
| LnMC | -0.078 | 0.140 | -0.556 | 0.592 |
Notes: Dependent variable: LnGDP. Source: Data output via Microfit 5.0
Microfit 5.0
Table 6 shows that the coefficient of Market capitalisation (LnMC) has a statistically insignificant negative effect on economic growth (LnGDP) in the long run. This may suggest that contrary to a priori expectation, in the long run, stock market capitalisation has a negative impact on economic growth in Botswana. The results of the short-run dynamics emanating from the long-run relationships are shown in Tables 7.
Table 7: Economic Growth and Market Capitalisation - Results of ARDL (1, 6) ECM Model Selected on AIC
| Regressor | Co-efficient | Standard Error | T-Ratio | Prob. |
|---|---|---|---|---|
| δLnMC-1 | -0.043 | 0.033 | -1.328 | 0.214 |
| δLnMC-2 | 0.009 | 0.035 | 0.263 | 0.798 |
| δLnMC-3 | -0.174 | 0.040 | -4.385 | 0.001 |
| δLnMC-4 | -0.200 | 0.042 | -4.741 | 0.001 |
| δLnMC-5 | -0.114 | 0.041 | -2.800 | 0.019 |
| δLnMC-6 | -0.068 | 0.030 | -2.278 | 0.046 |
| Ecm(-1) | -0.230 | 0.065 | -3.532 | 0.005 |
| R-Squared 0.869 R-Bar-Squared 0.752 | Residual Sum of Squares 0.004 DW-statistic 2.234 | |||
| S.E. of Regression 0.022 F-Stat. F(7,10) 8.523[0.002] | Akaike Info. Criterion (AIC) 40.528 Schwarz Bayesian Criterion (SBC) 36.521 | |||
Source: Data output via Microfit 5.0
As can be seen from Table 7, stock market capitalisation has a short-term negative impact on economic growth in Botswana. The coefficient of ECM (-1) is found to be statistically significant at the 1% level and has the expected negative sign. This confirms the existence of co-integration between the variables. The magnitude of the coefficient of the ECM (-1) suggests a relatively, slow rate of adjustment aftershock. Thus, it takes about 4 years and 4 months to fully correct any disequilibrium due to economic shock.
Finally, the regression for the underlying ARDL models fits very well and they pass all the diagnostic tests against serial correlation, functional form, Normality and Heteroscedasticity based on the Lagrange Multiplier (LM) Test Statistics as shown in Table 8. Also, an inspection of the cumulative sum (CUSUM) and the cumulative sum of squares (CUSUMSQ) graphs (Figures 1 and 2) from the recursive estimation of the model reveals there is stability and there is no systematic change detected in the coefficient at 5% significant level over the sample period.
Table 8: ARDL-UECM Models Diagnostic Tests
| LM Test Statistics Results | Equation 1 |
|---|---|
| R-Square | 99.50% |
| Serial Correlation: CHSQ(1) | 0.525(0.469) |
| Functional Form: CHSQ(1) | 0.751(0.386) |
| Normality: CHSQ(2) | 6.278(0.053) |
| Heteroscedasticity: CHSQ(1) | 0.016(0.898) |
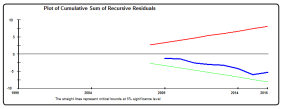
Figure 1: Plot of CUSUM for coefficients stability for ECM equation (1)

Figure 2: Plot of CUSUMSQ for coefficients stability for ECM Equation (1)
The main objective of this paper has been to empirically examine the impact of stock market development on economic growth in Botswana. The paper has employed the ARDL-bounds testing approach and unrestricted error correction model (UECM) to examine this linkage. The paper has also employed three proxies of stock market development, namely stock market capitalisation, stock market traded value and stock market turnover and a combined new proxy derived from the growth rates of these proxies. The results of this paper suggest that stock market development has mainly short-term negative or no impact but in the long run, there is negligible or no effect on the economic growth in Botswana.
One interesting finding is that the composite index for stock market development, the stock traded value and the stock traded turnover have neither short nor long-run impact on the economic growth in Botswana. This may suggest a possible lack of liquidity and lack of efficiency, as well as the narrow base of ownership structures, prevents the expected benefits of stock market development from accruing to the real economy. This finding is in contradiction to our expectation but supports the conclusion reached by some of the previous studies
The policy implications arising from the findings are that, to ensure that stock market developments play its relevant theoretical role in economic growth in Botswana, policymakers should implement policies which will lead to diversification and reform of the ownership structure in the capital market to improve liquidity and efficiency, ensure proper information disclosure on the activities of the stock markets in an attempt to reduce information asymmetries. Finally, they have to increase financial deepening and removing bottlenecks in the capital market by providing further public education on the value of stock markets and how they can participate and also, by adopting a proper legal framework to help shape the financial deepening process in Botswana.