Author(s): Gerald C. Hsu
In this research note, the author describes his preliminary findings of two different glucose levels produced by “coffee-only” meals – coffee versus decaffeinated coffee
In this research note, the author describes his preliminary findings of two different glucose levels produced by “coffee-only” meals - coffee versus decaffeinated coffee.
The author has conducted many glucose experiments and research studies since mid-2019 by eating different kinds of food materials, nutritional ingredients, and cooking methods. During one of his multiple experiments of eating 138 meals with eggs only, he discovered the significant difference on glucose amount and peak glucose timing between 71 liquid meals (egg drop soup) and 67 solid meals (pan-fried egg). The biochemical interpretation could only provide a partial explanation of his results, while his math-physical methodology combined with a statistical “decision making using the elimination method” has provided a reasonable interpretation based on neuro-scientific considerations. While struggling to differentiate liquid food versus solid food, he thought about the possible existence of a neural communication model with a feedback loop where a “message is received and marching orders issued”. He further hypothesized that the stomach treats the arrival of liquid food similar to drinking a cup of coffee or tea. But, in this research note, he has discovered that physical behavior of a liquid state food is different from the biochemical behavior from caffeine of a cup of coffee. A specific signal ascends from the stomach to the brain for decision making, where the brain issues a marching order to both the liver and pancreas regarding the production or release of glucose and insulin (both glucose amount and timing of peak glucose). Therefore, out of his curiosity regarding the possible similarity of glucose levels between egg drop soup and coffee, starting on 5/30/2020, he delved deeper into his meal-glucose research by drinking only coffee as his breakfast.
In 2010, he started his medical research work with a clear objective to control his severe type 2 diabetes conditions. Therefore, he needed to acquire knowledge on food nutrition along with managing his diabetes control and health improvement via a balanced food nutritional intake and a proper level of exercise. In fact, intermittent fasting is not his favorite method of controlling his weight and glucose; therefore, a coffee only breakfast option clearly violates the rules of his health program. He is not a clinical MD or a nutritionist with no “patients” under his care which can provide useful clinical data for his research work. In the end, his strong curiosity surpassed his health concern for a short period of time. For the past 17 days from 5/30/2020 to 6/15/2020, he had eight meals of decaffeinated coffee and seven with coffee for a total of 15 coffee only “breakfasts” (a rather small dataset but still representable).
Figure 1 illustrates the ingredients of his coffee only breakfasts. The green can contains 100% Arabica coffee which is 99.7% caffeine free, whereas the brown glass jar contains 100% caffeinated instant pure coffee. Combined with the cream and artificial sugar, Splenda, they contain less than 1 gram of carbs/ sugar. Therefore, from a food nutritional viewpoint, the only difference between these two coffee meals is that the normal coffee with 100% caffeine, and the other decaffeinated coffee has only 0.3% caffeine.
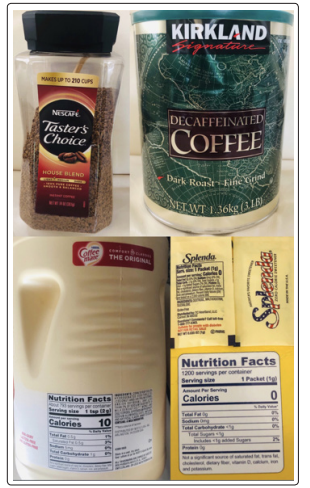
Figure 1: Two different coffee meals, cream, and artificial sugar
The author researched other medical articles regarding the relationship between glucose and caffeine [1, 2, 3]. Although he gained some useful information, he became more confused about their conclusions. Here is a combined excerpt from References 1, 2, and 3:
Caffeine is arguably the most widely consumed drug in Western society. The annual world consumption of coffee exceeds 4 million tons. Caffeine constitutes 1-2% of roasted coffee beans and is present in many over-the-counter preparations for the treatment of cold and allergies, headaches, diuretics, and stimulants. In general, one cup of coffee is assumed to contain 100 mg of caffeine, and soft drinks contain ~10-50 mg of caffeine per 12-oz serving. The per capita consumption of caffeine averages ~200 mg/day, but in some countries, it can exceed 400 mg/day. Coffee consumption, which probably originated in northeast Africa, spread throughout the Middle East in the 15th century and thence to Europe, finally to USA and Asia. It is estimated that more than half of the US population now consumes coffee.
There has been great interest in defining the mechanism of action of caffeine and determining the health consequences of its consumption. Progress has been made on both accounts, but not without controversy
The ability of decaffeinated coffee to achieve these effects is based on a limited number of studies, and the underlying biological mechanisms have yet to be elucidated.
Two human studies that distinguished between caffeinated and decaffeinated coffee suggest a possible resolution of the difference between caffeine’s negative short-term effects on glucose metabolism and coffee’s long-term ability to decrease diabetes risk
In conclusion, some early evidence exists that decaffeinated coffee may be better suited for enhancing glucose tolerance and insulin sensitivity than is caffeinated coffee. More research is needed to elucidate both the short- and long-term effects of decaffeinated coffee on diabetes.
From ADA Editorial (Reference 2): Caffeine may reduce in insulin sensitivity by about 15% (obesity changes about 40%) which could elevate glucose level [2].
Though the author does not have a strong academic training in both biology and chemistry, most of his backgrounds are in mathematics, physics, computer science, and engineering. Those academic and professional trainings have prepared him on how to observe physical phenomena, collect relevant data, analyze and interpret results, and build up suitable computer models to simulate complex physical and mathematical problems.
Although the data amount is rather small with 15 coffee meals, he still can write an intermediate research note based on what he has observed and analyzed to date. The results can speak for itself, regardless of the lack for a proper interpretation in his observed physical phenomenon.
He has been a severe diabetes patient for 25 years and has suffered many metabolic disorder complications, including cardiovascular diseases, chronic kidney disease, bladder infection, foot ulcer, diabetic retinopathy, and hyperthyroidism. Therefore, his motivation for medical research is finding out what to eat and what to do in order to keep his glucose level on target. He has no interest into the research of the relationship between caffeine and the “risk” of having diabetes since he already is a severe diabetes patient.
The top table in Figure 3 along with Figure 4 provide a summary of the following: coffee has created a peak glucose (189 mg/ dL) that is 175% higher than the decaffeinated coffee (108 mg/ dL). In terms of the averaged sensor PPG over 3-hours, coffee produces 143 mg/dL average sensor glucose which is 140% higher than the decaffeinated coffee’s averaged sensor glucose of 102 mg/dL. Both differences of the averaged PPG (40%) and peak PPG (75%) are noticeable and significant. The caffeine’s energy associated with the peak PPG and averaged PPG are 306% and 196%, respectively, which are higher than the decaffeinated coffee. It is the energy associated with glucose that causes all the impact and damage on the human internal organs.
Figure 2 demonstrates detailed background information of these three coffee meals, including number of meals, finger PPG, and post-meal walking steps. The bottom curve diagram in Figure 3 puts these three sensor PPG waveforms on the same scale of mg/dL. We can clearly see the big difference between the decaffeinated (red curve) and caffeinated (blue curve) with the “total” (green curve) sitting in the middle. Figure 4, a conclusive diagram, repeatedly shows the significant difference between decaffeinated coffee and coffee (the big gap between these two curves).
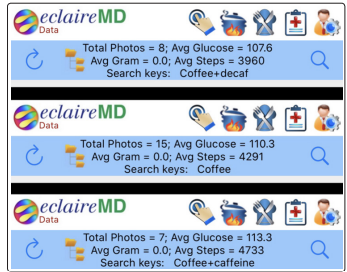
Figure 2: Three coffee meals data of numbers, finger PPG, and post-meal walking steps
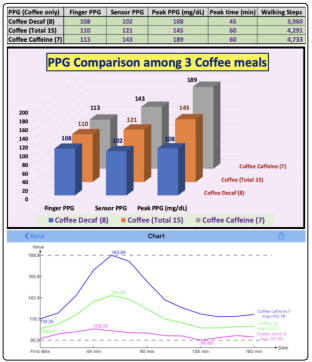
Figure 3: Three coffee meals Sensor PPG information - table and charts
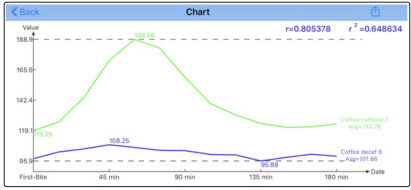
Figure 4: Waveform comparison between decaffeinated coffee and coffee
Figure 5 shows that coffee (with caffeine) has much higher PPG value than both decaffeinated coffee and liquid egg drop soup (these two meal types have similar PPG levels)
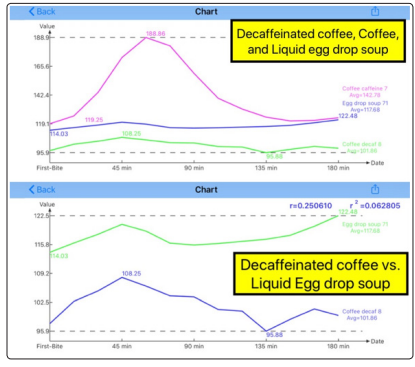
Figure 5: Coffee with caffeine has much higher PPG than both decaffeinated coffee and liquid egg drop soup, while these two meal types have similar PPG levels
The significant averaged PPG difference of 40%, peak PPG difference of 75% and their associated “relative” energy difference of ~2x and ~3x between these two coffees can be easily observed from the research results.
It seems that caffeine is bad for diabetes control since it raises the glucose level by 40% and doubles the energy associated with the higher glucose.
The question here is why the glucose values are so different? So far, the author can detect the only differential factor which is “caffeine”. But what kind of biochemical chain reactions in the organs or what kind of neural communication mechanism among the organs can cause this elevated glucose?. The author needs to conduct additional research (hopefully with less personal experiments due to his long-term health concerns) in order to find a satisfactory answer. He wrote this intermediate research note in regard to his findings in order to share with other fellow research scientists. He hopes to move forward and to be able to get a clear answer about this mysterious phenomenon.