Author(s): Magdalena Wiacek
The objective of this study was to analyze the dynamics and differences of changes in obesity-defining parameters such as body mass index (BMI), waist circumference (WC), total cholesterol (TC), tricarboxylic acid (TG), high-density lipoprotein cholesterol (HDL-C) and low-density lipoprotein cholesterol (LDL-C) in representative samples from the US and South Korea in analogous sampling frames comprising the years 2007 - 2008 and 2009 - 2010. Differences in anthropometric parameters and serum lipid levels between specific sampling frames were evaluated using a t-test for unpaired data. Age-dependent changes were analyzed using the GLM technique and the Bonferroni-Dunn post-hock test. Among all subjects, the obesity defined by BMI is cross-correlated with an increase in WC. However, in extremely obese women in the United States, there is a lack of a direct relationship between BMI and WC. There was also a clear correlation between the relative change in WC and serum lipid levels in subjects of different ethnic groups. This study showed that BMI and WC could be interchangeably used to assess the health risks associated with increased serum lipid levels in US and South Korean populations
The scientific literature points to obesity as a predominant problem affecting developed and developing countries Nooyens, 2009 #18;Gostynski, 2004 #19;Monteverde, 2010 #82;Egger, 2011 #80;Flegal, 2002 #71;Flegal, 2010 #70;Popkin, 2008 #79. Since increased body weight hinders not only physical activity but also work performance and is associated with detrimental health, including cardiovascular problems, prevention of obesity is desired from an economic and health-related quality of life(HRQL) perspective [1, 2]. During the second half of the twentieth century, the generation of the term 'ideal body weight' introduced by life insurance companies was the first attempt to correlate body height and weight with possible health complications [3]. This approach was subsequently discontinued, and the concept of 'ideal body weight' was replaced by other obesity indices [4]. However, their usefulness as clinical predictors is still being tested. Thus, despite the apparent shortcomings, BMI remains the golden standard in the obesity study [5, 6].
Due to contradictory results on the applicability of BMI as a
mortality predictor, waist circumference(WC) has recently
become one of the predictors of cardiovascular health [7-9].
Therefore, both indices, i.e., BMI and WC, are widely used as
predictors of health [10].
However, the employment of BMI is problematic in non-Caucasian ethnic groups. For example, BMI cut-offs provided by WHO are not directly applicable to Asian populations [11, 12]. This observation gave motivation for the study of different Asian populations [13-15].
In this study, to analyze geographical and ethnic differences in body mass index(BMI), waist circumference(WC), and serum lipid levels(SLL), including total cholesterol(TC), triglycerides (TG), high-density lipoprotein cholesterol(HDL-C), and low-density lipoprotein cholesterol(LDL-C) as a function of chronological age, we used KNHANES and NHANES data for the 2007-2008 and 2000-2010 sampling periods. The KHANES database encompasses Koreans residing in the Republic of South Korea(SK), whereas NHANES encompasses Americans(US) residing in the USA. The selection of specific databases was made based on the compatibility of sampling schemes in NHANES and KNHANES. In addition, databases were selected for the period for which the total number of expatriates in South Korea was about 1,000,000, with most expatriates of Chinese origin. Currently, the expatriate population vacillates around 2,200,000(https:// www.koreatimes.co.kr/www/nation/2018/01/177_243054.html). Therefore, selecting older samples allows us to avoid incorporatingethnic, sociological, and cultural influences on consumption habits among South Koreans. In summary, advanced statistical analysis revealed the ethnic differences governing the relationships between BMI, WC, and SLL in well-defined geographically and ethnically distant samples.
Study samples were derived from the National Health and Nutrition Examination Survey(NHANES) conducted in 2007 - 2008 and 2009 - 2010, and from the Korea National Health and Nutrition Examination Surveys(KNHANES), conducted yearly between 2007 and 2010 [16, 17]. NHANES, a program designed to determine the health status. of the United States population, is steered by the Centers for Disease Control and Prevention. NHANES is a nationally representative cross-sectional survey conducted by the Korea Centers for Disease Control and Prevention and consists of a health interview and a nutrition and health examination survey [18].
The NHANES data set consisted of 12,943 subjects(6,517 men and 6,426 females) and 13,272 subjects(6,607 men and 6,665 females) for the years 2007-2008 and 2009-2010, respectively. The KNHANES database comprised 4,494(2,097 men and 2,497 women), 9,744(4,370 men and 5,374 women), 10,533(4,843 men and 5,690 women), and 8,958 subjects(4,115 men and 4,843 women) for the years 2007, 2008, 2009, and 2010, respectively. The total data set made up of both data sets was divided into six age groups; 20 G1 < 30, 30 G2 < 40, 40 G3 < 50, 50 G4 < 60, 60 G5 < 70, and 70 G6 80 years old.
In this study, the two-step data cleaning procedure was used. The first stage comprises the selection of healthy subjects. At this stage, all pregnant women and participants under 20 years of age or over 80 years of age were rejected from this study. Stage 2 was a data cleanup procedure based on the algorithm proposed by Horn et al. [12]. In short, each age group in the NHANES and KHANES database was subjected to the Box-Cox transformation. Values below the lower bracket, defined by Q1 -1.5• IQR, and above the upper bracket, defined by Q3 + 1.5 • IQR, were treated as outliers and removed; Q1 - the first quartile, Q3 - third quartile, and IQR - interquartile range. The described data cleaning procedure was used to detect outliers for BMI, WC, TC, TG, HDL-C, and LDL-C for each chronological year. The flow chart for this procedure is shown in Figure 1. The final data consisted of 2,264 and 2,440 and 8,406 and 11,735 subjects for the American and South Korean samples.
Transverse differences between NHANES and KNHANES samples in the corresponding age groups were analyzed using a t-test procedure adopting the pooled or Satterthwaite method, depending on the equality of variance of the samples assessed by the F-test [19]. Longitudinal changes, including those between consecutive age groups, were analyzed using a one-way GLM procedure. The homogeneity of variance was assessed using Levene’s test [20]. If the assumption of homogeneity of the variance was not confirmed, instead of using ANOVA to test for differences between the means of the group, Welch's ANOVA was used. Post-hock analysis was performed using the Bonferroni- Dunn test [21].
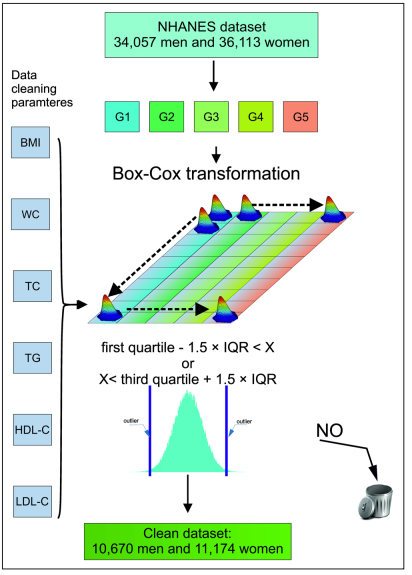
Figure 1: Schematic flow diagram of data cleaning procedure. Arrows indicate the flow of the procedure; the letters a-d indicate consecutive steps of the procedure; 1) selection of the specific age group from NHANES or KNHANES dataset, respectively; 2) selection of a parameter for whom the outliers will be cleaned; 3) application of the Box-Cox filter: the lower outlier bracket is equal to Q1 -1.5•IQR, upper outlier bracket is equal to Q3 + 1.5•IQR; Q1- first quartile, Q3-third quartile, and IQR-interquartile range; d) merging cleaned parameters into the final data set used further for statistical analysis.
The dynamics of longitudinal changes are grouped in Tables 1 to 6 and are graphically represented in Figures 1A, B - 6A, and B for men and women, respectively. Figures 1A, B - 6 A, B. depict the transverse differences in the parameters studied between the US sample and the SK sample stratified by age and gender.
The analysis of Figures 1, A, B - 6A, B unfolded significantly higher BMI, WC, and LDL-C levels across all age groups in the US sample than the S.K.sample for men and women. Significantly higher levels of TC defined US men in age groups 3 and 4 and women in groups 2 - 5. Furthermore, US men were defined by higher TG levels in groups 2-5, while women only in age group 6 had a higher TG level than women in S.K. LDL-C levels were significantly higher among US men in age groups 3, 4, and 5. Among US women, LCL-C levels were higher in age groups 3 and 4.
The differences in serum TG concentrations between men and women in the two populations are striking. Thus, in men, TG levels are lower in the US than in the SK sample across all age groups, whereas in women, serum TG levels are higher in the SK sample in age groups 1-3. Serum HDL-C in the US sample is higher than in the S.K. sample for men and women, respectively. LDL-C levels in US and SK men are analogous in age groups 1, 2, 5, and 6. In age groups 3 and 4, US men are defined by LDL-C levels lower than S.K. men. In women, LDL-C levels are similar in the two ethnic samples.
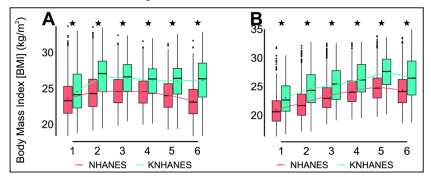
Figure 2: Longitudinal changes in BMI in men as a function of age group, 20 ≤ G1 < 30, 30 ≤ G2 < 40, 40 ≤ G3 < 50, 50 ≤ G4 < 60, 60 ≤ G5 < 70, and 70 ≤ G6 ≤ 80 yr. * indicates statistically significant difference at a level equal to 0.01 between NHANES and KNHANES samples in a specific age group. A) men, B) women.
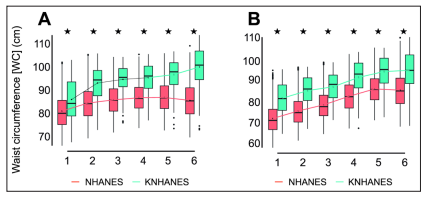
Figure 3: Longitudinal changes in WC in men as a function of age group, 20 ≤ G1 < 30, 30 ≤ G2 < 40, 40 ≤ G3 < 50, 50 ≤ G4 < 60, 60 ≤ G5 < 70, and 70 ≤ G6 ≤ 80 yr. * indicates statistically significant difference at a level equal to 0.01 between NHANES and KNHANES samples in a specific age group. A) men, B) women.
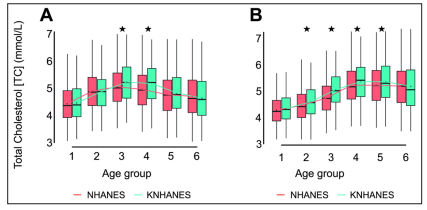
Figure 4: Longitudinal changes in serum TC levels in men as a function of age group, 20 ≤ G1 < 30, 30 ≤ G2 < 40, 40 ≤ G3 < 50, 50 ≤ G4 < 60, 60 ≤ G5 < 70, and 70 ≤ G6 ≤ 80 yr. * indicates statistically significant difference at a level equal to 0.01 between NHANES and KNHANES samples in a specific age group. A) men, B) women.
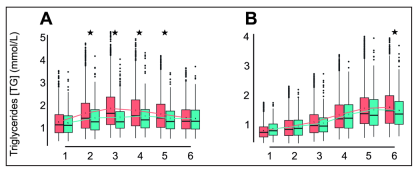
Figure 5: Longitudinal changes in serum TG levels in men as a function of age group, 20 ≤ G1 < 30, 30 ≤ G2 < 40, 40 ≤ G3 < 50, 50 ≤ G4 < 60, 60 ≤ G5 < 70, and 70 ≤ G6 ≤ 80 yr. * indicates statistically significant difference at a level equal to 0.01 between NHANES and KNHANES samples in a specific age group. A) men, B) women.
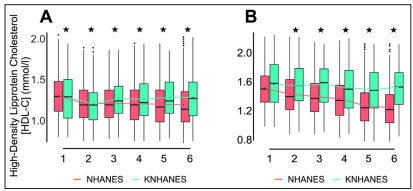
Figure 6: Longitudinal changes in serum HDL-C levels in men as a function of age group, 20 ≤ G1 < 30, 30 ≤ G2 < 40, 40 ≤ G3 < 50, 50 ≤ G4 < 60, 60 ≤ G5 < 70, and 70 ≤ G6 ≤ 80 yr. * indicates statistically significant difference at a level equal to 0.01 between NHANES and KNHANES samples in a specific age group. A) men, B) women.
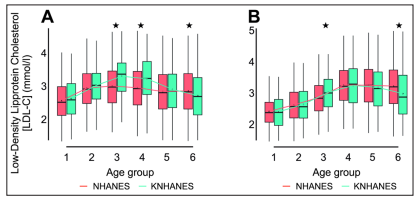
Figure 7: Longitudinal changes in serum LDL-C levels in men as a function of age group, 20 ≤ G1 < 30, 30 ≤ G2 < 40, 40 ≤ G3 < 50, 50 ≤ G4 < 60, 60 ≤ G5 < 70, and 70 ≤ G6 ≤ 80 yr. * indicates statistically significant difference at a level equal to 0.01 between NHANES and KNHANES samples in a specific age group. A) men, B) women.
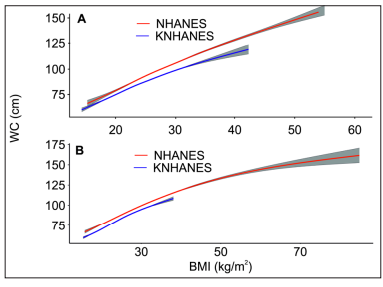
Figure 8: Correlations between WC and BMI for A) US and S.K. men, B) the US and SK women.
An analysis of age-related changes in BMI revealed a gradual increase in all age groups among American males(Table 1). Similar studies of SK men revealed a more distinct increase along with increasing age. Examination of changes in WC as a function of age group revealed a significant increase in WC levels between gender and ethnic samples(Table 2).
Table 1: Longitudinal changes in BMI levels stratified by ethnicity and age group. Age group G1 to G5 refers to the following age brackets : 20 ≤ G1 < 30, 30 ≤ G2 < 40, 40 ≤ G3 < 50, 50 ≤ G4 < 60, 60 ≤ G5 < 70, and 70 ≤ G6 ≤ 80 years of age. Stars correspond to the following P - values: P > 0.05 -, 0.01 ≤ P < 0.05 *, 0.001 ≤ P < 0.01 **, 0.0001 ≤ P < 0.001 ***, P < 0.00001 ****.
| MEN | WOMEN | ||||
|---|---|---|---|---|---|
| NHANES | KNHANES | NHANES | KNHANES | ||
| Parameter | Age groups | P-level | P-level | P-level | P-level |
| 2 - 1 | **** | **** | **** | **** | |
| 3 - 1 | **** | **** | **** | **** | |
| 4 - 1 | **** | **** | **** | **** | |
| 5 - 1 | **** | **** | **** | **** | |
| 6 - 1 | **** | * | **** | **** | |
| 3 - 2 | - | * | * | **** | |
| 4 - 2 | * | - | **** | **** | |
| 5 - 2 | * | **** | **** | **** | |
| 6 - 2 | - | **** | **** | **** | |
| 4 - 3 | - | - | * | **** | |
| 5 - 3 | |||||
| 6 - 3 | - | **** | *** | **** | |
| 5 - 4 | - | **** | *** | **** | |
| 6 - 4 | - | **** | - | - | |
| 6 - 5 | - | **** | * | **** | |
Table 2: Longitudinal changes in WC levels stratified by ethnicity and age group. Age group G1 to G5 refers to the following age brackets : 20 ≤ G1 < 30, 30 ≤ G2 < 40, 40 ≤ G3 < 50, 50 ≤ G4 < 60, 60 ≤ G5 < 70, and 70 ≤ G6 ≤ 80 years of age. Stars correspond to the following P - values: P > 0.05 -, 0.01 ≤ P < 0.05 *, 0.001 ≤ P < 0.01 **, 0.0001 ≤ P < 0.001 ***, P < 0.00001 ****.
| MEN | WOMEN | ||||
|---|---|---|---|---|---|
| NHANES | KNHANES | NHANES | KNHANES | ||
| Parameter | Age groups | P-level | P-level | P-level | P-level |
| 2 - 1 | **** | **** | **** | **** | |
| 3 - 1 | **** | **** | **** | **** | |
| 4 - 1 | **** | **** | **** | **** | |
| 5 - 1 | **** | **** | **** | **** | |
| 6 - 1 | **** | **** | **** | **** | |
| 3 - 2 | * | * | * | * | |
| 4 - 2 | * | * | * | * | |
| 5 - 2 | **** | **** | **** | **** | |
| 6 - 2 | **** | **** | **** | **** | |
| 4 - 3 | - | - | - | - | |
| 5 - 3 | * | * | * | * | |
| 6 - 3 | **** | **** | **** | **** | |
| 5 - 4 | - | - | - | - | |
| 6 - 4 | **** | **** | **** | **** | |
| 6 - 5 | **** | **** | **** | **** | |
An analogous situation was observed in the analysis of longitudinal changes in TC levels, i.e., a significant increase across all age groups(Table 3). However, in age group 5, TC levels reached a plateau among US and South Korean women.
Table 3: Longitudinal changes in TC levels stratified by ethnicity and age group. Age group G1 to G5 refers to the following age brackets : 20 ≤ G1 < 30, 30 ≤ G2 < 40, 40 ≤ G3 < 50, 50 ≤ G4 < 60, 60 ≤ G5 < 70, and 70 ≤ G6 ≤ 80 years of age. Stars correspond to the following P - values: P > 0.05 -, 0.01 ≤ P < 0.05 *, 0.001 ≤ P < 0.01 **, 0.0001 ≤ P < 0.001 ***, P < 0.00001 ****.
| MEN | WOMEN | ||||
|---|---|---|---|---|---|
| NHANES | KNHANES | NHANES | KNHANES | ||
| Parameter | Age groups | P-level | P-level | P-level | P-level |
| 2 - 1 | **** | **** | **** | **** | |
| 3 - 1 | **** | **** | **** | **** | |
| 4 - 1 | **** | **** | **** | **** | |
| 5 - 1 | **** | **** | **** | **** | |
| 6 - 1 | * | **** | **** | **** | |
| 3 - 2 | **** | **** | **** | **** | |
| 4 - 2 | **** | * | **** | **** | |
| 5 - 2 | - | **** | **** | **** | |
| 6 - 2 | *** | **** | **** | **** | |
| 4 - 3 | - | * | **** | **** | |
| 5 - 3 | **** | **** | **** | **** | |
| 6 - 3 | **** | **** | * | **** | |
| 5 - 4 | **** | **** | - | - | |
| 6 - 4 | **** | **** | * | - | |
| 6 - 5 | * | * | * | - | |
An examination of serum TG levels as a function of an age group in men in the United States(Table 4) revealed a progressive increase but only in age group 4. In S.K. men and US and S.K. women, TG increases significantly along with all age groups.
Table 4: Longitudinal changes in TG levels stratified by ethnicity and age group. Age group G1 to G5 refers to the following age brackets : 20 ≤ G1 < 30, 30 ≤ G2 < 40, 40 ≤ G3 < 50, 50 ≤ G4 < 60, 60 ≤ G5 < 70, and 70 ≤ G6 ≤ 80 years of age. Stars correspond to the following P - values: P > 0.05 -, 0.01 ≤ P < 0.05 *, 0.001 ≤ P < 0.01 **, 0.0001 ≤ P < 0.001 ***, P < 0.00001 ****.
| MEN | WOMEN | ||||
|---|---|---|---|---|---|
| NHANES | KNHANES | NHANES | KNHANES | ||
| Parameter | Age groups | P-level | P-level | P-level | P-level |
| 2 - 1 | *** | **** | - | **** | |
| 3 - 1 | *** | **** | *** | **** | |
| 4 - 1 | **** | **** | **** | **** | |
| 5 - 1 | * | **** | **** | **** | |
| 6 - 1 | * | **** | **** | **** | |
| 3 - 2 | - | **** | * | **** | |
| 4 - 2 | - | *** | **** | **** | |
| 5 - 2 | - | - | **** | **** | |
| 6 - 2 | - | **** | **** | **** | |
| 4 - 3 | - | * | **** | **** | |
| 5 - 3 | - | **** | **** | **** | |
| 6 - 3 | - | **** | **** | **** | |
| 5 - 4 | - | **** | * | **** | |
| 6 - 4 | * | **** | * | **** | |
| 6 - 5 | - | **** | - | * | |
Analysis of changes in HDL-C levels revealed the lack of a clear trend of changes in US men and women(Table 5). However, a continued rise in HDL-C levels defines SK men. In addition, SK women are defined by a significant increase in HDL-C levels in all age groups.
Table 5: Longitudinal changes in HDL-C levels stratified by ethnicity and age group. Age group G1 to G5 refers to the following age brackets : 20 ≤ G1 < 30, 30 ≤ G2 < 40, 40 ≤ G3 < 50, 50 ≤ G4 < 60, 60 ≤ G5 < 70, and 70 ≤ G6 ≤ 80 years of age. Stars correspond to the following P - values: P > 0.05 -, 0.01 ≤ P < 0.05 *, 0.001 ≤ P < 0.01 **, 0.0001 ≤ P < 0.001 ***, P < 0.00001 ****.
| MEN | WOMEN | ||||
|---|---|---|---|---|---|
| NHANES | KNHANES | NHANES | KNHANES | ||
| Parameter | Age groups | P-level | P-level | P-level | P-level |
| 2 - 1 | * | **** | - | **** | |
| 3 - 1 | - | **** | - | **** | |
| 4 - 1 | - | **** | - | **** | |
| 5 - 1 | - | **** | * | **** | |
| 6 - 1 | - | **** | - | **** | |
| 3 - 2 | * | - | - | *** | |
| 4 - 2 | * | - | - | **** | |
| 5 - 2 | * | - | * | **** | |
| 6 - 2 | * | - | - | **** | |
| 4 - 3 | - | - | - | **** | |
| 5 - 3 | - | - | * | **** | |
| 6 - 3 | - | - | - | **** | |
| 5 - 4 | - | - | - | **** | |
| 6 - 4 | - | - | - | **** | |
| 6 - 5 | - | - | - | * | |
LDL-C levels increase continuously along with age groups in the US and S.K. men and women(Table 6). However, women of both ethnic groups are defined by a plateau reached at age group 4.
Table 6: Longitudinal changes in LDL-C levels stratified by ethnicity and age group. Age group G1 to G5 refers to the following age brackets : 20 ≤ G1 < 30, 30 ≤ G2 < 40, 40 ≤ G3 < 50, 50 ≤ G4 < 60, 60 ≤ G5 < 70, and 70 ≤ G6 ≤ 80 years of age. Stars correspond to the following P - values: P > 0.05 -, 0.01 ≤ P < 0.05 *, 0.001 ≤ P < 0.01 **, 0.0001 ≤ P < 0.001 ***, P < 0.00001 ****.
| MEN | WOMEN | ||||
|---|---|---|---|---|---|
| NHANES | KNHANES | NHANES | KNHANES | ||
| Parameter | Age groups | P-level | P-level | P-level | P-level |
| 2 - 1 | **** | **** | *** | **** | |
| 3 - 1 | **** | **** | **** | **** | |
| 4 - 1 | **** | **** | **** | **** | |
| 5 - 1 | **** | **** | **** | **** | |
| 6 - 1 | - | **** | **** | **** | |
| 3 - 2 | **** | * | **** | **** | |
| 4 - 2 | * | - | **** | **** | |
| 5 - 2 | * | *** | **** | **** | |
| 6 - 2 | **** | * | **** | **** | |
| 4 - 3 | - | * | * | **** | |
| 5 - 3 | **** | **** | * | **** | |
| 6 - 3 | **** | **** | - | **** | |
| 5 - 4 | **** | **** | - | - | |
| 6 - 4 | **** | * | **** | - | |
| 6 - 5 | * | - | * | - | |
The correlations between WC and BMI in men and women from the US and SK are shown in Figures 8 A, B, respectively. There is a clear difference in the obesity levels reached by the US population and the South Korean population. However, the relation between WC and BMI is similar in both samples.
Although obesity in the United States has increased during the last two decades, its rate, according to the latest study, appears to be slowing [22-26]. However, obesity, defined as BMI levels > 24.99, is also a problem in the European Union, as shown more than a decade ago, it may become a problem in the countries of the far east [27, 28]. The reason for the increase in obesity may be an interaction of many factors, including, among others, an increase in Gross Domestic Product(GDP) or an unfavorable wealth distribution [29, 30].
However, when defining obesity using BMI, one must be aware of the severe shortcomings of such an approach, including the misleading associations between BMI and cardiovascular health in nonCaucasians [31]. Some findings indicated that waist circumference is a more reliable parameter for assessing cardiovascular risk than BMI [32]. Therefore, in our opinion, an analysis of obesity among South Asians and Chinese, should contain a congruent review of BMI, WC, and serum lipid profiles [31].
A combined analysis of Tables 1 to 6 and Figures 1 to 6 revealed
that the BMI and TC values are much higher in the US sample than
in the SK. The observed difference is compatible with elevated
levels of serum TC in the US sample. In addition, the relative
difference in TC levels is less than the increases observed in WC
and BMI. These observations contradicted the previous study that
reported WC as a better parameter to predict serum lipid levels
among different ethnic groups [8].
Analysis of longitudinal changes in serum lipid levels as a function
of aging revealed that a relative increase in serum TC levels is
generally correlated with a relative increase in serum LDL-C
levels. This observation is in agreement with the study of Heiss
et al. [33].
The combination of our observations with Benetou et al. and
Roskam et al. indicated that serum levels of TC and HDL-C are
inversely associated with educational level, suggesting that the
absolute education level(school education level) in the US is
lower than in SK [34, 27]. However, considering the reports of
overweight and obesity among Korean Americans and secondary
school enrollment and adjusted net national income, it is more
plausible to conjecture that the economic inequality between the
two populations is the source of the observed differences [35, 36].
An analysis of relative changes in BMI and BMI in the US and
S.K. men and women unfolded the seriousness of the obesity
problem in the US population. However, it also indicated potential
health problems among S.K. men, i.e., high obesity(BMI > 30)
associated with large WC values. The level of obesity observed
in US women is currently beyond any 'competition' [sic!] and is
the source of multiple cardiovascular problems encountered in
that population [37].
Although our study also confirmed previous observation that WC is a better predictor than BMI for serum lipid levels, we were unable to confirm the weak coupling between WC and TG in East Asian women [8]. Our study contradicted Kuzuya et al., a report indicating that aging is associated with increased HDL-C levels in women [38].
The relationship between obesity and serum lipid levels has received a relatively large amount of attention. However, due to the incompatibility of sampling methods or methodologies, only a few studies analyzed ethnic differences in BMI, WC, and serum lipid levels. Consequently, to our knowledge, none of the studies focused on direct comparisons of a broad set of parameters across well-defined samples between two entirely different ethnic groups residing in separate geographical regions.
Our study indicated that the weight gain defined by BMI is directly followed by an increase in WC. However, for extremely obese US women, an increase in BMI is not directly followed by an increase in WC. We also observed a clear correlation between the relative change in WC and serum lipid levels between subjects from different ethnic groups. This study showed that both BMI and WC could be used interchangeably to assess health risks associated with elevated serum lipid levels.