Author(s): Shaker Mahmoud Ebrahim* and Bashayer M. Abdullah
An interface for the atmospheric residue desulfurization (ARD) modeling tool developed at petroleum research center (PRC). The modeling tool simulates and predicts the concentrations of sulfur, nickel, vanadium, asphaltene, and conradum carbon residue (CCR) versus time on stream. This tool for built in MATLAB®, requires experimental data for developed for its execution and produces a large number of figures as outputs. Using the developed interface data templates are populated in a friendly manner. In addition, the produced figures are presented in an organized format. The interface is built in the graphical user interface (GUI) of MATLAB.
Internationally, the quality of crude oils is diminishing, stricter environmental regulations are being imposed, and the demand for middle distillate is growing. Therefore, the importance of hydroprocessing in the petroleum refining industry is becoming more apparent. The atmospheric residue desulfurization (ARD) processes are widely used worldwide to convert heavy oils into lighter and low sulfur fuel oils. A wide range of reactions occurs in ARD process. Hydro- desulfurization (HDS) and hydro-metallization (HDM) are the primary ones. The reaction kinetics and catalyst deactivation are strongly depended on unit operation. The optimization of ARD process efficiency is a main concern to refinery, and extensive research efforts have been devoted to the development of catalyst and catalyst systems that are more tolerant to deactivation (2). KISR‘s ARD model was developed based on a simple plug flow model for a multi-catalyst and in a multi- reactor system to study the deactivation mechanisms of ARD catalysts which are mainly due to metal and coke depositions (3, 4, 5).
Recently, the PRC developed a tool for the modeling of the ARD process based solely on Kuwait institute for scientific research (KISR) equations and pilot plant experimental data under project PF065K. The model uses the kinetic parameters, properties of the feed stocks, operating conditions and catalyst characteristics to assess the concentrations of sulfur (S) and other metals: nickel (Ni) and vanadium (V), asphaltenes (Asph) and conradsen carbon residual (CCR) over time-on-stream(6, 1, 2). By cooperation with the Department of Chemical Engineering, National Tsing Hua University in Taiwan and KISR, a model of the ARD processes was created. In this general activity research, the team we likes to create graphical interface user for the ARD processes program.
Using MATLAB is a high-level language and interactive environment for numerical computation, visualization, and programming.
This research activity involves the development of an interface for the ARDS model using GUI in MATLAB.
Achieving the objective of the proposed work and delivering the related output will be accomplished through the following:
Design logical flow chart and layout prototype as shown in (Figure 1).
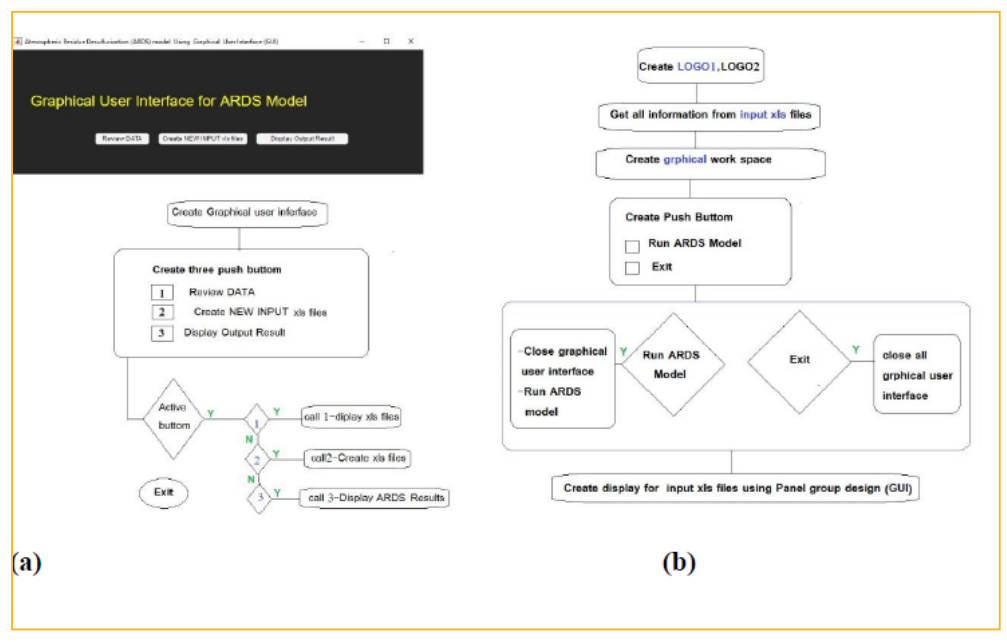
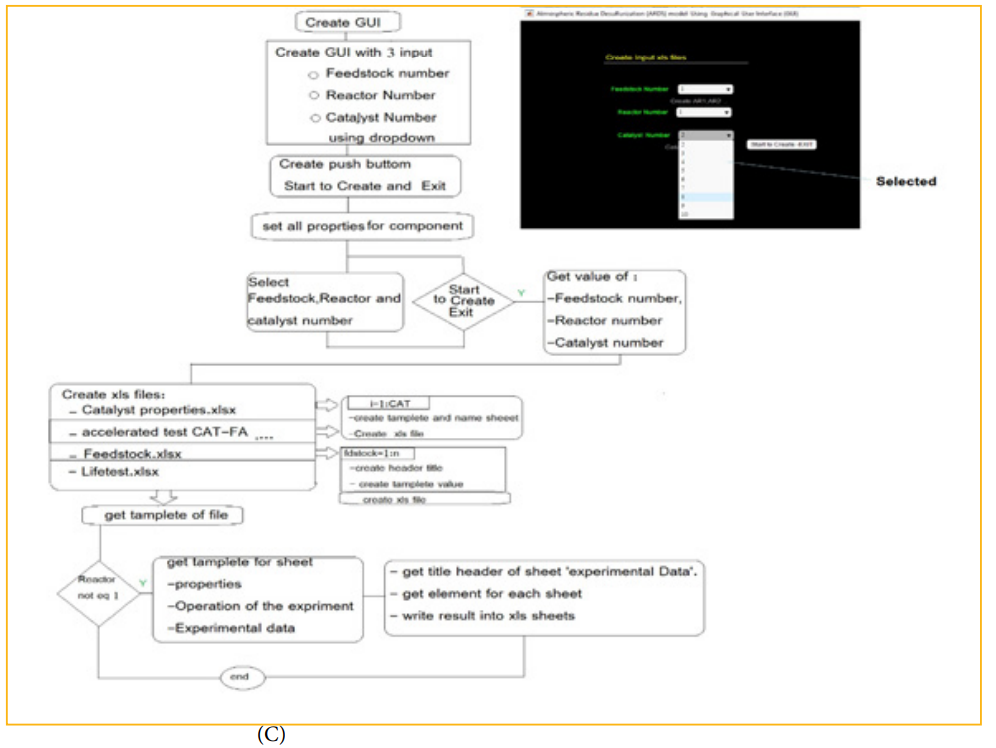
Figure 1: Plan of Design logical flowchart. (a) Review data, create the input files and display. (b) Design graph- ical interface for review data. (c) Create input files corresponding input parameter.
The raw data for modeling will be used from the completed project PF033c. the permission of using data from the PL. The data will be systematically used such as first graphic interface will be tested by using desulfurization (HDS). The product sulfur analysis will be feuded in the Matlab system.
Program Codi UsingMATLABprogrampowerfultoolforprogramming and design by Initialization and implementation of the codes for the graphical user interface (GUI) in an interactive development environment using MATLAB functions design. It has done By Checking the GUI performance and debugging the codes using ARDS data and applying logical flowchart to the program.
Development of ARDS-GUI User Interface, input data and output results are shown in
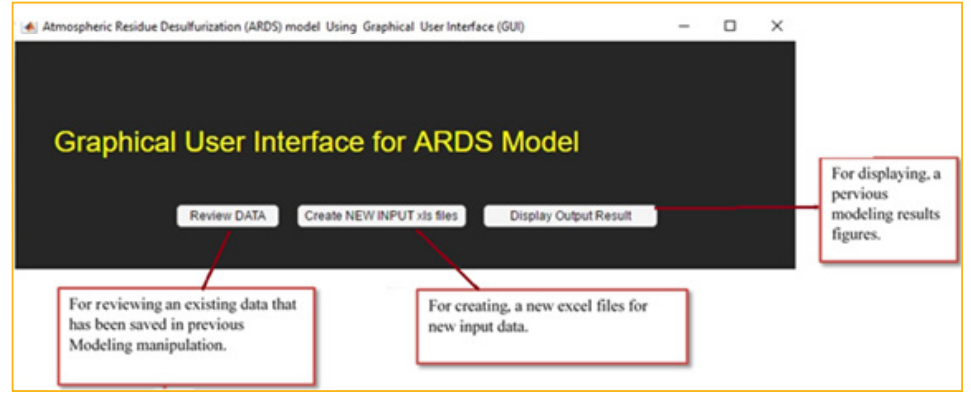
Figure 2: GUI for ARDS model running –first page –setion to review data, Create New Input xls files or display output result.
Review all data input and display the data in GUI format. Run ARDS Model, From Review Data also you could run the ARDS model and Closed all GUI and clear all (Figure 3).
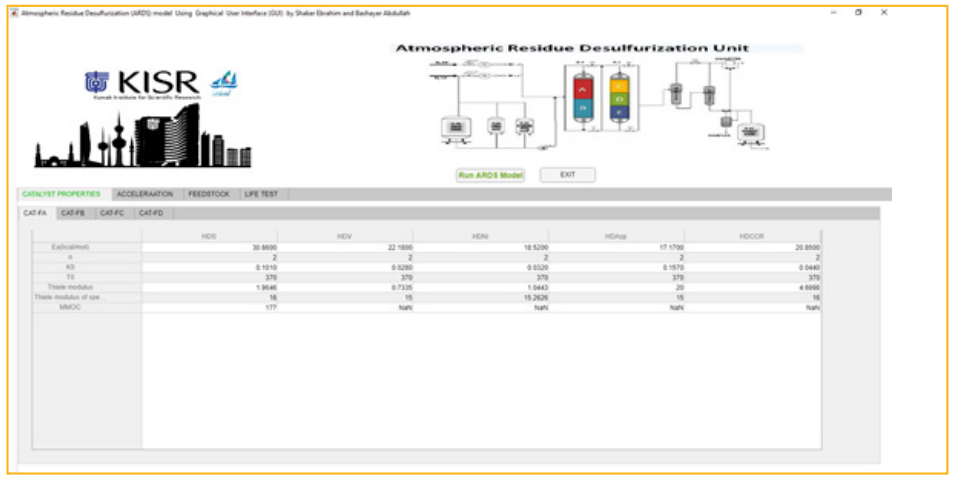
Figure 3: Display the Catalyst properties for different catalyst properties used in the Model.
Create the input excel files for ARDS model depending on parameter enter of number feedstock, number of reactors and number of catalyst used.
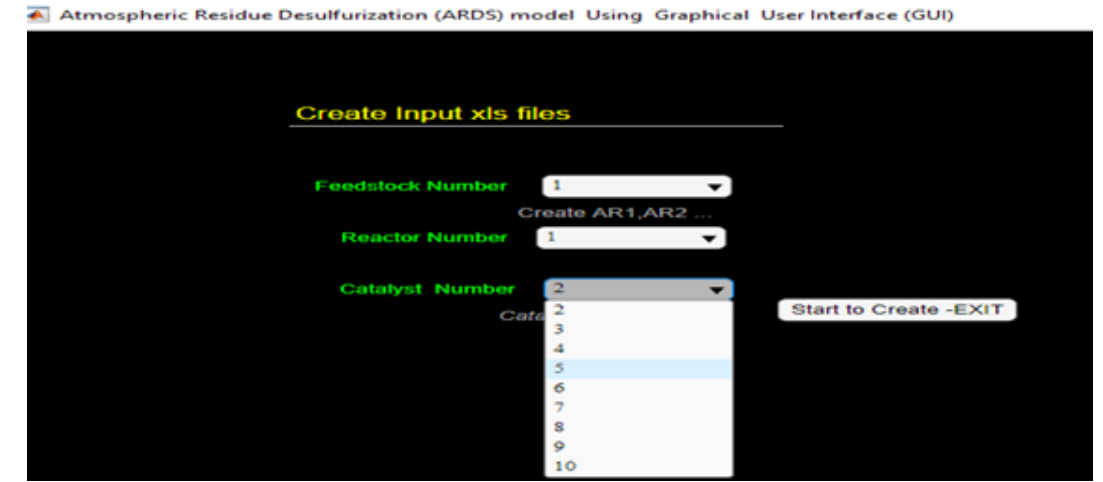
Figure 4: Display layout of selection parameter of catalyst number.
Present all output figures result from ARDS model in GUI.
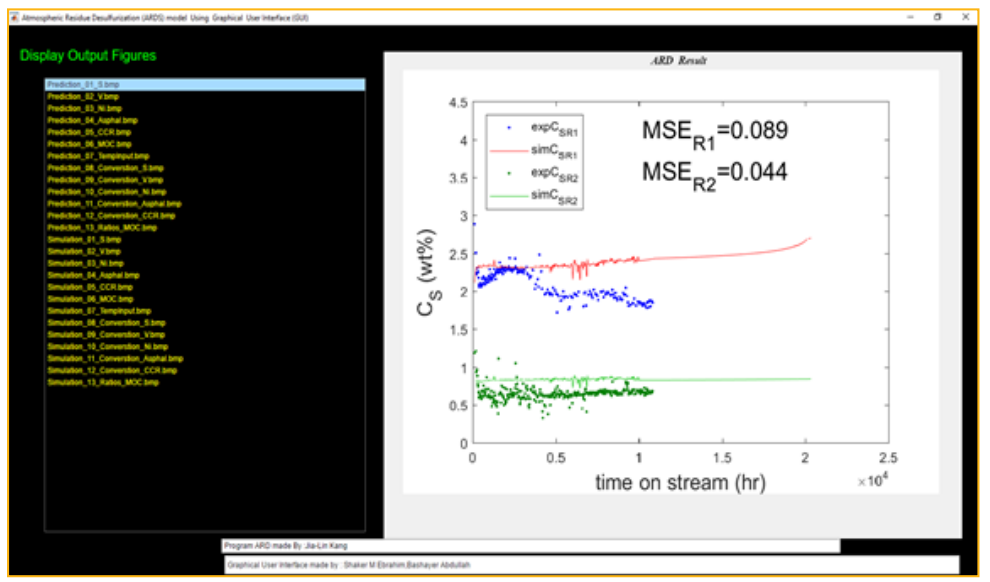
Figure 5: Display the output result from model in GUI screen.
A Graphical UI (GUI) in MATLAB for ARDS predictive modeling tool has been used to designs and identify. In addition, the GUI will be assessed and implemented using previous ARDS data.
The authors acknowledges the Petroleum research Center in Kuwait Institute for Scientific Research (KISR) for financing this research through PF010G project.