Author(s): Gerald C. Hsu
The author uses his developed GH-Method: math-physical medicine approach to investigate a more detailed contribution analysis of three medical condition sub-categories on his risk probability percentages of having cardiovascular disease (CVD) or stroke for over a period of 10+ years
The author uses his developed GH-Method: math-physical medicine (MPM) approach to investigate a more detailed contribution analysis of three medical condition sub-categories on his risk probability (Risk) percentages of having cardiovascular disease (CVD) or stroke for over a period of 10+ years.
To learn more about the MPM method, readers can review the article in Reference 1, along with the outlined history of his personalized diabetes research and application tools development in Reference 2 [1, 2].
In 2014, the author applied topology concept of mathematics and finite-element method of engineering, to develop a ten dimensional complex mathematical model of metabolism which contains four output categories (weight, glucose, BP, lipids and other lab-tested data (ACR, TSH, and others), and six input categories (food, water intake, exercise, sleep, stress, and routine life patterns), and ~500 detailed elements. He further defined two new parameters, metabolism index (MI), as the combined score of the above 10 metabolism categories (dimensions) and 500 detailed elements, and general health status unit (GHSU), as the 90-days moving average value of MI. Please note that Mi (where i = 1 through 10) represents individual metabolism score of each category. Since 2012, he has collected ~2 million data of his own biomedical conditions and personal lifestyle details. He only utilized a part of his big database for analysis work in this article.
Next, he developed a few suitable algorithms containing some different weighting factors which include a patient’s baseline data such as gender, age, race, family genetic history, medical history, bad habits, BMI, and waistline. After continuously collecting sufficient input data for a decade, he can then conduct the following three sets of calculations.
First, medical conditions - individual M2 through M4 for diabetes, hypertension, hyperlipidemia and others. These 3 metabolic disorder values include patient’s self-collected biomedical data and the lab-tested medical examination results. Through his previous research from the past 5 years, he already detected that glucose is the “principal criminal” and blood pressure with lipids are the “accessory criminals” in terms of induced complications from chronic diseases, specifically CVD, stroke, renal problems, diabetic retinopathy, and even cancers. More precisely, his mathematical model for CVD or stroke includes two scenarios. The first scenario is the artery blockage situation which involves diabetes (glucose), hypertension (blood pressure or BP), and hyperlipidemia (lipids), where he applied his acquired solid mechanics and fluid dynamics concepts. The second scenario is the artery rupture situation which involves diabetes (glucose), and hypertension (blood pressure or BP), where he applied his acquired solid dynamics and fracture mechanics concepts.
Secondly, lifestyle details - individual M5 through M10 which affect medical conditions directly or indirectly. In this category, he includes the following 3 sub-categories with a total of 9 detailed elements. (B-1) 3 foods: quantity, quality, and carbs/sugar amount; (B-2) 2 exercises: daily walking steps and post-meal waking steps; (B-3) 4 others: water intake, sleep, stress, and daily life routines.
Thirdly, combined MI & GHSU scores - MI is a combined score of M1 through M10 using engineering finite element method. GHSU is the 90-days moving average MI curve which can show the MI’s trend clearly.
With this developed mathematical risk assessment tool, he can obtain three separate risk probability percentages associated with each of these three calculation models mentioned above. As a result, this tool would offer a range of the risk probability predictions of having CVD or stroke, depending on the patients’ medical conditions, lifestyle details, or the combined metabolism impact on the human body. Due to the limited space for this paper, he only presents his results based on medical conditions.
The author is a 73-year-old male who has a history of three severe chronic diseases for 25 years. In addition, he also experienced five cardiac episodes from 1994 through 2008 and was diagnosed with an acute renal problem in early 2010. He also suffered from foot ulcer, bladder infection, diabetic retinopathy, and hypothyroidism. He weighed 220 lbs. in 2000 and his HbA1C level was 10.0% in 2010.
In 2014, he developed the mathematical metabolism model and started his stringent and comprehensive lifestyle management program. As a result, his overall health conditions have been noticeably improving since 2013-2015 when he started to reduce the dosage of his three prescribed diabetes medications. By the end of 2015, he completely stopped taking them. During the entire period of 2016-2019, his HbA1C average value was 6.6% without medication. During the recent COVID-19 quarantine period from 1/19/2020 to 8/22/2020, his HbA1C has further decreased to 6.1%.
The author has written a few medical papers regarding the subject of risk probability of having CVD or stroke based on his annual data when available [3]. The difference between this article and his previous ones is two-fold. First difference, in this article, he focuses on individual contributions from three sub-categories of biomarkers, glucose, BP, and lipids, instead of taking the overall performance score based on medical conditions to conduct his risk calculations. Second difference, he changed a few “weighting factors” in his algorithm in order to reflect some of his newly acquired knowledge on different diseases. However, this weight factor change only reflects some nominal or insignificant changes on his risk probability percentages of having CVD or stroke.
The overall trend and significant levels remain the same as his
previous papers.
Figure 1 illustrates the background data table of his analysis
results.
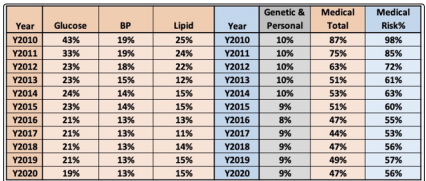
Figure 1: Background data table of CVD/stroke risk probability % based on medical conditions
Figure 2 shows the three contribution percentage line charts of glucose, BP, and lipids.
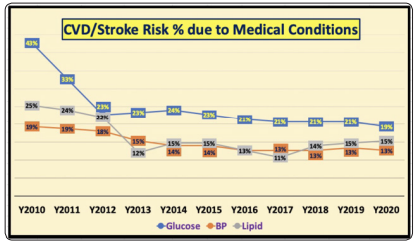
Figure 2: Contribution % of glucose, blood pressure, and lipids to CVD/stroke risk probability based on medical conditions
Figure 3 depicts the comparison of two sets of bar charts, where one bar set is the summation of contribution percentage of glucose, BP, and lipids, while the other bar set is the final CVD/stroke risk percentage based on medical conditions input.
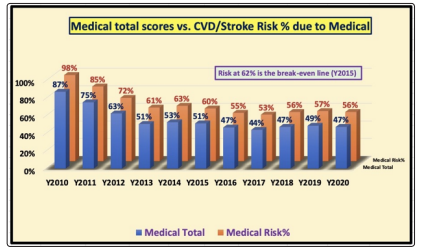
Figure 3: Comparison between total medical conditions contribution % vs. CVD/stroke risk % based on medical conditions
It should be noted that weight and waistline (being overweight or obese) have been included in the baseline category for personal long-term factors, because weight conditions similar to bad habits are difficult to change within a short period of time, similar to personal bad habits of smoking, drinking, and illicit drugs.
The established “pre-established targets” of his medical conditions are as follows:
Glucose: <120 mg/dL
SBP: <120 mm Hg
DBP: <80 mm Hg
Heartrate: >60 & < 100 bpm
Triglycerides: <150 mg/dL
HDL-cholesterol: >40 mg/dL
LDL-cholesterol: <30 mg/dL
Total cholesterol: <200 mg/dL
If the patients meets all of the above targets right on the point, they will get a “break-even” score of ~53%. Since no person would get a “perfect” score on his or her genetic factors and personal longterm factors, the author could provide an average score of ~10% for the worst-case scenario of 20%. As a result, the combined “break-even” risk probability percentage of having CVD or stroke resulting from medical conditions is 62%. If the risk percentage is higher than 62%, this indicates a higher risk. However, if the risk percentage is lower than 62%, this implies a lower risk.
All of his three curves in the contribution percentages from glucose, BP, and lipids are declining year after year due to the improvements on the control of his metabolic disorders via stringent lifestyle management program, where he completely stopped taking medication since 12/8/2015 (Figure 2). The three medical contribution percentage curves stabilized after 2013. His annual average glucose showed the most noticeable reduction from 43% of contribution (280 mg/dL) in 2010 down to 23% of contribution (133 mg/dL). From 2010 to 2013, he took high dosages of three different diabetes medications which was similar to the period prior to 2010; however, the major differential factors to reduce hyperglycemia was due to his awareness on the importance of his daily lifestyle by implementing a stringent lifestyle management program based on scientific evidence [4]
Based on the observations from above, the following information highlights his improvement on chronic diseases during the COVID-19 quarantine period from 1/19/2020 to 8/22/2020:
Weight: 172 lbs.
BMI: 25.0
Waistline: 33 inches
SBP: 108 mm Hg
DBP: 60 mm Hg
Heartrate: 59 bpm
Triglycerides: 110*
LDL-cholesterol: 123*
HDL-cholesterol: 49*
Total cholesterol: 168*
ACR: 19*
TSH: 2.66*
PSA: 110
Due to COVID-19, the author was unable to get the necessary medical examinations performed at a biomedical laboratory; therefore, the asterisk (*) next to the numbers is the average measured values in 2019.
Since 2012, the author kept detailed and completed data from the past 8.5 years. In 2010 and 2011, he could only use some spotted records for guesstimated results, but the data still represent his previous years’ situation accurately. The final calculated total medical condition scores and CVD/stroke risk probability percentage are descending year after year. Even though 2010 and 2011, involved guesstimated data, they were alarmingly high with 87% for total medical conditions score and 98% for CVD risk. This explains why he suffered many diabetic complications during this time. The “turning-point” was 2013 when his medical conditions score and CVD risk percentage decreased to 51% and 61%, respectively. Finally, during 2020, his lifestyle changed dramatically due to the quarantine impact on his diet, exercise, sleep, stress, daily routines, and so forth. In other words, he worked even harder to maintain his stringent lifestyle management program in 2020. Finally, his glucose contribution percentage broke the 20% barrier to reach 19% (Figure 2) along with the medical condition score percentage and his CVD risk percentage reduced to 47% and 56%, respectively (Figure 3).
Listed below is a table of his annualized risks probability percentage based on Medical Conditions of having CVD or stroke (Figure 3):
Y2010: 98% (weight 198 lbs., BMI 29.2, waistline 44 inches,
glucose 280 mg/dL)
Y2011: 85% (glucose 200 mg/dL)
Y2012: 72% (glucose 128 mg/dL)
Y2013: 61% - the year reached the break-even line of 62% (glucose
133 mg/dL)
Y2014: 63% (developed metabolism model, glucose 135 mg/dL)
Y2015: 60% (FPG control, glucose 129 mg/dL, stopped
medication)
Y2016: 55% (PPG control, glucose 119 mg/dL)
Y2017: 53% (BMI 25, glucose 117 mg/dL)
Y2018: 56% (heavy traveling, glucose 116 mg/dL)
Y2019: 57% (heavy traveling, glucose 114 mg/dL)
Y2020 : 56% (weight 172 lbs., BMI 25, waistline 33 in, glucose
109 mg/dL).
Due to his heavy travel schedules of attending more than 60 medical conferences from 2018-2019, his risk probability percentage increased from 53% in 2017 to 56% in 2018 and then 57% in 2019; however, during the recent stabilized quarantined life in 2020 actually assisted in lowering his risk back to 56% again.
It should be noted here that the risk probability percentages are expressed on a “relative” scale and not on an “absolute” scale. However, by keeping the “break-even” line of 62% in mind, one can quickly judge the different severe levels from the calculated CVD/stroke risk probability percentages.
This article describes the individual contributions from three medical conditions sub-categories (glucose, BP, and lipids) of different modeling associated with artery blockage and artery rupture scenarios, on the risk probability percentage of having CVD or stroke. His research results from the past 10+ years have demonstrated the importance of maintaining an excellent healthy state for the entire body via a stringent lifestyle program in order to reduce the risk of having CVD or stroke.
Emphasis have been placed on the significance and contributions from three sub-categories of specific medical conditions such as diabetes, hypertension, and hyperlipidemia along with weight and waistline, including the category of personal long-term factors, in a quantified manner. As a result, the findings are corroborated with the advice from healthcare professionals to their patients [5, 6].