Author(s): <p>R.Kandasamy* and Genanew Gofe</p>
The basic reproduction number (R0), is presented to be an indicator of the contagiousness or transmissibility of infectious and parasitic agents. On the inception of a covid-19 epidemic, there’s a period admitted as the the susceptible, exposed or infected duration, earlier than an affected person can spread the virus to every other person. We enhance mathematical fashions to file for this period and observe version to the covid-19 contamination in china. We take a look at the epidemiological constants within the version, such as the transmigration charge and the simple reproductive variety, the usage of statistics of launched cases. We therefore estimate the act of the inclined, exposed or latency length inside the symptoms of a covid-19 infection. Through this critical version giant range R0, has been used to count on the sphere of persons right now infected with the contagious human and categorized the intensity of prone, exposed, and infected populations as quickly because the infectious is over, it can be immediately used to degree the contaminated regions. Primarily based at the power of R0, inclined, uncovered, and infected human being’s price has been calculated through Runge Kutta Felhberg method, maple 18. By using this investigation, the susceptible human’s infectious rates from covid-19 are strongly multiplied because the infected human being’s price moves up and down and the uncovered humans price decelerates with the boom of the basic reproductive wide variety. The transmissibility of covid-19 infection is related to the respiration lack of information of conventional humans and global warming.
In (New England Journal of Me, 2020), it was reported that the transmission of the COVID-19 epidemic can occur in people with an infectious disease who have not yet responded as a symptom in (O-China J report)., 2019), it found that people affected by COVID-19 spread the syndrome and experience choking and fever, usually 5 to 6 days after the epidemic (5 to 6 days on average over 1 Up to 14 days). In (Yanget al., 2020), it was recorded that the meantime before the start of the index was 3 days, a least of 1 day, and a maximum of 24 days.It is noteworthy that these periods play a key role in the proliferation of COVID-19 Please refer to Tables 1-3 [1]. The basic reproduction numbers are a big difference in the results of infected virus design. We can assume that the infected virus has spread along a wave of infection, starting with the first confirmed cases. Suppose we have the base reproduction number of 1, in that case the spread would look like this [2-4].

Figure 1: Basic reproductive number on spreading of COVID 19 infected virus
Reproductive count has become the most commonly cited term in the current COVID-19 epidemic. This number, shown as R0, represents the number of new infections that a single infected person could cause in a vulnerable population. It is used to prove and explain why social distances and other relief strategies must be shut down to keep the number of cases and deaths in this outbreak low.If R0 is greater than 1, each infection will hatch more and more and more outbreaks will continue.If lower than 1, the outbreak will continue. But at a lower mortality because of fewer than 1 infected, according to corrections to previous cases by death or recovery [5,6]. Because of changes in the country, culture, type of calculations, and the R0 epidemic stage, they were reported to vary in magnitude. Although it is important but it seems to be complicated in obtaining precisely calculated values because of the limitations of the data and the inaccuracies of reporting.The first reported R0 came from Wuhan at 2.2 due to direct contact detection. It was questionable given the size of the case, which led to the breakdown of the healthcare system and inadequate testing facilities at that stage, and the development of case definitions. Even today, model selection, initial conditions, and other assumptions generate final calculations leading to a wide range of R0 from 2.2-3.6 to 4.1-6.5 [7].
The current study uses the SEIR model as a common channel model in epidemiological studies. Shows how disease progresses through four channels of interaction: Weak, Sensitive, Contact and Repairable. It depends on three parameters: the rate at which the vulnerable was exposed (β), exposure to infectious disease (α), and contagious recovery (γ). The last two were inversely related to the latent phase and Duration of infection, respectively. Latency is the time that an infected person could not be contacted, and the duration of contact is the time that an infected person can infect others. It can vary from 2 to 6 days and 3-18 days. This model has the most important characteristic of the epidemiological model, the transition from an exposed-sensitive state. This will change with the size of vulnerable and infected populations and the percentage of exposure between them and inversely proportional to the duration of contact [8-10].
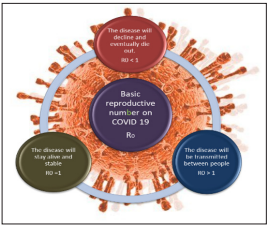
Figure 2: Basic reproductive number on COVID 19 infected virus
Within 45 days of the first COVID-19 reported in Europe on January 24, 2020, the outbreak affected all 27 EU countries, leading to the closure of all external borders in the EU. Within the next two weeks, local travel restrictions and closures will be followed by a 95% drop in international air travel in the EU. This has caused considerable disagreement, because of the lack. The current study aims to find the relationship between closure and changes in outbreak conditions. A dynamic SEIR model was used to reflect the percentage change in contact under the shutdown parameter. The model allows the exact R0 to be calculated in different conditions and the delay time between any social health measure and the impact on the epidemic. The latter is the key factor in deciding how to release the lock in a step-by-step manner, and to report the risks of each action [11-14].

Figure 3: Coronavirus highly infected countries in the world map
R (t), the effective diffusion number, is an important parameter in this model as it reflects the change in R0 (fundamental diffusion number) with time and mitigation strategy. The European R0 is at 4.5, the highest in Spain, France and Germany, with almost 6.0 and the lowest in Estonia, Slovenia and Malta, with around 1.4. The current effective reproduction number Rt is much lower with the EU average of 0.72, the highest in Slovakia, Sweden and Bulgaria at around 1.1, and the lowest in Austria, Cyprus and France at around 0. The relative decline in reproduction numbers was highest in Sweden, Hungary and Denmark, between 0.58 and 0.44.The delay time for air travel restrictions to reduce the effective reproduction rate ranges from 1 day in France and Luxembourg to 30 days in Malta, with an EU average of 13 days [15,16].

The SEIR model showed that herd immunity can infect approximately 78% if the reproductive count is 4.5.The dynamics models used here allow the exposure percentage change and help predict transient states far beyond the final herd’s immune balance. It can show big and swift changes as travel restrictions and social measures ease. But can be studied from this model. Effective changes in the number of reproduction can also measure the strength of public health measures to plan policies to control outbreaks. It also sheds light on the impact of public health interventions, especially travel restrictions, which France responded the fastest and Sweden the least. The duration of any observed impact on the transmission curve was the smallest in France in one day and the slowest in Sweden at 21 days [17-19].
Researchers are also using machine learning to assess massive amounts of data from the pandemic and to examine trends and relationships. For example, the most efficient reproductive numbers are produced in the EU. This is higher than the World Health Organization (WHO) figures cited from the early exposure detection study in Wuhan at 2.2, but is comparable to the current figure 5.7 for the Wuhan epidemic. The researchers set up three sets of conditions. One in which the current diffusion number Rt is constant at the effective spread number R (t); And two more reflect the impact of the transition from Rt to the base R0 reproductive number for that country, whether more than a month or over 3 months. Sweden does not enforce logins, and the number of reproduction numbers is still higher than 1 among the few European countries in the same situation. However, Sweden’s situation is unlikely to change if the current moderate guidance is removed, unlike the steep rises expected in other countries such as Austria following the cancellation of the closure. The difference lies in the willingness to take responsibility for the health of each person [20-23].
Because of this study, we are searching about the impact of fundamental reproductive variety on coronavirus: susceptible, exposed, and infected peoples are retrieved out with the aid of exploiting R. K. Fehlberg device with the backing of MAPLE 18. We will examine the role of basic reproductive number on COVID-19 infected virus, the duration of time in which freshly affected persons are asymptomatic and non-infectious. We illustrate the role of basic reproductive number on COVID-19 in Fig. 1. In the current article we establish mathematical designs to analyze the effect of the basic reproductive number on COVID-19 virus.
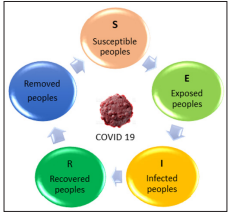
Figure 4: SEIR Mathematical model
The current study uses SEIR [21]] as a common channel model in epidemiological studies. Shows how disease progresses through four channels of interaction: susceptible, exposed, infectious, and recovered. It depends on three parameters: rate at which vulnerable people are exposed, exposure, becoming contagious, and contagious recovery. The last two were inversely related to latency and infection duration, respectively. The contamination that exists in infectious zones is aimed at renting a definable classification framework [21,22]. We think individuals in the region know that they are aware of many of these aspects, Sp,Ep,Ip,L1,L2,L3,L4,D1,D2 and R0. To be clear, we believe that populations in that zone are always allocated the same. (can be developed by separating some regions into a set of shorter regions with the same characteristics). We agree that reincarnation is an ineffective entity. We do not monitor international individual movements. We used the following mathematical design for the succeeding Susceptible-Exposed-Infectious-Recovered (SEIR) to calculate the Wuhan-infected virus as expected in December 2019 [21-23].
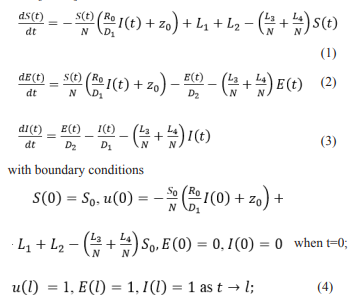
Assume that E=E0,I=I0 when t = 0; E=El , I=Il as t→l; with E(t)(E0-El)=(E-El), I(t) (I0-Il)=(I-Il), where S0 - Newly birth people,E0 - Exposed people before coronavirus infection, I0 - Infected people before coronavirus infection, El - Exposed people from coronavirus infection, Il - Infected people from coronavirus infection. L1 -International inbound air passengers, L2 -Domestic inbound passengers, L3 - Outbound International passengers, L4 - Domestic outbound passengers, D1 -Infectious period, D2 - Mean latent, R0 -Essential generative quantity, Z0 - The zoonotic strength of infectivity, N- Total number peoples. S(t)- Number of susceptible peoples, E(t)-Number of exposed peoples, I(t) – Number of infected peoples, R(t)- Number of detached entities at time t
Agree with the analysis project to illustrate the natural problems of people infected with the vulnerable coronavirus during the current dispute. It is appreciated to confirm this mathematical mechanism and scientific computing procedure, especially in solving physical or geometric multiplicity problems. We know that computational algorithms normally manipulate numerical software to solve several complex problems. But we need to know that each encryption software has verified the performance of the previous analysis. Coding systems for scientific research have been predicted problems. However, numerical mechanisms have been enabled to predict vulnerable, unprotected and sick citizens for practical efforts.
Let α, τ, and ς recognize that this is related to fragile, unprotected and infectious coronavirus rates. Complementing this product, the Runge Kutta Felhberg technique, which is underestimated to control the limit problems Dsolve has numbers, contains MAPLE 18. Efforts to approve u ‘(0), E’ (0) and I ‘(0) to α, τ and ς are predicted as v (0) = α, p (0) = τ and h (0. ) = ς with a link of trial and error. The numerical papers have proven that the number of vulnerable, unprotected and ill communities is caused by coronavirus infection.
Equations. (1) - (4) are remodeled as


An open and vulnerable set of infectious agents because of the numerical investigation of the corona virus and specific conditions. The scheme for equations (6) - (8) is not logically unraveling, and the situation-responsive mathematical explanation (9) is expected to be successful in passing the very important MAPLE 18. The software is based on the Runge Kutta Felhberg technique with a verified procedure to verify the math limit problem.
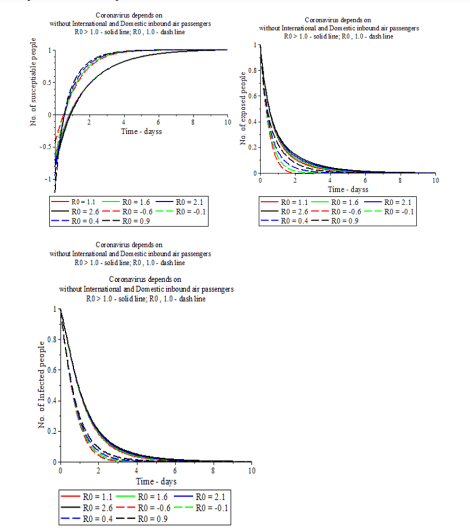

Figure 5: Impact of basic reproductive strength on International and Domestic inbound air passengers
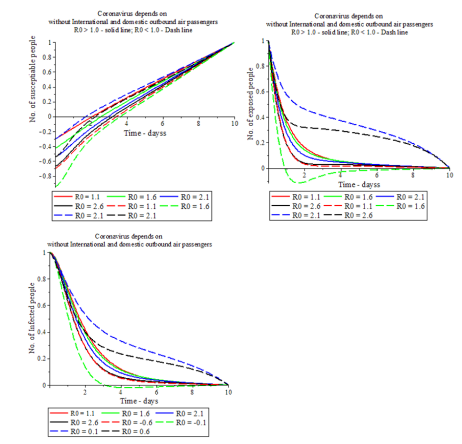

Figure 6: Impact of basic reproductive strength on International and Domestic outbound air passengers
Table 1: Rate of number of vulnerable, unprotected, and diseased peoples based on basic reproductive number and International and Domestic inbound air passengers
| L1, L2 Basic Reproduct | Rate of susceptible peoples | Rate of exposed peoples | Rate of infected peoples | Basic number |
| 0.5 | 0.587259 | 0.955505 | 0.533932 | R0 (= 2.0) > 1 |
| 1.0 | -0.086898 | 0.489511 | 0.54634 | |
| 1.5 | -0.808826 | 0.077908 | 0.560059 | |
| 0.5 | 0.755087 | 2.000090 | 1.000499 | R0 (= 0.0) |
| 1.0 | -0.251695 | 2.000090 | 1.000499 | |
| 1.5 | -1.258479 | 2.000090 | 1.000499 | |
| 0.5 | -0.081472 | 4.449052 | 1.000141 | R0 (= - 2.0) < 1 |
| 1.0 | -0.463802 | 4.798227 | 1.000135 | |
| 1.5 | -0.906565 | 6.266204 | 1.000187 |
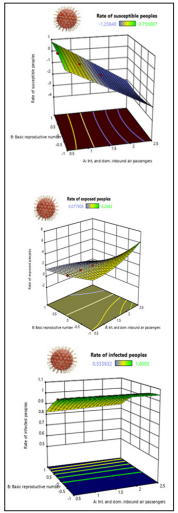
Figure 7: 3D graph of Basic reproductive strength effects on the zoonotic strength of COVID 19 infectivity
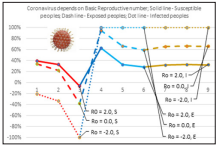
Figure 7: 3D graph of Basic reproductive strength effects on the zoonotic strength of COVID 19 infectivity
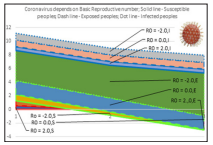
Figure 8: Basic reproductive strength effects on coronavirus infection
The effects of basic reproduction number, Ro on COVID-19 infection have been effectively described.The spread of vulnerable, touched and infected people is expected to be eliminated from COVID-19 infection and used to protect life, Figs. 5-8. The baseline reproductive rate is the biggest reason in reducing COVID-19 infection. It expresses what can happen when an infected person reaches a sensitive, open and fully infected target, so it is a milestone. The number of reproduction depends on the current population’s susceptibility to the COVID-19. Effective Ro moves from time to time and is determined depending on the environmental conditions achieved within the population. The main sign of COVID-19 is almost entirely based on the stiffness of the pulmonary respiration. All countries have introduced new travel regulations for arrivals and departures to curb coronavirus infection.
Absence of international and domestic arrivals:
• Number of vulnerable people for Ro < 1 first decelerates and then speed up while for Ro > 1 there is no significant change with increase of reproductive number.
• In the presence of Ro >1 and Ro < 1, number of exposed and infected people’s rate rise with increase of reproductive number.
• The density of exposed and infected people’s rate for Ro < 1 is stronger than Ro >1 with the rise of reproductive number.
• The forceful reproduction measure depends on the people’s recent susceptibility, explosions and infectivity, Fig.5.
International and domestic arrivals:
• In the occurrence of Ro >1 and Ro < 1, some susceptible people rate decelerates because exposed and infected people’s rate rise with increase of reproductive number.
• The intensity of vulnerable, uncovered and diseased people’s rate for Ro < 1 is stronger as compared to Ro >1 with rise of reproductive number because the reduction of reproductive number hit a powerful role on controlling the COVID-19 infection.
• Our research underline the shortage of Ro is a main task as to restrain the COVID-19 infected significantly, Fig.5. The controlling up of COVID-19 infection depends on the changes of Ro. Therefore, Ro is a powerful reason for estimating realistic situation within the population.
without International and domestic outbound air passengers,
• Number of vulnerable, revealed and infected people rate for Ro < 1 jumps down and up simultaneously because for Ro > 1, number of vulnerable, exposed and infected people rate decelerate with rise of reproductive number. The forceful reproduction measure depends on the people’s recent susceptibility, explosions and infectivity.
• Multinational and internal outbound air passengers are the major elements for controlling COVID-19 remarkably quick. The reproduction number (R0) is used to manage COVID-19 infection.
• The strength of vulnerable, uncovered and diseased people’s rate for Ro < 1 is more energetic as correlated to Ro >1 with grow up of reproductive number because the reducing of reproductive quantity act an efficient role on governing to control the COVID-19 infection, Fig.6.
• In the experience for Ro >1 and Ro < 1, some susceptible, exposed and infected people rate speeds up with the rise of reproductive number.
• The thickness of defenseless, revealed and contaminated people’s rate for Ro < 1 is stronger than associated with Ro >1 with rise of reproductive number because the reduction of reproductive number plays an important task on regulating the COVID-19 infection.
• From the Table 1, Figs.7 and 8, the rate of susceptible and exposed people decrease and infected people rate increase with increase of International and domestic, inbound air passengers when the high basic reproductive number, Ro = 2.0.
• When the small basic reproductive value (Ro = -2.0), the susceptible people rate cut, exposed people’s rate rise and finally the infected people’s rate reduces into small with enhance of International and domestic, inbound air passengers, Table 1, Figs.7 and 8.
• When the reproductive value is tiny, nearer to zero (Ro = 0.0), it is predicted that the rate of susceptible people cut quick and the rate of exposed and infected people are controlled with increase of International and domestic, inbound air passengers, Table 1, Figs.7 and 8.
• It is interesting to note that the exposed people from COVID-19 are a high increase of basic reproductive number, 3D graph, Fig.7.
All countries are ready to take special steps to wear masks at transport centers, seaports, and airports and border crossings to control the spread of COVID-19 infection. International and domestic arrivals and departures are key factors in the spread of the unusually fast COVID-19. The Reproductive Number (Ro) is used to control COVID-19 infection and to estimate the value of SEIR people caused by secondary COVID-19 infection.
Because of COVID-19 infection, we have identified a scientific investigation to cut COVID-19 infection. The infection of international and domestic air passengers was controlled by basic reproduction values and investigated through the Runge Kutta Felhberg strategy by MAPLE 18.
• Exchange of circumstances and decelerate COVID-19 transmission depends on reproductive number. This research depends on the impact of reproduction strength of infectivity. Infected people from COVID-19 because of International and Domestic inbound air travellers are also controlled by this output.
• The frequency of COVID-19 infection and expected infectious quality strongly depends on the modification of Ro.
• Whenever the reproductive value is decelerated into small, the infected populations will be decreased by tiny. Every period the reproductive value can further be diminished to tiny, so the number of COVID-19 infectious will slowly thin and eventually disintegrate.
Our research suggests the impact of reducing the COVID-19 infection transmissibility between the population at this moment.
The authors encompass their obligation to The President, Vice President Academic, and Dean of Natural Science, Salale University, Fiche, Oromia Region, Ethiopia.