Author(s): <p>Brahima Koné*, Bongoua-Devisme Affi Jane, Hien Marie-Paule, Coulibaly Kadjohoule Daouda, Koné Aminata, Julius Ndereme,<br /> Zakari Gnankamary, N’douba Elogne Mandela and Soro Nahoua Christophe</p>
Conventional Fertilizer Practice (CFP) has degraded the soil in lowland inducing acidification and yield decreasing (50-75%) after long term continues rice cropping. Phosphorus (P) application was suspected as main remediation factor. Therefore, the effect of rock phosphate from Morocco (RPM) was tested on rice (WITA 9) yield (RGY) with combination to Super Triple Phosphate (STP). Lowest yields (2.51-2.55 t/ha) were observed for T0a (Blank control) and 20% RPM. Moderate yields (3.32 -3.69 t/ha) were induced by T0c (CFP), 80% RPM and 100% RPM. The last and highest level of RGY range from 4.21 up to 4.26 under the effects of 90% RPM (4.21 t/ha), 60% RPM (4.24 t/ha) and 100%STP (4.25 t/ha). No significant effect of season was observed contrasting with cropping management effect. Almost the RPM rations induced greater rice grain yield (> 100%) than the blank control treatment (T0a): significant positive yield differences as yield gaps were observed in a range of 29% to 81%. In turn, only T3 (113.11%) and T5 (113.22%) induced significantly a similar effect referring to the yield of CFP (T0) and the grain yield was reduced about 13%. Using RPM in low-land rice production on Fluvisol look likes environment friendly agricultural input characterized by yield increasing over cropping cycles with residual effect up to 180%. The combination of 60% RPM to 40% STP applied once induced similar yield of 4.24 t/ha close to that of 100% STP which must be applied each cropping cycle. Therefore, the application of 60% RPM is recommended for improving low-land rice production on Fluvisol.
Because of water and high yielding rice varieties (6-10 t/ha) availabe for low-land rice cropping, there is high pressure in this agroecology which is thereby, recommended as rice basket in West Africa [1]. In Cote d’Ivoire, there is about 40,000 ha inland valley developed as irrigated lowlands the development is often limited to the principal canal allowing flooding irrigation with limited control [2]. Moreover, conventional soil fertility management (N-P-K and Urea) remained hazardous, impairing the sustainability of rice production [3]. As consequence, the depletion of soil fertility in lowlands was reported constraining rice production (2-4 t/ha) while coupled with soil acidification and low contents of soil cations [4-5]. This diagnosis was in line with the expansion of other nutritional disorder as iron toxicity in rice likewise phosphorus and potassium deficiency in second order valley encountered in Centre Cote d’Ivoire [6-7].
Organic amendment was tested by in Centre Cote d’Ivoire using rice straw incorporation into soil of lowland before rice transplantation: relative success was observed against iron toxicity occurrence while nutrient availability in soil was limited [8]. In the same line, silicon effect was also tested using sparingly kaolinite application to paddy as soil amender and nutrients (mainly Si and K) source [9]. However, phosphorus management strategy remained limited in this agroecosystem when excluding conventional fertilizer(N-P-K) already deemed worm fullness to soil heath [10-11] . Therefore, focusing in soil acidity alleviation may be advantageous in a broad range for building the sustainability of soil and rice production when adopting environment friendly practice.
Yet, soil acidity management as occurring after lime application is well known but it required heavy rates (1500-3000 kg/ha) hence, justifying its poor adoption in some extend [12]. Alternative solution was rock phosphate application to cropping soil: the use of rock phosphate (RP) about 400 kg/ha as from Togo source and that from Mali and Senegal was preferred [13-16]. However, limited yield (< 30%) increased was observed. Therefore, the need to improve rice yield with application of rock phosphate when comparing to that of the conventional fertilizer practice (CFP). On basis of the chemical composition of Marocco rock phosphate (27-46% P 2 O 5 , 1% SiO2 with almost 50% of CaO and MgO) and the slowness of RP, we can assume a mixed strategy (RP + CFP) to increase rice grain yield over 50%. Indeed, considering that 1tonne of paddy rice requires 11 kg P2 O5 the expected yield should be about 14-18 kg P2 O5 for 400 kg of morocco rock phosphate (MRP) witch includes the effect of 5 kg CaO (7kgCa/ton) [17].
Therefore, on-farm trial was conducted in second order valley in the guinea savanna zone (Centre) of Cote d’Ivoire using Marocco rock phosphate (MRP) and chemical fertilizer (CFP) treatments. The aim was to (i) identify the optimum combination of booth inputs, (ii) estimate the duration of MRP residual effect and (iii) to improve income of rice production.
The experience was lay out in a second order of valley as main lowland prototype in Guinea-savanna ecology. The locality of the study was nommed Tabako (8°60’ N ; 6°4 W) in extension of the valley of M’BE1 toward downstream. The experiment was conducted during six cropping cycles including three wet seasons and other three dry seasons along the border of the valley characterized soil fine sand (0-20 cm) as Fluvisol composed of 0.01% as nitrogen (N), 0.18 ppm as phosphorus (P-BrayII) and 0.008 cmol/kg as potassium (K) for a pH water ranging between 5-6 [18].
The rice variety named WITTA 9 (IR2042-178-1 x CT19) was transplanted after 2-3 weeks of nursery. It is a medium cycle duration (120 days) lowland rice variety among sativa which was released by Africa Rice Center in a joint collaboration between WARDA-IITA. Plant high is about 1-150 cm at maturity period recording about 200 tillers/m 2 . The potential grain yield is 8t/ha while on farm harvest was often about 4-6 t/ha in Cote d’Ivoire depending to agro-ecology. It is one of the most popular adopted rice variety in Cote d’Ivoire.
Chemical fertilizer was used during current experimentation as conventional source of nitrogen (N), phosphorus (P) and potassium (K): basal fertilizer as super triple phosphate-STP (Ca (H 2 PO4 )2H2 O) and the complex N-P-K (15% of each component) respectively coupled to urea characterized by 46% of N. Beside the chemical fertilizer, Morocco Rock phosphate was also applied combined with different rates of chemical fertilizer for a total rate of 300 kg/ha.
| Element | Unit | Profil | Min-Max |
|---|---|---|---|
| P 2 O5 | % | 27.46 | 27.04 - 27.68 |
| BPL | % | 60.00 | 59.1-60.5 |
| P2 O5 SC/P2O5T | % | 30.00 | min 30% |
| CO2 | % | 7.80 | 5.50-9.40 |
| SO3 | % | 1.68 | 1.60 - 1.70 |
| SiO2 T | % | 8.00 | 3,28 - 9.00 |
| CaO | % | 49.93 | 49.63 - 50.59 |
| MgO | % | 1.46 | 1.65 - 1.80 |
| Fe2 O3 | % | 0.20 | 0.18 - 0.28 |
| Al2 O3 | % | 0.41 | 0.33 - 0.55 |
| F | % | 3.36 | 2 - 7 |
| H2 O | % | 3% max |
A total land surface of 320 m 2 was cleaned manually using cattle and vegetation debris were raped out before soil flooding during three days preceding water drainage and soil tillage. The prepared land was splited in height microplots of 25 m2 (5 m x5m) separated by 1.5m using small dig of 1m in high for irrigation water conservation and microplot boundery (75cm of 1.5m). In a completely randomized block (CRB) design, the treatments of fertilizer were applied as described in table 2 considering 300kg/ha of P-sources. RPM was applied once against repeated application of chemical input (STP, NPK and Urea).
MRP and STP as well as NPK were incorporated into the soil during a second soil tillage before rice transplantation. Two-three weeks old of nursery rice plants were transplanted by 20cm x 20cm in dimension. Mixed methods of weeding was done applying chemical and manually practices before each application of urea.
At maximum tillering stage (21-30 days after germination), urea was applied completing N supplying to 40kgN/ha and other application of 40kgN/ha was done at boosting stage of rice after drainage.
| TREATMENT | P-source (300kg/ha) | NPK (kg/ha) |
UREA (kgN/ha) |
|
|---|---|---|---|---|
| RPM (%) |
STP (%) |
|||
| T0a | 0 | 0 | 0 | 80 |
| T0 | 0 | 0 | 200 | 80 |
| T1 | 100 | 0 | 0 | 80 |
| T2 | 90 | 10 | 0 | 80 |
| T3 | 80 | 20 | 0 | 80 |
| T4 | 60 | 40 | 0 | 80 |
| T5 | 20 | 80 | 0 | 80 |
| T6 | 0 | 100 | 0 | 80 |
The experiment (RCB) was repeated twice in different farmers’ fields during the wet season of 2019 while three were implemented during the dry season of 2000. Only a single on-farm trial (RCB) was laid out during the dry season of 2021 as the end of the experiment characterized by six rice cropping cycles.
The main data collected was the grain yield (RGY) which was
obtained at the maturity by harvest process. Panicles and tillers
were cut manually considering the inner area of 8m 2
apart from
25m2
of the micro plot of treatment. After three days of sun drying,
the grains were separated from the straw (panicles + tillers) and
submitted to oven dry (70°C) for 24 hours for determination of
moisture content (H) which must be adjusted to 14%. The grain
yield (RGY) was calculated by treatment
According to the Following Formulae:
RGY (t ha -1 ) = (Weigh of dried grain (kg)/ 8m2
) x (10000/1000)
x ((100-H) /86) [1]
Rice grain yield was reported according to the treatments for every
cropping cycle from 2019 to 2021.
The increase (%) of rice grain yield (IRGY) was calculated based
on the yield induced by conventional fertilizer practice and that
of no fertilizer:
IRGY (%) = (RGYt/RGYt’) x 100 [2]
Where,
t: Treatment applied; t’: T0 or T0a
The treatment effect was assessed on rice grain yield according to the season processing ANOVA coupled with SNK-test. A similar procedure was developed for different fields of farmers according to the treatments. Regressions were also processed as stewards using the Excel graph option to generate rice yield trends with the corresponding determinant (R 2 ). Regression analysis with SAS package (V9) subsequently used testing yield trend according to P-sources by season. The dependent mean value and root square mean error (RMSE) were considered as well as the F-probability and estimated parameters considering t-probability. The prediction was calculated based on a significant model structure adjusting the value by RMSE defined as:
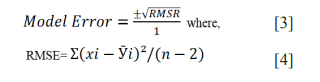
Considering (xi) as a mean value and y for the general mean value. Probability was considered for β = 0.10 to assess model fitness.
The treatment effects are assessed on rice grain yield considering the portion of applied as MRP assuming 100%STP for 0% RPM. The figure 1 is showing the rice grain yield mean values of the different treatments according the rate of RPM.
There is three major levels of rice yield (RGY): lowest level of 2.51-2.55 t/ha induced by T0a and 20% RPM. A moderate level (3.32-3.69 t/ha) includes T0c, 80% RPM and 100% RPM. The last and highest level of RGY range from 4.21 up to 4.26 under effects of 90% RPM (4.21 t/ha), 60% RPM (4.24 t/ha) and 0%MRPM (4.25 t/ha).

Figure 1: Rice Grain Yield and accrding to the ratio of MRP combined with STP
The low level (T0a and 20%RPM) of yield achieved is about 25% of the potential yield of WITA9 against 45% for the moderate yield level (T0c, 80%RPM, and 1000%RPM) and over 50% for the high yield level (100% STP, 60%RPM and 90%RPM).
| Season | Rice grain yield (t/ha) | |||||||
|---|---|---|---|---|---|---|---|---|
| T0a | T0 | T1 | T2 | T3 | T4 | T5 | T6 | |
| Wet season | 2.60a | 4.38a | 5.08a | 1.64a | 5.06a | 3.93a | 4.52a | 3.55a |
| Dry season | 2.51a | 2.95a | 3.71a | 3.09a | 3.71a | 3.52a | 4.01a | 3.16a |
| MG (t/ha) | 2.55 | 3.53 | 4.26 | 2.51 | 4.25 | 3.69 | 4.21 | 3.32 |
| CV(%) | 62.50 | 50.17 | 53.35 | 95.52 | 46.12 | 58.16 | 67.66 | 76.57 |
| P > F | 0.952 | 0.441 | 0.554 | 0.556 | 0.504 | 0.845 | 0.857 | 0.876 |
The same letters are indicating non-significant difference between them
No significant effect (P > 0.005) of treatment is observed according to the season consistently with high coefficient of variation (46.12% < CV < 76.57%). Nevertheless, lowest value of 1.64 (T2) is recorded during the wet seasons 2020 while 5.00 t/ha (T1 and T3) is also recorded as highest grain yield during the dry season 2021.
The effect of site or namely the effect of stockholder farmer (field management) on rice grain yield was also assessed as presented in Table 4
| Treatment | GY (t/ha) by farmer | ||
|---|---|---|---|
| Farmer 1 | Farmer 2 | Farmer 3 | |
| T0a | 1,94ab | 3,72a | 1,40 |
| T0 | 2,56ab | 5,29a | 1,92 |
| T1 | 3,61a | 6,29a | 1,49 |
| T2 | 1,16b | 4,39a | 1,44 |
| T3 | 3,84a | 5,99a | 1,58 |
| T4 | 3,03a | 5,40a | 1,56 |
| T5 | 3,27a | 6,65a | 1,21 |
| T6 | 2,14ab | 5,54a | 1,24 |
| MG (t/ha) | 2,69 | 5,41 | 1,48 |
| CV (%) | 18,95 | 27,89 | -- |
| P > F | 0,009 | 0,594 | -- |
Data does not much
Significant effect (P <0.05) of treatment is observed only for the first farmer (Farmer 1) recording significant lowest rice grain yield of 1.16 t/ha when applying the treatment T2 (90% MPR). However, there is moderation variation of rice grain yield (CV = 27.9%) under the control of Farmer 2. The general mean value recorded with the third farmer (Farmer 3) is lowest, about 1.48 t/ha.
Roughly, the treatment of 100% STP (4.26 t/ha) induced similar rice grain yield compared to that of 60%RPM (4.25 t/ha) regarding to the little difference of 0.01 kg/ha.
The proportions of rice grain yield differences induced by the rates of RPM compared to the blank (T0) and the conventional (T0a) controls are presented respectively in figure 2:

Figure 2: Mean of yield ration as induced by MRP treatment according to conventional (T0; CV = 32.72%; P = 0.035) an absolute (T0a; CV= 35.60%; P > 0.037) controls
Almost the RPM rations have induced greater rice grain yield (> 100%) than the blank control treatment (T0a). The yield gain (positive gape) is ranging significantly between 29% and 81%. In turn, only T3 (113.11%) and T5 (113.22%) induced significantly a similar effect referring to the yield of CFP (T0) while the yield is reduced (< 100%) for any other treatment.
Regarding to similar grain yield values recorded for booth sources of phosphorus (P), the grand mean values recorded each season were used to assess yield trend across cropping season when including intercept (Figure 3):
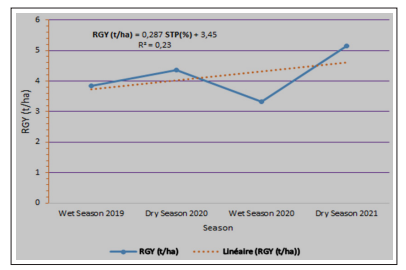
Figure 3: Grand mean trend across cropping season and year according to P-source (STP or RPM)
Linear trend of rice grain yield (3-5 t/ha) is observed from wet season in 2019 to dry season of 2021 as WITA 9 production. But, this trend has limited fitness regarding to the determinant value-R2 (0.23) low than 30% of the effective (56).
Therefore, a polynomial trend is tested on the same data set using scatter points with no curb between the effective. The equation and R2 value of the polynomial model is presented in figure 4 bellow. There is highest fitness of the polynomial trend according to the value of 91% for the R2 coefficient and the constant value (intercept) remains high corresponding to about 5 t/ha
imgnescientificresearch.com/fulltexrticle-1-img-5.png" />t-images/jwmrt-vol-1-issue-3-a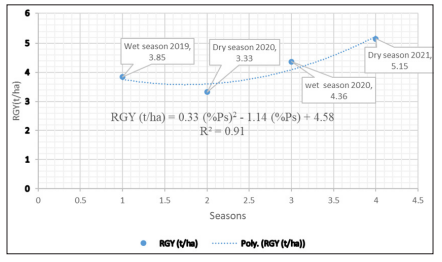
Figure 4: Polynomial trend of rice grain yield across cropping seasons from 2019 to 2021
More investigation is done in Table 4 about yield trend exploring data by analyze of regression using RGY as dependent variable and P-source (STP and RPM) for descriptive:
| RGY by STP (%) | RGY by RPM (%) | |||||
|---|---|---|---|---|---|---|
| Estimate | P>/t/ | Estimate | P>/t/ | |||
| Linear | Constant | 3.75 | 0.0001 | Constant | 3.70 | 0.0001 |
| Rate STP | 0.07 | 0.092 | Rate RPM | 0.005 | 0.128 | |
| P>F | 0.092 | 0.128 | ||||
| RGY-Mean(t/ha) | 3.88 | 3.88 | ||||
| Quadratic | Constant | 3.97 | 0.0001 | Constant | 4.05 | 0.0001 |
| Rate STP | 0.007 | 0.087 | Rate RPM | 0.06 | 0.092 | |
| Rate STP2 | 0.00 | 0.268 | Rate RPM2 | 0.00 | 0.187 | |
| P> F | 0.133 | 0.132 | ||||
| RGY-Mean (t/ha) | 3.88 | 3.88 | ||||
The constant value is always significant whatever the model and P-source. However, the rate of RPM is not significant (P = 0.128) in linear model against few significant level (P = 0.092; α = 0.10) of STP rate. There is also no significant effect of P-sources was observed for the quadratic trend of rice yield in spite of the significant (β = 0.10) contributions of the constant term (Estimate) and P-rate as first degree parameter.
Therefore, cubic regression was tested for the yield difference between that of RPM and that of the absolute control (T0a) one hand likely done with the conventional treatment (T0) in other hand. These differences were tested according the cropping cycle as presented in table 5:
| Cubic regression of yield difference (%) | ||||
|---|---|---|---|---|
| RPM-T0a | RPM-T0 | |||
| Parameter | Estimate | P>/t/ | Estimate | P>/t/ |
| Intercept | 422.38 | 0.0006 | -23.59 | 0.764 |
| Cycle | -498.75 | 0.0098 | 189.96 | 0.130 |
| Cycle 2 | 243.88 | 0.0058 | -84.10 | 0.147 |
| Cycle 3 | -34.66 | 0.0046 | 10.85 | 0.175 |
The cubic model is significant (P= 0.016) for the trend of yield difference between RPM and T0a and significant (t-Probability) for all the model parameters according to cropping cycle. In contrast, no significant probability accounts for the difference of the yield between that of RPM and T0.
The findings of the study under 300kg treatment of P-sources, showed low level (T0a and 20%RPM) of rice yield achieved by 25% of the potential yield of WITA9 against 45% for the moderate yield level (T0, 80%RPM and 1000%RPM) and over 50% for the high yield level (100% STP, 60%RPM and 90%RPM). Therefore, the observed yield gap was important under both sources of P during the current study. This finding underlines the weakness of phosphorus management regarding the current conventional practice supporting the need for improvement. The split of P-rate or applying micro-dose of P (Koné et al., unpublished) may be a concern in further studies regarding the expected coupled effect of CaO2 as supplied by RPM. Different research observed that there is a significant difference between the plant nutrition process of Ca and P [19-21].
However, the highest level of RGY ranged from 4.21 to 4.26 under effects of 90% RPM (4.21 t/ha), 60% RPM (4.24 t/ha) and 0%RPM (4.25 t/ha) over the national average paddy production of 2.3 t/ha [22-25]. In line with this study, Phosphorous application can be promoted to increase rice production in the country, especially when fused with the RPM.
Concerning the method of supplying Phosphorous, the treatment of 0% RPM as 100% STP with 4.25 t/ha of rice yield was subjected to the annual application (300kg STP/ha/an), almost similar paddy yield of 4.24 t/ha was induced by application of 60% RPM (T4) once. The findings of this study revealed that there is evidence of labor and input cost reduction when applying T4 compared to 100% SPT application. Therefore, the high performance of T4 is pointed out as the best practice of P-fertilizer application in low land rice cropping.
Furthermore, the majority of related studies P-tests were done in upland rice production [13-15]. This study was solely concerned with low land rice production, study was concerned with P and K interaction on Fluvisol which differs from the current study that involves the combined use of P-fertilizers, [7]. The current study pointed out P-fertilizer as an opportunity to increase the national rice production using 300 kg/ha P-sources combining 40% STP with 60% RPM.
Phosphate rocks from Togo and Mali were already pointed out as the best for promoting upland rice production in the forest zone of Cote d’Ivoire (Sorho et al., 2017) [14]. There is also a need and an opportunity to fill the knowledge gap to use and apply Morocco rock phosphate for low land rice production, especially on Fluvisol soils.
STP is composed of 38 -48% P2O5; 17-25% CaO and 12-22% SO3 against 27.46% P 2 O 5 ; 49% CaO and 1.68% SO 3 characterized by the RPM. There is the highest content of CaO in RPM supporting more P-uptake by rice when supplied by RPM. Yet, Mg-deficiency is widespread in the upland soil of Cote d’Ivoire and also highlighted rice symptomatic Mg-deficiency in Fluvisol of the Centre region (granite bed-rock) in Cote d’Ivoire [2-26]. Consequently, RPM may have contributed to replenishing soil Mg-stock over the application of STP. Based on soil cations equilibrium requirement for crop physiology, especially for P-uptake according to Ca/Mg ratio (Yates et al. (1967) have a chance to suspect more uptake of P-RPM than P-STP by rice. The effectiveness of PR was early and extensively studied exposing its’ dependence on the chemical and mineralogical compositions, the soil factors, and the growing crops [27-28]. In this line, the best chemical and mineralogical composition account for the treatment of 60% RPM. Moreover, for the experiment duration (4 seasons), 60%RPM represented only 15% RPM/Cropping cycle while 100% STP accounted for in the meantime. Therefore, the current study provided a solution to fill the gap observed between the yields of soluble P-sources and rock phosphate as mainly concerned by previous studies in rainfed rice agroecology. Therefore, a similar study needs to be conducted in upland rice production which is accounting for about 80% of national rice production [14-29].
Previous studies, in upland agroecology assumed a linear trend of rice grain yield across years highlighting the negative impact (slope) of the number of cropping seasons (year) using booth soluble-P (STP) and RP (Togo, Mali and Thies) except for Taiba RP with increasing slope over time[29]. Their result is contradicting the current results carried out in the lowlands regarding the increasing linear trend observed for booth P-sources regardless of being too significant for STP.
There was no significant difference observed between rice grain yields and the treatment for P-source (Ps), rice grain yield prediction was deemed similar. The prediction was limited by R2-value of 0.25 against 0.99 for the polynomial trend (RGY (t/ ha) = 0.33 (%Ps)2 - 1,14 (%Ps) + 4,58; R 2 = 0,91) according to P-rate. The prediction model project 4.5% of 300 kg/ha P-rate to achieve the target yield of 6t/ha. Therefore, there was a lower rate of P-source of 13.5 kg/ha of P-rate instead of 300 kg/ha applied during the experimentation process [30].
No cubic model was identified for the difference of rice grain yield between RPM and CFP while it was significant for that observed between RPM and T0a. The calculated yield gap showed a decreasing trend from 3 3 cropping cycle (182.73%) to the 6th (-1270%) according to the regression model [422.38 - 498.75 (Cycle) + 243.88 (Cycle2) - 34.66 (Cycle3)] and residual effect advantage can reach 111.22% during the 4th cropping cycle. Therefore, it appears that the small annual input of RPM estimated at 13.5 kg/ha had limited residual effect during four successive cropping cycles. This assertion justifies future investigation for testing the residual effect increasing of RPM when applying micro-doses of P. High level experts of rock phosphate suspected this option for environment safety and improvement of plant P-nutrition [31].
This paper discussed and highlighted more opportunities for RPM residual effect coupled with low input and environment safeguarding strategies to get high profits in rice cropping systems for low land Fluvisols [32].
Rock Phosphate from Morocco proved to be an environmentally friendly agricultural input in Fluvisols especially, for lowlands rice production. This was characterized by a high yield over the cropping cycle with a residual effect of up to 180% compared to the effect of no-fertilized soil. The combination of 60% RPM to 40% STP applied once induced a similar yield of 4.24 t/ha close to that of 100% STP applied each cropping cycle. The application of 60% RPM is recommended for improving low land rice production on Fluvisol.
Thankful to OCP-organization in Cote d’Ivoire for initiating the study and for their partial financial support.