Author(s): Shahadat Hossain, Helena Khatoon*, Mohammad Redwanur Rahman, Foujia Jamal, Zahidul Islam, Tashrif Mahmud Minhaz, Mohammad Ekramul Haque, Jinat Afruj and Nor Azman Kasan*
Nitrogen is one of the key growth factors and structural constituent of the cellular molecules of Nannochloropsis sp. This study aimed to determine the influence of nitrogen stress in the form of potassium nitrate (KNO3 ) by altering the standard recommended nitrogen concentration to characterize the growth performance, proximate composition, and pigments content. The nitrogen concentration was arranged in following order for the culture of Nannochloropsis sp.: 50 g/L, 75 g/L, 100 g/L (standard), 125 g/L, and 150 g/L of KNO3 . All growth parameters, proximate composition, and pigment contents showed significant (p < 0.05) changes among the treatments. Cell density was increased by 2.48 folds, SGR was increased by 56.9%, and cells were doubled in number at a pace of 12.192 hours faster at the maximum nitrogen concentration (150g/L KNO3 ). The maximum protein content was 54 ± 1.05% at 150 g/L KNO3 while the highest lipid content was 36 ± 0.32% at 75 g/L KNO3 . The highest carbohydrate content was 24 ± 2.51% at 100 g/L KNO3 . The chlorophyll a content was increased to 0.632 ± 0.049 µg/L at 150 g/L KNO3 , while the highest carotenoids content was 3.301 ± 0.052 µg/ml at the 75g/L KNO3 . On the other hand, phycobiliprotein content was the highest 0.028 mg/g for the standard concentration of KNO3 . This study provides the commercial cultivation strategy for Nannochloropsis sp. by revealing the biomass productivity, biochemical and bioactive compounds status at different nitrogen-based culture conditions that will ensure their multipurpose use in aquaculture, pharmaceuticals, and nutraceuticals sectors.
Microalgae are unicellular photosynthetic organisms capable of converting light energy, nutrients, and carbon dioxide (CO 2 ) into new algal biomass [1]. Microalgae can use CO 2 to produce many important bioactive compounds such as proteins, lipids, vitamins, polysaccharides, and pigments in presence of sunlight [2,3]. Only aquaculture has exploited microalgae with valuable qualities, and the composition of the algal biomass, including protein, lipid, and carbohydrate levels and quality, defines its entire economic potential [4]. In the aquaculture industry, many microalgae genera are used as a major nutrition source for herbivore larvae such as Tetraselmis sp., Chaetoceros sp., Isochrysis sp., Nannochloropsis sp., and Thalassiosira sp. [5].
Nitrogen is a critical nutrient for microalgal growth since it is required for the synthesis of amino acids, proteins, coenzymes, enzymes, chloroplast, and other cellular compounds. Microalgae can utilize a range of nitrogen sources (such as ammonia, nitrite, nitrate, and urea), and different nitrogen sources can alter their biochemical composition. More notably, different microalgal species were able to convert proteins or peptides to carbohydrates or lipids as energy reserve materials in 14 nitrogen-depleted circumstances [6]. Depletion of inorganic phosphate and nitrogen in the growth media can affect the accumulation of lipids in oleaginous algae, but it can also activate cell remodelling processes that break down membrane lipids and reconstruct fatty acids into triacylglycerol (TAG). When microalgae oils are used in food and feed, the redistribution of fatty acids across different types of lipids may affect the bioavailability of fatty acid chains [7]. Microalgal lipids are widely used in the development of alternative energy biofuels [8]. However, some studies found a negative relationship between lipid and carbohydrate yield under various environmental stresses (e.g., nitrogen depletion), owing to the close relationship between metabolic pathways and the production and depletion of energy-rich compounds like lipids and carbohydrates [9-11]. The fat-soluble carotenoids, chlorophylls, and water soluble phycobilin are the major pigments found in microalgae. Nitrogen stress on microalgae by reducing or enhancing in the culture media can influence the pigments availability in the cell as nitrogen is the backbone element of the chlorophylls structure, the carotenogenesis influenced by the nitrogen availability, and assimilable nitrogen in the microalgae cells assure the phycobiliproteins synthesis [12, 13].
Nannochloropsis is a genus of non-motile, single-celled, tiny green algae with a polysaccharide cell wall that can’t be seen under a microscope. They are high nutritional microalgae that have been widely used as a food supply in the aquaculture industry for hatchery grown herbivores, such as larval and juvenile bivalves, and it was recognized as the source for different valuable pigments, such as chlorophyll a, β-carotene and a large variety of xanthophylls such as zeaxanthin, canthaxanthin, and astaxanthin which was produced at high level [14, 15] . Nannochloropsis sp. also has a lot of potential as long-term feedback for biodiesel production since it can accumulate a lot of lipids as TAG, which can reach concentrations up to 65-70 percent of total dry weight [16].
The quantitative nitrogen availability in the culture media can induce growth and multiple cellular molecules biosynthesis processes like protein, carbohydrates, lipid biosynthesis, and pigments biosynthesis. Different studies found that, the synthesis of these biomolecules have different nitrogen quantity preferences in the culture media like lipid production accelerated at lower nitrogen concentrations and protein content more likely to increase at higher nitrogen concentration. For this, the commercially valuable microalgae, Nannochloropsis sp. was selected for this study to adopt different biomolecules production strategy at different nitrogen concentrations. Thus, the aim of this study was to investigate the growth rate, pigments, and proximate composition of Nannochloropsis sp. cultured in different nitrogen concentrations.
Inoculum for the culture was taken from a pure culture stock of Nannochloropsis sp. maintained by the Live Feed Laboratory under the Department of Aquaculture, Chattogram Veterinary and Animal Sciences University. The culture was maintained by using fluorescent light at 25 ± 2°C temperature range at150μEm 2 s -1 with continuous aeration by using air pump (SOBO-SB648A).
Conway media was used as a form of solution and added with the sterilized natural seawater. 1 ml of main minerals stock, 0.5ml trace metal solution and 0.1 ml of vitamins were added to 1000 ml filtered saltwater for each solution. The conway media was prepared firstly with the following the formula of [17]. Hence, main minerals stock solutions with 50 g/L KNO 3 , 75 g/L KNO3 , 125 g/L KNO3 , and 150 g/L KNO3 were prepared separately. Here the g/L of nitrate concentration resembled the concentrations in Solution A. The nitrogen stress was given to the Nannochloropsis sp. by modifying the concentration of KNO3 (Table 1) from the standard concentration. The concentration changes mentioned throughout the study was according to the concentration (g/L) of main mineral Solution.
| Components | Chemicals | Quantity |
|---|---|---|
| Main Mineral Solution |
Potassium nitrate (KNO3 ) |
50.00 g (T1
) 75.00 g (T2 ) 100.00 g (T3 ) (Standard) 125.00 g (T4 ) 150.00 g (T5 ) |
| Sodium EDTA (C10H16N2 O8 ) | 25.00g | |
| Boric acid (H3 BO3 ) | 33.40g | |
| NaH2 PO4 . 4H2 O | 20.00g | |
| FeCL3 .6H2 O | 1.30g | |
| MnCL2 .4H2 O | 0.36g | |
| Dissolve the chemicals up to 1000ml of distilled water | ||
| Trace Metal Solution | ZnCl2 | 4.20 g |
| CoCl3 .6H2 O | 4.00 g | |
| (NH4 )6 MO7 O2 .4H2 O | 1.80 g | |
| CuSO4 .5H2 O | 4.00g | |
| Dissolved the chemicals up to 1000ml distilled water | ||
| Vitamin Solution | Thiamine | 0.20g |
| Cyanocobalamin | 0.01g | |
| Dissolved the chemicals up to 100ml distilled water | ||
To make a pure culture, Nannochloropsis sp. was inoculated in 300ml culture media (Conway) to culture up to early stationary phase for growth curve experiment. The different nitrogen concentrations for the experiment were followed according to the Table 1. with three replicates. The cell density was determined daily to determine growth of Nannochloropsis sp. at different nitrogen concentrations.
Microalgae growth was measured through cell count daily using a Neubaer haemacytometer. The total number of cells was calculated using the following formula:

Here,
10 is the number of squares counted in 2 chambers
4x10 -6 is the volume of samples over the small squares area which is equivalent to 0.004 mm 3
(0.2x0.2x0.1) expressed in cm3
(ml).
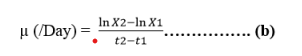
The obtained cell count data with different days were used to determine the Specific Growth Rate (SGR). SGR, μ was calculated using the following formula:
Here,
μ = growth rate of per unit cell concentration,
X1 = cell concentration at the beginning of experiment (t1)
X2 = cell concentration at stationary day (t2)
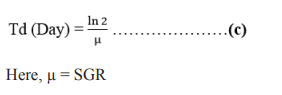
Cell doubling time (Td) was calculated from the obtained μ (SGR). Td was calculated using the formula [18]:
Protein content was determined by using 5 mg of freeze-dried microalgae according to the techniques of [19]. For the analysis, 5 mg of dried microalgae was dissolved in up to 25 ml of distilled water. Then, 0.5 ml microalgae solution was mixed with 0.5 ml 1N NaOH and kept in 100 °C water bath for 5 minutes and cooled in a water bath. After that, 2.5 ml of mixed reagent, prepared by mixing 50 ml of reactive 1 (1%NP tartrate) and 1 ml of reactive 2 (2g Na 2 CO 3 dissolved in 100ml of 0.1N NaOH), was added to the cooled microalgae mixture. Then the solution was mixed with 0.5 ml folin solution and kept in a dark place for 30 minutes. The spectrometric reading of the final solution was taken at 750 nm wavelength using a spectrophotometer (UV-1601, Shimadzu) and the absorbance reading of the sample solution was found as concentrations against the series of standard solutions (0 mg/L, 20 mg/L, 40 mg/L, 60 mg/L, 80 mg/L, 100 mg/L) of BSA (Bovine serum albumin).
Carbohydrate was determined by using 5 mg of freeze died microalgae according to the techniques of [20]. For each sample, 5 mg was taken and made into 25 ml solution by mixing with distilled water. Prior to analysis, 5% phenol solution and concentrated sulfuric acid was prepared. For analysis, 1 ml was taken from the prepared 25 ml solution and 5% phenol solution and 5 ml of sulfuric acid was added. Then, the sample was kept in the cold-water bath and reading was taken with spectrophotometer (UV-1601, Shimadzu) with wavelength at 488nm. 1000mg/L of standard stock solution was prepared and a series of standards at various dilution (20mg/L, 40mg/L, 60mg/L, 100mg/L, and 140mg/L) were also prepared from the stock solution to produce a calibration graph.
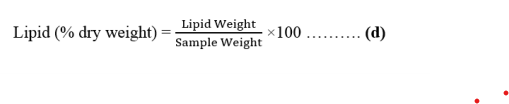
Lipid was determined where 50mg of sample was diluted with 5x volume of distilled water and homogenized with 3ml of 2:1 methanol: chloroform (v/v) using a tissue homogenizer [21, 22]. The homogenized sample centrifuged at 10000 rpm at 4°C for 4 minutes. The supernatant was transferred into a centrifuge tube and placed in ice. The sample then homogenized again with (1:2) methanol: chloroform (v/v) and centrifuged Each sample’s aluminum dish was labeled and weighed as the starting weight. Then, with distilled water, 50 mg of each sample was placed in a centrifuge tube and diluted into a 5x volume. The material was then homogenized with 3 ml 2:1 methanol: chloroform (v/v) at 10000 rpm at 4°C for 4 minutes. The supernatant then mixed with 1.5ml 0.9% NaCl and stored at 4°C for 1h. The mixture centrifuged again at 1000 x g for 10 minutes at 4°C and two layers formed. The upper layer was discarded, and lower layer was transferred into pre-weighted aluminum dish. The sample containing lipid was evaporated in a hot air oven at 4°C for 1h and the lipid content was calculated using the following formula after taking the final weight of the aluminum dish.
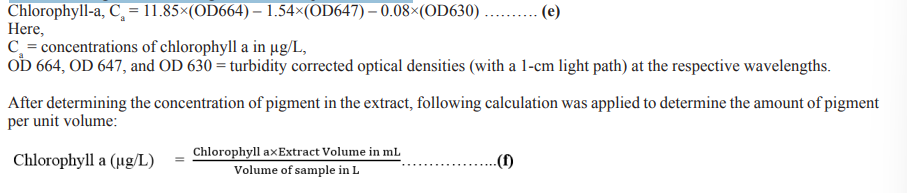
For chlorophyll an extraction, 10 mL of each sample was filtered and then the sample volume was adjusted up to 10 mL with 90% aqueous acetone solution. Chlorophyll a was determined according to [23]. The clean extract was transferred to a 1 cm cuvette and the optical density (OD) was measured at 750, 664, 647 and 630 nm. OD 664, 647, and 630 were used for chlorophyll determination where OD 750 nm was used as turbidity correction factor. This value was subtracted from each of the pigment OD values of the other wavelengths before using them in the equations below:
At the stationary phase of each culture, 1 ml aliquot of the microalgae suspension was collected. The sample was then centrifuged for 5 minutes at 1000 rpm to obtain a pellet. The pellet was then extracted with 3 mL of ethanol: hexane (v/v) in a 2:1 ratio. The pellet with the solvent was shaken vigorously and centrifuged at 1000 rpm for 5 minutes. As a result, the hexane layer was separated, and its absorbance was measured with a spectrophotometer at 450 nm. By multiplying the absorbance (A 450) by 25.2, the number of isolated carotenoids from the samples was calculated in micrograms [24].
The concentration of phycocyanin (PC), phycoerythrin (PE) and allophycocyanin (APC) in the sample was measured by spectrophotometer (UV-VIS Double beam, Model-T80, HANNA) and using equations and the extinction coefficients from as follows [25]:
The data were analyzed by one-way analysis of variance (ANOVA) comparing the different concentrations of N accompanied by a significance level of 95% (p < 0.05) along with the Tukey multiple comparisons test (where applicable). Normality and heteroscedasticity of the data were checked prior to the analysis. Graphical representation of the growth specifications and biochemical compositions (% dry weight) for different treatments were analyzed by Origin V8, Microsoft Office 2016 and SPSS software, respectively. All the outcomes have been represented as average ± standard deviation.
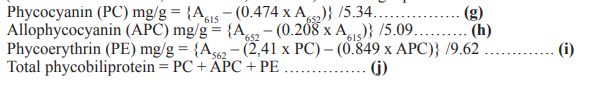
The growth performance of Nannochloropsis sp. was assessed using cell density (CD) as major growth variable at various nitrogen concentrations (50 g/L, 75 g/L, 100 g/L, 125 g/L, and 150 g/L KNO 3 ). .5 x 10 5 cells/ml Nannochloropsis sp. was inoculated at each of the treatments. The cell density was determined to evaluate the growth curve of the microalgae in different treatments. Microalgae growth stages are found as lag phase, log, or exponential phase, reducing growth rate phase, stationary phase, and death phase. T1 required 13 culture days, T2, and T3 took 14 days T4 and T5 took 10 culture days to exhibit all the growth phases. Nannochloropsis sp. cultured in Conway media showed similar growth phases [26]. The cell densities were changed significantly (p<0.05) at exponential and stationary phases. T5 had the highest cell count (35.87 x 10 6 cells/ml; 72.13 x 10⁶ cells/ml), while T2 had the lowest cell count (12.6 x 10⁶ cells/ml, 20.93 x 10⁶ cells/ml) in the exponential and stationary phases respectively. However no significant differences (p>0.05) were observed in the log phase, lag phase and stationary phase among the treatments.
Microalgae, cultured in a higher concentration of nitrogen are began to grow faster (T4, and T5), resulting in a shorter lag phase, entry into the log phase after the first culture day and exponential growth from day 2 to day 7. However, delayed log phase was seen in the lower nitrogen treatments (T1 and T2), as well as in the standard nitrogen treatment (T3). That is because the nitrogen deficiency in culture media inhibits cell growth, while nitrogen repletion in culture media promotes cell growth. The relationship between nitrogen concentration and cell density was also reported and the study found the nitrogen limitation in the culture environment can decrease the cell density of microalgae [27].
Specific growth rate (SGR) and division rate of Nannochloropsis sp. were calculated using the highest cell density of Nannochloropsis sp, that was found at the stationary phase. The values of SGR in the experimental units with 50-150 g/L KN3 ranged from 0.431 μ/ day to 0.772 μ/day during the stationary phase. When the nitrogen concentration was 125 g/L and 150 g/L, the SGR was increased by about 50.2 % and 56.9%, respectively (Table 2). The SGR of T1 and T2 was much lower than the nitrogen rich treatments but the changes of SGR due to the lower nitrogen treatment was not significant (p>0.05) with the standard nitrogen treatment (T3). It is indicating that nitrogen deficiency was not a growth limiting factor for T1, and T2 that is also reported by [28]. Besides, the SGR increasing and decreasing trend with nitrogen concentration completely mirrors the findings of [29].
It is certain that the faster the growth the slower the division rate and for that the cell doubling time and SGR are inversely proportional. In this study, T4 took 0.898 days whereas T2 took 1.547 days to double cell number which indicates slower cell division rate of T2 treatment. The cells at the highest nitrogen concentration (T5) required 12.192 hours less than the standard treatment (T3) to become double in number. Higher SGR and lower division rate were seen in nitrogen-rich treatments that was an indicator of rapid microalga growth. The study of [29] reported a similar result for the growth rate on the microalgae Isochrysis galbana, which showed a higher growth rate of 1.23/ day at a higher nitrogen concentration of 144 mg/L.
| Treatment | SGR, μ day -1 | Cell Doubling Time (Day) |
|---|---|---|
| T1 | 0.431 ± 0.003 | 1.535 ± 0.0015 |
| T2 | 0.492±0.002 | 1.409±0.0048 |
| T3 | 0.477±0.007 | 1.453±0.019 |
| T4 | 0.739±0.003 | 0.937±0.003 |
| T5 | 0.772±0.003 | 0.898±0.003 |
So, Nannochloropsis sp. can develop rapidly, more quickly, and in less time to double their cells when exposed to higher nitrogen concentrations than the standard nitrogen concentration.
Protein, lipid, and carbohydrates are the main cell components of microalgae, making up 60-85% of dry weight [30, 31]. The proportion of these components in the cell is rarely changed, unless the cell physiological system is forced to degrade protein and accumulate carbohydrates, lipid contents due to a stress factor, such as nitrogen limitation [32, 33]. In the present study, T1 (50 g/L KN3 ), T2 (75 g/L KNO 3 ), T3 (100 g/L KNO3 ), T4 (125 g/L KNO3 ), and T5 (150 g/L KNO3 ) shown 90%, 97%, 93%, 98%, and 99% total proximate composition in dry weight, respectively.
Nitrogen is the building block of protein and the availability of nitrogen for cells ultimately induces the protein synthesis. Different types of proteins play an important role in the cell cycle of microalgae, where the higher protein content in microalgae cells promotes cell division [34]. Figure 2 depicts the effect of different nitrogen concentrations on the proximate composition of Nannochloropsis sp. In this study, protein content was ranged in between 35% to 54% for all the treatments. The highest protein content (54 ± 1.05%) found at T5 treatment (150 g/L) and the lowest protein content (35 ±1.92%) found at the T1 treatment (50 g/L) whereas the standard nitrogen treatment, T3 (100 g/L) showed 47 ± 2.51% protein content. [35] found the similar findings for standard treatment in Nannochloropsis sp. cultured under the same physicochemical and environmental conditions. The protein gain was 7% (from the protein content in the standard treatment) for the 50% enrichment of nitrogen concentration but the protein loss was bit higher, 12% for the 50% reduction of nitrogen concentration in the culture system. Similar results were found for the species Acuitodesmus obliquus, Ankistrodesmus sp., and Chlorella lewinii, which showed higher protein content 12.8%, 14.5%, 31.2% in nitrogen-rich conditions and lower protein content 9.7%, 10.5%, 14.2% under nitrogen-depleted conditions Euglena gracilis protein content was higher at higher nitrogen treatment in the study of [36, 37].
Nutrient stress like, alteration of nitrogen concentration can change the carbon flow in photosynthesis in various ways to channel the energy of metabolism into carbohydrates and lipids synthesis [11]. The nitrogen deficiency in the culture environment hampers the photosynthetic capacity of microalgae but continuous carbon fixation does not stop. It makes the availability of carbon in the cell that is converted into storage compounds like lipids and carbohydrates [31]. In this study, the carbohydrate content ranged from 13 ± 0.68% to 24 ± 2.51% for the nitrogen concentration alteration throughout the experiment. The highest carbohydrate content was 24 ± 2.51%, found for the standard treatment (T3) and the lowest carbohydrate content was determined at 13 ± 0.68% for the treatment T5 (150g/L). The carbohydrate content in this study was not much altered with the nitrogen depletion and repletion. The nitrogen rich treatment showed a gradual reduction of carbohydrates from 24% for T3 to 13% forT5. The significant changes (p<0.05) in carbohydrates among the treatments were observed between T3, and T5 and between T1, and T5. The nitrogen-reduced treatments and the nitrogen-rich treatments both were determined to lower carbohydrate content (Figure 2) in the cells. The carbohydrate content changes at different nitrogen did not reflect the previous similar studies. Nitrogen limitation as an effective technique for increasing carbohydrate content in Tetraselmis subcordiformis and Chlorella vulgaris respectively [38, 39].
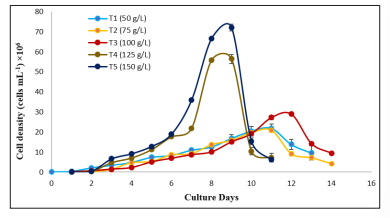
Figure 1: Effects of different KNO 3 concentrations on the growth of Nannochloropsis sp.in terms cell density (CD). Values are mean ± standard error
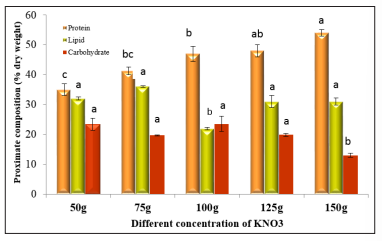
Figure 2: Proximate composition of Nannochloropsis sp. under different KNO 3 concentrations. Values are mean ± standard error
When the protein changes were correlated with specific growth rate (SGR) (Figure. 3a), Nannochloropsis sp. daily growth was found proportionately related with its protein content in the cell. The availability of nitrogen in the culture system increased the protein content in the cell that boosted the growth rate of Nannochloropsis sp.
In this study, lipid content was changed with the nitrogen concentration (p< 0.05). The highest lipid content was found 36 ± 0.32% at treatment T2 (75 g/L) and the lowest lipid content was found 22 ± 0.42% at treatment T3 (100 g/L). The nitrogen starvation stimulates the lipid synthesis in microalgae cells that was discovered in the study of where 1, 2 and 3-days nitrogen starved condition the species Acutodesmus dimorphus showed an increasing trend in lipid content [40]. The 25% increased and reduced nitrogen treatment showed significantly (p< 0.05) higher lipid content that was 36 ± 0.32 %, and 31 ± 0.4 %. For T2, and T4 respectively. However, the 50% increasement, and reduction of nitrogen concentration was not significant (p>0.05) for the lipid changes. The microalgae Chlorella pyrenoidosa also exhibit this pattern when cultured under conditions of both nitrogen depletion and enrichment [41]. In another study, the species Picosystis salinarum had almost 12.64% more lipid content when cultured at very low nitrogen concentration (0.125N NaNO3 ) than in the nitrogen rich treatment (1N NaNO3 ) [27]. Nitrogenstarved conditions for producing more lipid content for biodiesel production are a well-established technique, but this study found a major obstacle for this technique, and it is the lower growth rate of the microalgae Nannochloropsis sp. in the lower nitrogen concentrations.
The correlation of lipid content with SGR at different nitrogen concentration indicating that the lipid content was higher when the cells were growing slowly (Figure. 3b). For example, the cells in T2 were growing at a rate of 0.448 day -1, was determined with the highest lipid content (36%) in this study. So, lowering nitrogen treatment may be an effective technique to obtain higher lipid from Nannochloropsis sp., but the lower growth rate of cell due to nitrogen stress must need to be considered
Figure 3: Correlation of a) Protein % dry weight (DW) and b) Lipid % dry weight (DW) with specific growth rate (SGR) at different KNO3 concentration (50g/L, 75g/L, 100g/L, 125g/L, 150g/L)
Pigments are chemical compounds that absorb light energy at different wavelengths and can produce colors. The main pigments found in microalgae are phycobilins, chlorophyll, and carotenoids [33]. Modification of nitrogen in the culture media can alter the pigments concentration as nitrogen is one of the most important elements of pigments. In this study, the variations in pigments composition of Nannochloropsis sp. (chlorophyll a, carotenoids, and phycobiliproteins) was considered at different nitrogen concentrations
The highest concentration of chlorophyll a (Table 3) was determined 0.46 μg/L at T3 treatment. There were no significant relations (p>0.05) found between nitrogen stress and chlorophyll a concentration. When Nannochloropsis sp. cells were cultured at 125 g/L (T4) nitrogen concentration (25% more than standard), the chlorophyll a content was 0.63 ± 0.049 μg/L. This is 36.97% higher than the chlorophyll a content in the standard treatment 0.460 ± 0.017 μg/L. On the other hand, 50% addition of nitrogen concentration (T5) showed a 15.08% loss of chlorophyll a content (0.535 ± 0.059 μg/L) than the T4 (125g/L) treatment, but 14.01% more chlorophyll a was found than the standard treatment 0.46 ± 0.017 μg/L. Nitrogen rich environment for microalgae significantly increases the chlorophyll-a content [42]. In addition, higher N/P ratio (32:1) in the culture environment of Dunaliella tertiolecta were determined with higher chlorophyll content (2.30 mg/L) than the lower N/P ratio (1:1), Although nitrogen rich treatment showed a significant gain of chlorophyll a but the nitrogen depleted treatments showed no such significant (p>0.05) changes from the standard treatment [43]. The chlorophyll a content was reduced from 0.460 ± 0.017 μg/L (100 g/L) to 0.361 ± 0.001 μg/L (75 g/L KNO3 ) and 0.332 ± 0.024 μg/L (50 g/L) at lower nitrogen treatment. The potential reason of that response of microalgae cells is the limitation of nitrogen. The chlorophyll content is formed by nitrogen atom, and when the nitrogen is starved, the situation is unable to fulfill the demand structural component, which causes the chlorophyll production rate to fall [44].
Table 3: Chlorophyll a (μg/L) and carotenoids (μg/ml) concentrations of Nannochloropsis sp. under different KNO3 concentrations. Values are mean ± standard error and values of each column with different letters are significantly different (p < 0.05)| Treatment | Chlorophyll a (μg/L) | Carotenoids (μg/ml) |
|---|---|---|
| T1 | 0.3325 ± 0.024c | 2.9652 ± 0.209a |
| T2 | 0.3613 ± 0.002c | 3.3012 ± 0.052a |
| T3 | 0.4597 ± 0.017bc | 1.9320 ± 0.222 b |
| T4 | 0.6316 ± 0.049a | 3.1668 ± 0.017a |
| T5 | 0.5345 ± 0.059 ab | 3.2256 ± 0.365 a |
Carotenoids have a major role to act against the stress due to oxidation of cell that cause cell cycle arrest. In this study, the carotenoid concentration was not significant (p>0.05) among the treatments. The highest carotenoids 3.30 ± 0.052 μg/ml were found at T2 treatment (75g/L) and the lowest carotenoids were found 1.93 ± 0.222 μg/ ml at T3 treatment (100g/L) treatment (Table 3). The carotenoids content was in increasing trend, regardless of whether the nitrogen was increased or reduced from the standard treatment (T3). The carotenoids changes in this study was similar with the two different studies, stated that the β-carotene, a component of carotenoids, of Dunaliella salina was 4 times higher at nitrogen starved condition [45]. On the other hand, [29] found that, nitrogen rich treatment had an impact on storing carotenoids in Isochrysis galbana.
Microalgae degrade nitrogen rich phycobiliprotein to persist during nitrogen stress derived condition in their environment [46]. It indicates the possible phycobiliprotein enriched situation in the cell at higher nitrogen concentration. The changes in the concentrations of phycocyanin, allophycocyanin, and phycoerythrin in Nannochloropsis sp. due to changes in nitrogen in the culture environment are shown in Figure 4 and Figure 5. The highest concentration of phycobiliproteins 0.0287 ± 0.0007 mg/g was found at T3 (100 g/L) treatment. The nitrogen reduction from 100 g/L to 50 g/L showed significant changes (p<0.05). The phycobiliproteins rose from 0.0066 ± 0.0001 mg/g to 0.0153 ± 0.00007 mg/g after switching from the reduced nitrogen treatment T1 (50 g/L) to a mostly enriched nitrogen treatment T5 (150g/L). It indicates a direct relationship between phycobiliproteins and nitrogen concentrations in culture media.
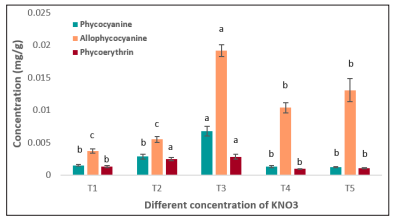
Figure 4: Phycobiliproteins concentrations of Nannochloropsis sp. under different KNO 3 concentrations. Values are mean ± standard error
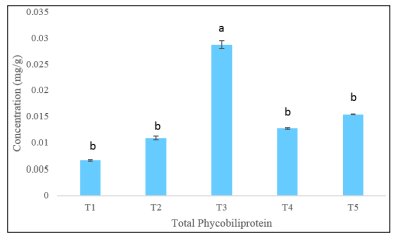
Figure 5: Total Phycobiliproteins concentrations of Nannochloropsis sp. under different KNO 3 concentrations. Values are mean ± standard error
Phycocyanin concentration was the highest at T3 treatment and the addition of nitrogen to T5, 150g/L caused significant loss (p< 0.05) of the pigment by 82.09% (0.0067 to 0.0012mg/g) and the T2, and T1caused phycocyanin loss by 57.77% and 77.6% respectively. On the other hand, allophycocyanin was also highest at T3 treatment. 25% addition of nitrogen (T4) with the standard treatment showed reduction of allophycocyanin from 0.019 mg/g to 0.00104 mg/g and after that, another 25% nitrogen addition with T4 showed a little increase from 0.0104 to 0.0131 mg/g although the change was not significant (p >0.05). For the nitrogen limited treatment, the allophycocyanin was decreased at a greater rate and the T1 treatment showed 84.21% reduction of allophycocyanin concentration.
For the phycoerythrin, the lowest concentration was 0.0009 mg/g found at the T4 treatment. The phycobiliprotein production is basically suggested to be followed by two steps, i) cultivating the microalgae at optimum culture condition and ii) stressing the microalgae through different environmental stress like nitrogen limitation to induce the synthesis [47]. The nitrate as a source of nitrogen for microalgae cells contribute to the production two different molecules, one of them is the biosynthesis of heme which produce phycobiliproteins [48]. For that nitrate reduction or addition in the culture environment can alter the total phycobiliproteins. In this study the phycobiliprotein are found highest at the standard nitrogen concentrations and the nitrogen repletion or depletion showed lowering trends for all the phycobiliprotein compounds.
The present study reveals that nitrogen depletion and replenishment in the culture environment can improve the growth performance, proximate composition, and bioactive substances of Nannochloropsis sp. The addition of nitrogen to the culture environment improved growth performances such as cell density, SGR, and cell doubling time. The growth phase analysis depicted that the level of nitrogen concentrations in the culture can slower or faster their growth stationary phase. In the presence of additional nitrogen, cells enhanced protein synthesis, while in the lower concentration of nitrogen, cells stimulated lipid synthesis. The nitrogen availability in the culture environment increased the chlorophyll a content. On the other hand, the stress treatment both the depletion and repletion of nitrogen increased the carotenoids level while downfall the phycobiliprotein contents. To sum up, N was a key factor in the growth and production of cellular molecules in Nannochloropsis sp. This study described how Nannochloropsis sp. cells respond to nitrogen stress and what happens inside the cells as they do so. This research will aid the fish, feed, and pharmaceutical industries efficiently using Nannochloropsis sp. to increase fish growth, feed quality, and medicinal difficulties relating to bioactive substances.
This study was supported by the Krishi Gobeshona Foundation Project ID: TF 100-F/21 and Chattogram Veterinary and Animal Sciences University through University Grant Commission, Bangladesh. The authors would like to express appreciation to the Microbiology and Diseases Laboratory, Faculty of Fisheries, Chattogram Veterinary and Animal Sciences University for providing laboratory facilities for this study.