Author(s): <p>Gerald C. Hsu</p>
This paper discusses the author’s biomedical research work based on the GH-Method: math-physical medicine (MPM) approach over the past decade. This is significantly different from the traditional medical research using biochemical approach and simple statistical methods. He uses his own type 2 diabetes (T2D) metabolic conditions as a case study including several application examples as illustrations and explanations of the MPM methodology
The MPM methodology will be described, then followed by 10 application examples to show how he applied his knowledge and disciplines in mathematics, physics, engineering modeling, computer science tools, and psychology during his 10-years of biomedical research, especially in the domain of lifestyle, metabolism, chronic diseases, diabetes, cardiovascular diseases, and renal complications.
The following list highlights the math-physical concepts, theories, principles, or equations used in the 10 application examples:
1. Topology, finite element method
2. Time-domain analysis, correlation and regression model,
pattern recognition, segmentation analysis
3. Signal processing, trial and error method, regression analysis
4. Artificial intelligence (AI) auto-correction, quantum
mechanics, safety margin of engineering design
5. Optical physics, AI, perturbation theory of quantum mechanics
6. Wave theory, Fourier transform, frequency-domain analysis
7. Structural engineering modeling, solid mechanics (both
elastic and plastic), fluids dynamics, energy theory
8. Pattern recognition, behavior psychology
9. Spatial analysis, time-series analysis
10. Big data analytics, AI, software engineering
Using MPM, a non-traditional medical research methodology, provides many quantitative proofs with a high degree of accuracy (higher precision) compared to other disease research results. Medicine is based on biology and chemistry, while biology, chemistry, and engineering are based on physics, and physics is based on mathematics. Logically, mathematics is the mother of all sciences. When we explore our application problems down to the foundation level, we can discover more facts and deeper truths. This is the logical essence of “math-physical medicine.” Using this MPM model, the accuracy of medical evaluations, along with the precision of predictive models can be greatly improved, with dramatic benefits to the patients.
This paper discusses the author’s biomedical research work based on the GH-Method: math-physical medicine (MPM) approach over the past decade. This is significantly different from the traditional medical research using biochemical approach and simple statistical methods. He uses his own type 2 diabetes (T2D) metabolic conditions as a case study including several application examples as illustrations and explanations of the MPM methodology
Diabetes is a disease that affects the endocrine system, cardiovascular system, nervous system, body metabolism, and including the psychological well-being of patients. Understanding and controlling glucoses is the cornerstone of diabetes control. Newer medications focus on glycemic control for the symptoms in T2D, but do not address the origin of diabetes, which is the progressive loss of β-cell function and effectiveness [1]. Liu from University of Virginia School of Medicine, and Yang from the Center for Drug Evaluation and Research, Food and Drug Administration, advance the notion that one of the most important factors in developing Type II diabetes (T2D) is “positive energy balance,” e.g. surplus energy intake (over-eating) over expenditure (exercise), which is at the core for developing metabolic syndrome and T2D.
Other factors complicating the management of T2D are the discrepancies between HbA1C and self-monitoring of blood glucose data, which led Hirsch et al to advocate the value of using patients’ own glucose data to consolidate therapeutic, educational, and behavior-change objectives [2].
This particular paper presents a scientific system approach to achieve a more accurate prediction of glucose and measurement of HbA1C lycohemoglobin. This will lead to better control of the disease processes of T2D, which can predict untoward cardiovascular events and other major diabetic complications.
The author describes his MPM as a tool to reach more accurate predictions of glucose, HbA1C, and risk probability of having a cardiovascular disease, stroke, or chronic kidney disease utilizing mathematics, physics, engineering modeling, and computer science tools, instead of the current biochemical medicine approach (BCM) that mainly utilizes biology and chemistry. A comparison between the fundamental differences of the traditional BCM methodology and the non-traditional MPM methodology is reflected in Table 1. The inverse relationship can be observed between the accuracy and replicability of a measurement and the objective nature of a scientific field (Table 3). Pure math provides precise measurements with results that are nearly 100% replicable from one researcher to another, while on the other extreme, psychology is an empirical science that tends to be more subjective, producing a greater variance with inter-rater reliability. Everything else in between has different degrees of accuracy and replicability, but the higher it is in the hierarchy, the higher its applicability and the lower its accuracy (Table 3).
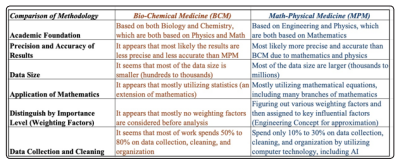
Table 1: Comparison of BCM versus MPM
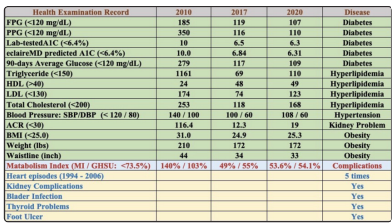
Table 2: Comparison of health conditions
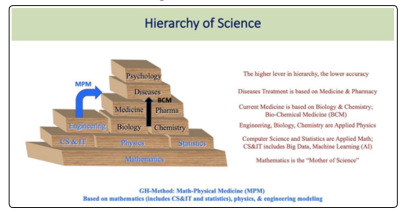
Table 3: Hierarchy of Science
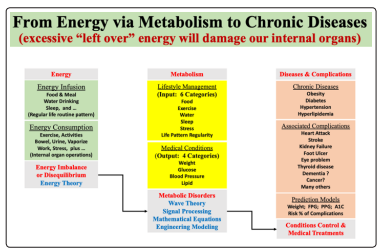
Table 4: From Energy via Metabolism to chronic diseases
One of the most valuable tools for physicians is having a method that allows them to give advice to patients on improving treatment outcome. This requires a predictive analytic method, which can only be derived from a retrospective analysis of multiple data points, looking for a pattern common to a certain outcome. After conducting a retrospective analysis of pattern recognition, prospective testing is required to confirm the accuracy of the predictive model. However, this process is complicated by the multi-factorial origins of a medical event.
The GH-Method: math-physical medicine (MPM) research methodology was developed by the author and utilized in his biomedical research over the past decade.
Any system, whether medical, political, economic, engineering, biological, chemical, and even psychological, have causes or triggers (inputs) and consequences (outputs). There are some existing connections between inputs and outputs that can be either simple or complicated. The inputs and outputs of any type of system, including biomedical system, can be observed visually, or measured quantitatively by certain instruments. These physically observed phenomena, including features, images, incidents, or numbers are merely the partial “physical expression” from these underneath system structures. This system structures include human organs for a biomedical system, the human brain for a neurological or mental system, or steel plate/pipe for a structural or mechanical system.
Once we have collected these readings of the physical phenomena (external expression, similar to a behavior, symptom, or response), through either incident, image, or data, we should be able to organize or categorize them in a logical manner. When we check or analyze these partial physical phenomena outputs and cannot figure out why they act or behave a certain way due to internal causes, reasons, or stressors, we can come up with certain guesses or formulate some reasonable hypotheses based on available basic principles, theories, or concepts from physics. At this point, we just cannot pull out an existing equation from a physics textbook and insert the input variables to conduct a “plug and play” game. An equation is an expression of a concept or a theory, which is usually associated with some existing conditions, either initial conditions or boundary conditions; however, a biomedical system usually has different kind of conditions from other systems.
After understanding the meaning of observed physical phenomena, the next step is to prove the hypothesis, guess, or interpretation of the phenomenon being correct or incorrect. At this stage, a solid understanding of mathematics becomes extremely useful to develop a meaningful model which could represent or interpret these observed physical phenomena and created hypothesis. In addition, some physics method, such as perturbation theory of quantum mechanics, energy theory, wave theory, and optical physics; engineering modeling techniques, such as finite element method and computer science tools, including software, AI, and big data analytics can offer great assistance on the verification of analysis results from these mathematical operations.
If the mathematical results cannot support the created hypothesis, then a new one needs to be formulated. When the new hypothesis is proven to be correct, then we can extend or convert it into a useful mathematical equation or a simpler arithmetical formula for others to adopt as an easier way of thinking and operation, as well as understanding of the output results. In the final stage, the derived mathematical equation or arithmetical formula can then be used to “predict” future outcomes of the selected system based on other different sets of inputs.
This article only selects the following 10 biomedical examples or real applications by using the developed GH-Method: mathphysical medicine methodology. The attached 19 figures are associated with each application example respectively from Figures 1 through 10.
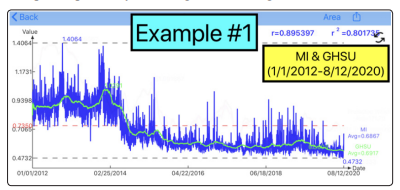
Figure 1: Application example #1

Figure 2: Application example #2
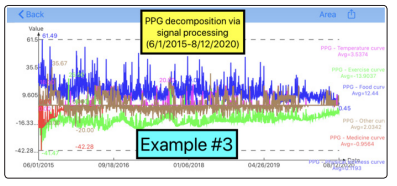
Figure 3: Application example #3
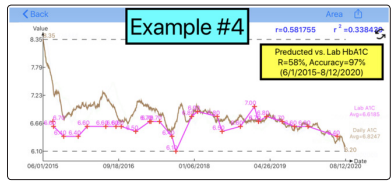
Figure 4: Application example #4
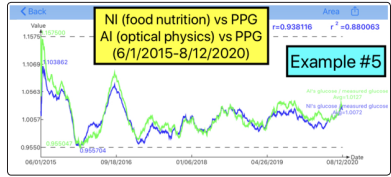
Figure 5: Application example #5
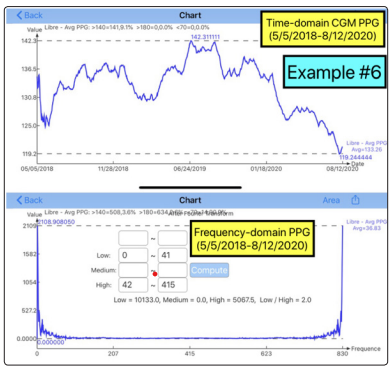
Figure 6: Application example #6
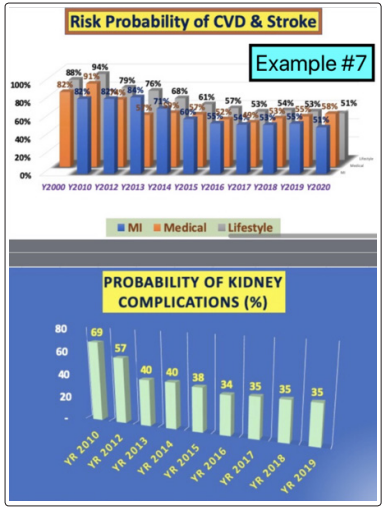
Figure 7: Application example #7
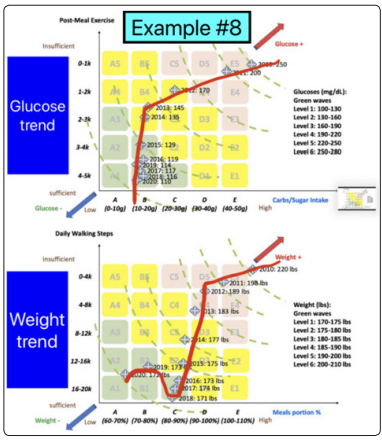
Figure 8: Application example #8
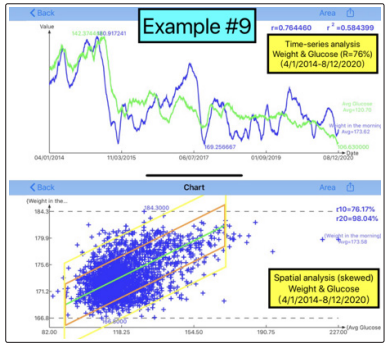
Figure 9: Application example #9
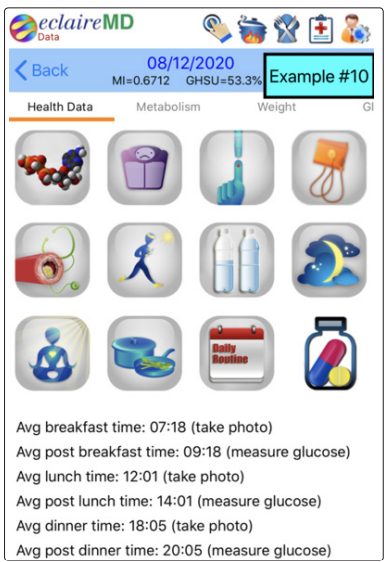
Figure 10: Application example #10
The term “metabolism” should be considered as a nonlinear, dynamic, and organic mathematical system having at least 10 categories with ~500 elements as many as 500! possible relationships defined by the author for his endocrinology research. This multi-factorial origin of metabolism equation can be better derived with the use of a mathematical concept of topology withpartial differential equation, nonlinear algebra from mathematics, and approximation modeling technique of finite element method from engineering to construct a complex mathematical model of metabolism. (Topology studies properties of spaces that are invariant under any continuous deformation. Similarly, human body’s metabolic properties remain unchanged despite of the variance and deformation of human body’s physical shapes and conditions). The effect from the “metabolism model” can be calculated and clearly expressed using two new measuring variables: metabolism index (MI), and general health status unit (GHSU) as defined by the author. If both MI and GHSU results are below 73.5%, then the patient is “healthy”, and when the index is above 73.5%, the patient is “unhealthy”.
For the past 10 years, the author spent 30,000 hours to selfstudy and research 6 chronic diseases as well as food nutrition. Furthermore, he has collected and processed more than 2 million data of his health conditions and lifestyle details. Based on these big data, he developed four biomarker prediction models, i.e. equations (not relying on statistics like BCM approach), for weight, postprandial plasma glucose (PPG), fasting plasma glucose (FPG), and hemoglobin A1C (HbA1C). All of these four prediction models have reached 95% to 99% of prediction accuracy. These 4 biomarkers have complex correlations with food, exercise, sleep, stress, and other lifestyle details.
In his previous engineering training, he was taught to always look for relationships between inputs and outputs of a system. However, on 3/17/2017, he discovered an interesting finding of the existing high correlation between his body weight and his FPG, where both of them are outputs from his human metabolism system.
He applied “signal processing” technique of electronics engineering and geophysics to decompose a PPG wave into multiple subwave components. Nineteen influential factors were identified for PPG formation and five factors for FPG formation. Primary influential factors according to their respective contribution margin are summarized below:
1) Post-meal exercise (~41%),
2) Carbs & sugar intake amount (~38%),
3) Ambient weather temperature (~5% to 10%).
4) All other 16 secondary factors, such as stress, sleep, sickness,
water, life routine regularities, and others (combined ~11%).
1) Body weight in the morning (~80% to 85%)
2) Ambient weather temperature (~5% to 10%)
3) All other 3 secondary factors, i.e. stress, sleep, disease, (~5%
to 10%)
Each factor has a different contribution percentage (weighting factor) or degree of significance in terms of its impact to the formation of glucose. The weight assigned to each factor was retrospectively derived along with pattern recognition to allow a predictive component and equation to be developed. The initial weighting factors designated to influential factors for the calculation of predictive values are further modified or enhanced via mathematical and computer science tools, such as big data analytics and AI. For example, a finger-piercing measured PPG can be predicted via a simple linear arithmetical formula with a prediction accuracy of 98% to 99%, as follows:
Predicted PPG = FPG*0.97+(carbs/sugar*1.8 (post-meal walking steps in thousand *5.0)
Predicted PPG = FPG*0.95+(carbs/sugar*2.0 - (post-meal walking steps in thousand *5.0)
This example for the two linear arithmetical formulas of the predicted PPG shows the existence of a range of multipliers for the FPG value and Carbs/sugar amount. This kind of uncertain phenomenon is a typical finding from his biomedical research.
During the development of HbA1C, the author applied the concept of “safety margin” from his nuclear power design experience on his predicted HbA1C. Although this extra 5% to 10% of safety margin would lower its prediction accuracy somewhat (~4%), but it provides extra attention and pre-warning to T2D patients regarding their forthcoming HbA1C level.
The author was a trained mathematician and computer scientist who focuses on precision, but also a professional engineer and high-tech industrialist who concentrates on solving practical problems with the best approximated answers that combines concerns of accuracy, cost, and effectiveness. He applied his industrial experience from aerospace, ocean, nuclear, computer hardware and software, electronic hardware, and semiconductors fields. A professional engineer or practical industrialist would not waste too much time and energy investigating some minor influence factors once they have achieved a fairly accurate and acceptable answer for the problem. This is the reason the author applied many engineering modeling techniques in his MPM research work. The mechanical and structural engineering disciplines and electronic engineering training have helped him to fine-tune and enforce his many developed biomedical models.
The PPG prediction model was developed using optical physics with artificial intelligence (AI) at the front-end and perturbation theory of quantum mechanics with wave theory of physics at the back-end. He used his developed algorithm using AI and precision from meal photos that contained big volume of data (with 20 million pixels or 160 million alpha-numerical digits per picture) to estimate the internal carb/sugar amount of the meal. He then applied the perturbation theory of quantum mechanics and wave theory of physics to a 3-hour long predicted PPG waveform before the T2D patients eat their meals with a 95% to 99% prediction accuracy.
These various theories and concepts of physics, geophysics, and electronics engineering (EE) tools helped the author to understand and calculate the relationship between food and glucose as well as the other detailed characteristics of PPG waves with their formation variances.
The author has collected 80-96 glucose data per day using a continuous glucose monitoring (CGM) sensor device since 5/5/2918. Thus far, he has collected more than 66,400 data within 830 days. During a data processing task, many different waveforms (i.e. curves) would appear. In general, they represent the data amplitudes over time scale (i.e. time-domain). In fact, any fluctuation of physical representation (either causes or symptomsof a disease) can be presented via a “wave” format. These timedomain waves (e.g. EKG, glucose, or BP curves) are generated by different medical devices to represent prominent characteristics of certain diseases, including cardiovascular disease, diabetes, or hypertension. These output waves not only reveal the specific disease symptoms but also possess certain specific inner physical characteristics (hidden or apparent) such as wavelength, period, frequency, amplitude, and others.
Through the Fourier Transform operation from mathematics, we can convert a “time-domain” wave into a “frequency-domain” wave. The expressions or shapes of these two waves are vastly different since they express various hidden information. Through this frequency-domain wave, we can then conduct calculations to decipher the energy associated with this wave within certain range of frequencies, for example a glucose wave’s low frequency and high amplitude. From these numerical operations, we can determine the different associated “energy” level generated by certain frequency ranges of the originally collected glucose timedomain wave. Our body needs energy to maintain its normal operating functions; however, the excessive “leftover” energy circulating within the human body can cause damages to the internal organs. Based on energy theory, the author developed a program to calculate this excessive leftover energy from energy infusion minus energy consumption, and then find ways to achieve a “metabolism balance” state. When our metabolism is in a good state, our immunity will be strong accordingly. Immune system is our body’s defensive army against external diseases’ invasion, including chronic diseases and complications (~50%), cancers (~29%), ineffectual diseases and virus (~11%). In theory, these body energy calculations can also shed a light on the estimation of longevity. Therefore, the wave theory can be a useful tool in his studies of many other chronic diseases, including cancer, dementia, and central nervous system disease along with metabolic disorders such as diabetes, hypertension, and hyperlipidemia.
By combining both wave theory and energy theory, a mathematical model was derived to use as an assessment for the risk probability of cardiovascular disease (CVD), stroke, chronic kidney disease (CKD), and cancer. All of these chronic diseases are resulted from metabolic disorders, directly or indirectly. In his detailed calculation for the assessments of risk probability, he established some proper “structural engineering” models of the human blood vessels including arteries and micro-vessels. He applied structural solid mechanics concepts such as elasticity, dynamic plastic behavior, and fracture mechanics, in combination with effects due to aging, high glucose, and high blood pressure to simulate artery rupture situation with approximately 20% to 30% of CVD/ Stroke occurrence rate. He also utilized fluid dynamics concepts combined with blood vessel inflammation due to high glucose and high cholesterol deposits to simulate artery blockage situation with around 70% to 80% of CVD/Stroke occurrence rate. The micro-vessel related risks mainly involved leakage through the tiny vessel wall, instead of blockage due to micro-vessel’s smaller size in comparison with general lipid plaques.
In order to link behavior psychological factors such as disciplines of diet and exercise along with disease physiological characteristics such as obesity and diabetes, the author decomposed ~2,500 PPG waveforms with ~32,000 glucose data points, and then re-integrated them into 3 distinctive PPG waveform types, i.e. Himalaya (too much carbs/sugar intake and inactivity), Grand Canyon (diet control and sufficient post-meal exercise), and Twin-Peaks (too much carbs/sugar intake combined with certain insufficient activity to breakdown the energy infusion). These three distinctive PPG waveform shapes could reveal different personality traits and psychological behaviors of a T2D patient. After identifying these three distinctive PPG waveforms and their associated contribution percentages, he then created a customized “progressive behavior modification” plan for diabetes patients to gradually modify their lifestyle behaviors in order to change or improve their lifestyle progressively - an evidence-based lifestyle change technique. This research begins to provide an understanding of the linkage between patient’s psychological behaviors and disease’s physiological characters in a quantitative manner, rather than using only qualitative descriptions in the traditional psychotherapy approach or semi-quantitative treatments in the traditional internal medicine approach. By having an indepth knowledge of glucose can reduce the sole dependency on diabetes medication for T2D patients to control their diabetes. Diabetes cannot be cured by medication alone because it only manages the external “symptoms” of the disease, not changing patient’s pancreatic beta cells health state.
For a single time-stamped variable, traditional time-series analysis was used, which is similar to the EKG cardiology chart with time as its X- or horizontal axis. For interactions between two variables, such as weight and glucose, the author used a 2D spatial analysis to identify some hidden characteristics or relationships among two different sets of variables (e.g. metabolic symptom). This spatial analysis using two different variables as two axes has not been widely utilized in medical research. Dr. John Snow of London, UK, was one the first to apply this application showing clusters of cholera cases in the 1854 Broad Street cholera outbreak. This was an initial use of map-based 2D spatial analysis in medicine; however, from a statistical viewpoint, it was not considered as a spatial analysis. The author found this tool to be quite powerful for biomedical data analysis, especially to identify the close relationship among multiple variables such as weight and FPG, diet/exercise and PPG, blood pressure, and glucose. He has published numerous medical papers using this technique. For example, in one of his articles, he identified high correlations exited among weight, glucose and blood pressure via a triple dual-components analysis.
Weight vs. Glucose: 89%
Glucose vs. Blood Pressure: 83%
Weight vs. Blood Pressure: 76%
The author expands the scope of his Example No. 5 (PPG & AI) to include the utilization of more computer science tools, specifically artificial intelligence and big data analytics, for wider applications. He developed an AI-based Glucometer software in 2015 installed on mobile phones, which required entering the following data via an iPhone or web-based APP on a PC:
1. Entering the quantity of food intake and bowel movement to
get a predicted body weight.
2. Based on morning body weight to get a predicted FPG value.
3. Taking a meal photo and entering into a customized APP along
with post-meal walking time or steps. These two inputs will
provide a predicted PPG value. If the predicted PPG level
is too high, the individual can either reduce the carbs/sugar
intake or increase the post-meal walking steps or exercisetime in order to obtain a lower measured PPG.
4. Based on predicted FPG value and three PPG values, plus
past four months glucose data with different weighting
factors, an estimated daily HbA1C value will be instantly
shown on mobile phone. The author has published 8 medical
papers regarding his predicted HbA1C values that included 8
consecutive periods with a time frame of 5-months each. His
eight mathematically predicted HbA1C values have matched
100% with his eight lab-tested HbA1C measured values.
This AI-based Glucometer was developed utilizing various computer science IT tools, including big data analytics, machine learning (including self-learning, self-modification, and selfsimplification), and AI based tool containing ~8 million prestored food nutritional data. This database includes 6 million food material data from the United States Department of Agriculture, 1.6 million data from 500 chain restaurants, and the author’s own 0.6 million data from his collected ~6,000 meal photos data.
As shown in Table2, in 2010, the author had an average glucose of
280 mg/dL along with his A1C above 10%. He weighed 220 lbs.
(100 kg), with a BMI above 32, and a waistline of 44 inches (112
cm). From 1994 to 2006, he suffered five cardiac episodes, renal
complications, bladder infection, foot ulcer, diabetic retinopathy,
and hypothyroidism.
Currently, in 2020, after using these 5 prediction models and his
developed AI Glucometer software, his average glucose reduced
to 108 mg/dL and his A1C is 6.2% without taking any diabetes
medications. He weighs 170 lbs. (77 kg), with a BMI at 24.7, and a
waistline of 32 inches (82 cm). Since his health condition is stable,
he does not have any recurrent cardiovascular incidents and all of
the other diabetes complications have subsided. In summary, he
has saved his own live through his GH-Method: math-physical
medicine research efforts (Table 2).
Physicians always search for ways to encourage people to adopt a healthier lifestyle by exercising more and/or decreasing caloric intake [1]. However, they are compromised by the accuracy of testing methods. Patients with diabetes rely on blood glucose monitoring devices to manage their condition. As some selfmonitoring devices are becoming more accurate, it becomes critical to understand the relationship between system accuracy and clinical outcomes, and the potential benefits of analytical accuracy. However, without the knowledge of wave theory and energy theory, a traditional medical researcher may have some difficulties to truly understand the characteristics and behaviors of the glucose waveforms. Instead, they may rely on simple statistics to study average values. As a result, this would reduce the benefits of collecting a big amount of glucose data from measuring devices such as the CGM.
In one study of simulated meter models derived from the published characteristics of 43 commercial meters, researchers isolated the differences in clinical performance that are directly associated with the meter characteristics [3]. They reported that a meter’s systematic bias has a significant and inverse effect on HbA1C ( P < .01), while also affecting the number of severe hypoglycemic events. On the other hand, an error is defined as the fraction of measurements beyond 5% of the true value, which is a predictor of severe hypoglycemic events ( P < .01). Both bias and error have significant effects on the total daily insulin (TDI) and the number of necessary glucose measurements per day ( P < .01). Furthermore, these relationships can be accurately modeled using linear regression on meter bias and error [3]. Two components of meter accuracy, bias and error clearly affect clinical outcomes. While error has little effect on HbA1C, it tends to increase episodes of severe hypoglycemia. Meter bias has significant effects on all considered metrics: a positive systemic bias will reduce HbA1C, but increase the number of severe hypoglycemic attacks, TDI use, and number of finger-sticks per day [3].
The author published his research results on the comparison of glucose measurements between finger-piercing and a particular brand of continuous glucose monitoring (CGM) sensor [4, 5, 6 & 7]. The sensor measurement results in comparison with fingerpiercing measurements reveal that using the sensor measurements, the average PPG is +17% higher and peak PPG is +38% higher in some time periods, compared to the finger stick method. The most shocking finding is PPG peaks occur around 45 minutes to 75 minutes (approximately 60 minutes) after the “first bite” of meal, not the traditional standard of two hours after. In addition, the “lowest’ PPG value usually occurs about 120 minutes after the first bite of meal which is the same timing of finger-piercing measurement recommended by many physicians. The author published many articles regarding this subject due to his serious concerns regarding hypoglycemic incidents, or the so called “insulin shocks” which can lead to sudden death.
The use of the AI Glucometer testing software provides physicians
a mechanism to assist their patients to gain better control of
their A1C glycohemoglobin, and lessen the cardiovascular risk
associated with diabetes, while motivating them to engage in
a healthier lifestyle. This is done without the need for fingersticks or even a CGM sensor device, which most patients find
objectionable [8].
The MPM methodology used in the author’s research is compared
and contrasted to current mechanisms in common use today as in
BCM with an achieved accuracy level of ~99% (Table 1). As a
result, a non-invasive technique using AI Glucometer software,
with high degree of accuracy, is preferable to current BCM method.
As of 8/12/2020, the author has written 310 medical papers and
published more than 250 of them in various medical journals,
with the majority of them using the MPM method. If interested
in reading other MPM associated papers, the author recommends
using Google to search for the related topics.
Using MPM, a non-traditional medical research methodology, provides many quantitative proofs with a high degree of accuracy (higher precision) compared to other disease research results. Medicine is based on biology and chemistry, while biology, chemistry, and engineering are based on physics, and physics is based on mathematics. Logically, mathematics is the mother of all sciences. When we explore our application problems down to the foundation level, we can discover more facts and deeper truths. This is the logical essence of “math-physical medicine.” Using this MPM model, the accuracy of medical evaluations, along with the precision of predictive models can be greatly improved, with dramatic benefits to the patients.