Author(s): Abdikafi Elmi Abdishakur, Abdullahi Mohamed Sheikh Ali* and Ahmed Mohamed Hassan
The drinking water quality assessment in Mogadishu, the capital and most populous city of Somalia was evaluated in this study. The data were obtained in the year 2019 and subjected to laboratory tests in the Mumtaz Engineering service. Hydro chemical analyses were conducted on twelve samples from six different regions located in Mogadishu with graphical representation of the minimum, maximum and average values of all parameters measured. Coupled with this is the calculation of the Water Quality Index (WQI) for the six regions. One of the main findings of the study revealed that the groundwater from all the regions except for region one is not fit to drink. When a comparison was made across all regions, four regions had a very high TDS above the WHO limit, while two regions had a high EC above the WHO limit. This study recommended that there is a need for proper handling and management of groundwater in the regions with a high concentration of evaluated parameters to avoid bioaccumulation in human tissues through in-take of polluted waters.
The adverse effect of this growth rate has increased Somalia?s rapid population growth and has weakened the healthcare system of the country making it to become more unreliable. Besides, the population of age group below 30 years in Somalia is now 70%, and this implies that the tendency of having civil unrest is high as claimed by researchers [2]. The climatic condition of the country is semiarid coupled with a warm climate and daily average temperature of 25 - 35 degrees Celsius [3]. The country has two seasons in every climatic year. The first season is the rainy season which is known to take place from the fourth month to the sixth month of the year and from the tenth month to the last month of the year. The second season is the dry season which starts from the last month to the third month of the year, then from the sixth month to the ninth month of the year. Between the sixth to the ninth month of the year, rainfall is experienced in the coastal zone [4]. On average annually, the mean rainfall is 20 to 24 inches is experienced in the South-west and North-west. All year-round, the temperature in the coastal region is always unpleasant and as a matter of fact, Somalia is ranked globally as the country with the highest average temperature (United Nations, 2006).
Groundwater is tapped into via boreholes and shallow wells. Some boreholes? in-depth range from 90m and 250m. Most shallow wells are usually below 20m in depth. This is found common in Mogadishu. In the northern part of the country, the arid and semi-arid climate indicates that all the rivers are transitory and attractive, while their flow is for a short time during and after a heavy downpour. This poses a great challenge to access portable water. In Somalia, about 8.8% of the rural population has significant access to clean drinking water. The huge proportion of the urban population with access to clean drinking water is close to 70% [5].It is believed that a lot of human activities heavily rest on the quality of water resources. Quality water is a priceless resource to sustain human, animal, and plant life, coupled with health and the environment. In all the industries of any nation, quality water is indispensable and needed to keep up the productivity and the economy of a nation. Even though the value of water to man is beyond common understanding, it is evident that accessibility to quality water by a larger population of humans is hugely limited.
Groundwater is preferred to other sources of water supply because it is readily available through all the seasons, readily accessible, and not easily deteriorated by contamination factors [6]. Groundwater makes up the predominant source of water supply for drinking, domestic, and agricultural purpose in the major parts of Mogadishu, and Somalia in general. It is also an important and essential resource in many rural and urban communities in the central part of Somalia and it functions as a water supply for domestic, agricultural, and industrial purposes [7]. It is an indispensable resource in the central region of Somalia due to the unavailability of other sources. In this area, the demand for water keeps rising daily, and this demand will keep increasing due to the rapidly growing population, increasing urbanization, and poor groundwater productivity of wells due to climate change [8]. In Somalia, there is a wider acceptance of the chemical and biological properties of groundwater. According to Human activities have altered the quality of ground water in regions of Somalia, especially the shallow ground water. Besides, the tendency of groundwater to become polluted by bacteria is very low as compared to surface water. The reason is that the soil and rocks that form a surface for the flow of ground water filter a lot of the bacteria. Bacteria, nevertheless, at times penetrate ground water, seldom in hazardously high concentrations. Having water free from bacterial pollution alone signifies not that the water is safe to consume. At times in the ground water, there can be a huge presence of microscopic dissolved minerals and organic elements in diverse concentrations. Some are not harmful and of advantage, while some are harmful, some may be extremely deadly.The city (Mogadishu) was divided into six main regions as shown below in Figure 2.0 and Table 2.0 shows the region?s households with their area extent.
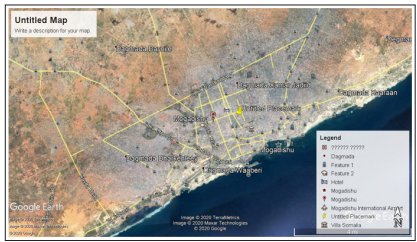
Figure 2.0: Regions of the study
| Regions | Household | Area (m2 ) |
|---|---|---|
| R1 = Hodan | 14000 | 12600 |
| R2 = Waaberi | 18000 | 402491 |
| R3 = Yaaqshiid | 9000 | 467578 |
| R4= Warta nabada | 13000 | 489851 |
| R5 = Cabdicasiiz | 10000 | 265210 |
| R6= Kaaraan | 6000 | 518117 |
Water sampling was carried out in the different boreholes in Mogadishu in June 2019, and also December 2020. Hot water was used to sterilize the plastic containers before the collection of the samples. At each sampling borehole, 1L plastic containers with borehole water from the tap which was then allowed to run for two minutes before collection of the samples. Plastic containers were carefully filled with water and recapped. The water samples were acidified with concentrated nitric acid to pH < 2 for total metal analysis.
Seventy-two samples were gathered and analyzed for the concentration of pH, electrical conductivity, chlorine, total dissolved solids, and Turbidity, within the study area. Nitrate concentrations were observed by Hach DR/2000 spectrophotometer with turbid metric formula in tandem with the American Public Health Association.The membrane filter technique was used to test for coliforms present in the water samples. A determined quantity of water is subjected to filtration, under vacuum through a cellulose acetate membrane of uniform pore diameter, usually 0.54μm. All the bacteria present were retained on the surface of the membrane which is kept on a desirable selective medium in a sterile container and subjected to incubation at an appropriate temperature. Upon the presence of coliform in the water sample, characteristic colonies are observed and they are counted directly.
The tests were conducted in the Mumtaz Engineering service.
The following experiments were done:
i. Turbidity (Turbidity tube model 2100A)
ii. pH (pH comparator)
iii. Total dissolved solids
iv. Electric conductivity
v. Chloride
vi. Nitrate
| WQI Value | Rating of Water Quality | Grading |
|---|---|---|
| 0-25 | Excellent water quality | A |
| 26-50 | Good water quality | B |
| 51-75 | Poor water quality | C |
| 76-100 | Very Poor water quality | D |
| Above 100 | Purposes | E |
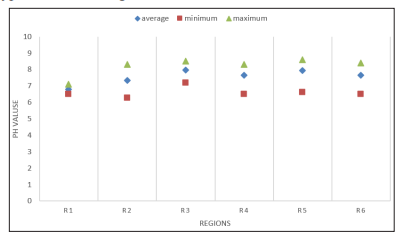
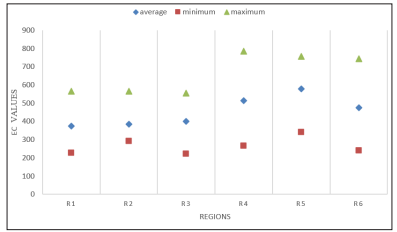
Figure 3.1: Comparison of EC concentrations in different regions
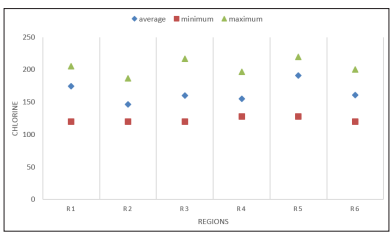
Figure 3.2: Comparison of Cl concentrations in different regions
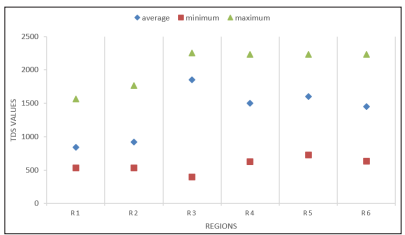
Figure 3.3: Comparison of TDS concentrations in different regions
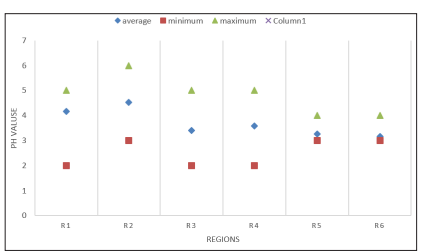
Figure 3.4: Comparison of TUB concentrations in different regions
The EC in the water body for all the region from minimum to maximum vary both below and above the WHO recommended limit for all the regions. The mean EC differs across all the regions significantly, especially in regions four, five, and six. The maximum and minimum values of EC are found in region five and region one respectively. Care must be taken about the region?s five water bodies as it may increase if pollutants gain entry into the water, rendering the water unsuitable for consumption and posing a health risk for the consumer.
In all the six regions of this study, the chlorine maximum and minimum values are suitably good for water meant for consumption. As it has been discovered in the findings of this study, region five has the highest mean chlorine value while region two has the lowest mean value. Other regions are within the expected range with varying average values. A region that tends to increase more in chlorine content will be region five and this will be alarming as the water body will position itself as a menace to the health of the consumers. Meanwhile, the chlorine concentration must not be too low as it may increase the presence of pathogens and other pollutants that are harmful to human and aquatic life. Care must be taken on all regions so that chlorine concentration will be in check either during the rainy season or dry season.The average TDS values are higher in all the six regions than the WHO limit except for regions one and two. All the maximum values of the turbidity are higher than the WHO limit. This is very alarming. Generally, TDS cannot be dissociated from the suspension of particles in the water. All the water bodies in Mogadishu are not free of suspension, just it is in varying quantities. The regions with the most presence of suspension of substances are regions four and region five. Although organic materials can be present naturally in the region water body, they can be essential to human and plant life. However, in the regions, TDS presence in high concentrations can lead to increased turbidity in the water, and when they are not filtered, diseases are unavoidable.
Turbidity in all regions is on the brink of becoming higher than the WHO limit. However, they have a different mean which is below the WHO limit. This is expected as seen in the TDS concentration in all the regions. These dissolved solids become sediments present on the floor of the water body which is why turbidity is at appalling levels in terms of concentration in most regions. Caution must be taken in all the regions right from the TDS so that turbidity can be reduced to a healthy level.It is generally considered the least polluted compared to other inland water resources, but studies indicate that ground water is not free from pollution though it is likely to be free from suspended solids. The major problem with the ground water is that once contaminated, it is difficult to114 restore its quality. Hence there is a need and concern for the protection and management of ground water quality. It is well known that no straightforward reasons can be advanced for the deterioration of water quality, as it is dependent on several water quality parameters.
Since turbidity is sometimes associated with microbial pollution. It can hinder the activities of disinfectants in water treatment thereby creating a medium for the growth of microorganisms Considering the acceptable recommendation of WHO of 5 NTU, it can be ascertained that the water quality of Mogadishu is healthy for daily consumption. However, the health effect is not common or sparingly uncommon when there is a high level of turbidity in water.
Likewise, in all the regions, the chlorine concentration is not above the WHO recommended limit. Its presence in water is the appropriate concentration and can effectively disinfect various microorganisms and some pathogens such as protozoan parasites, Giardia, and Cryptosporidium [6]. Even though it is good in the water and one of the cheapest means of disinfecting the water bodies, it comes with a price. Continuous exposure can cause cancer. Such as bladder and rectal cancers Based on research, the byproducts of chlorine can stimulate the excess production of free radicals in the human body and these radicals are potent to damage the human cells and extremely carcinogenic. Other health risk associated with continuous exposure to chlorine includes giving birth to children with brain defects or heart problem. This calls for Mogadishu water regulatory body to protect human life from the harms of consuming chlorine.High pH is not common in the regions of Mogadishu and this signifies not water alkaline in nature in the regions. This implies that there will be no delayed growth and impairment to the organs of the body, for instance, the olfactory organs, and eyes.
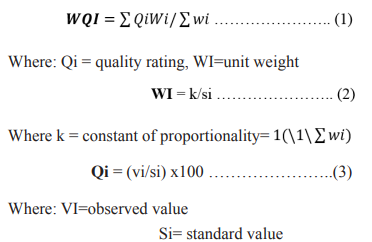
Electrical conductivity itself is a reflection of many pollutants are present in the water. So having high EC will be harmful to human and aquatic life. Waterborne diseases will be epidemic in regions with high EC, such as cholera, typhoid fever, diarrhea, and so on. Since the EC in Mogadishu is below the recommended limit, the health life of the inhabitants is not at risk.Water Quality Index allows researchers to have a gross analysis of water quality on numerous levels with the effect on water?s quality to foster aquatic life and if the general quality of water body will be a possible threat to several waters uses. The calculation of WQI for region one was done, and this calculation was applied for all the remaining five regions. Table 2.2 is generated which shows WQI for regions one to six.
In the six regions, the average WQI value for region one is 44.96 which reveals that water quality is good, the average WQI for region two is 60.84 which depicts that the water quality is poor, the average WQI for Chlorine region three is 63.14 which shows that water quality is poor, the average WQI for region four is 57.70 which shows that the water quality is poor for drinking purpose, the average WQI for region five is 60.43 which depicts that the water quality is poor, and finally for region six, the average WQI is 52.70 which depicts that the water quality is poor. WQI values in all regions, except for region one, show that water quality decline, and more care must be put in place to improve the water quality. It is obvious from the index that all of the parameters require serious precautions to be utilized for human consumption. Except for region one, the cumulative drinking WQIs of the regions are well positioned in the poor range. This necessitates more protection of the five regions (especially in regions with high TDS) since suspended materials in the water are attributed mostly to discharge from sewage in the areas where humans dwell. Since one of the main aims of Mogadishu water resources management is to execute plans driven toward the conservation of water quality, it would be compulsory to have a sustainable monitoring program in designated regions. These plans coupled with the creation of domestic wastewater treatment stations for known discharging points in the regions could be one of the possible solutions to positively change the indices, which demonstrate the betterment of the regions? water quality.| Regions | Parameter | Observed value (vi) | Standard value (Si) | Unit weights (Wi) | Quality rating (qi) | Wi x Qi | WQI value | Water Quality Rating |
|---|---|---|---|---|---|---|---|---|
| R1 | pH | 6.79 | 8.5 | 0.34 | -14 | -4,76 | 44.96 | Grade B Good water quality |
| Electrical conductivity (μS/cm) | 373 | 500 | 0.005 | 74.6 | 0.37 | |||
| Chlorine (mg/l) | 174.3 | 250 | 0.011 | 69.72 | 0.76 | |||
| Total dissolved solids (mg/l) | 843.17 | 1000 | 0.002 | 84.32 | 0.16 | |||
| Turbidity | 4.17 | 5 | 0.58 | 83.4 | 48.37 | |||
| Nitrate | 0 | 50 | 0.058 | 0 | 0 | |||
| R2 | pH | 7.33 | 8.5 | 0.34 | 22 | 7.48 | 60.84 | Grade C Poor water quality |
| Electrical conductivity (μS/cm) | 385.60 | 500 | 0.005 | 77 | 3.8 | |||
| Chlorine (mg/l) | 146.5 | 250 | 0.011 | 58.6 | 0.64 | |||
| Total dissolved solids (mg/l) | 921.91 | 1000 | 0.002 | 92.19 | 0.018 | |||
| Turbidity | 4.53 | 5 | 0.58 | 90.6 | 52.34 | |||
| Nitrate | 0 | 50 | 0.058 | 0 | 0 | |||
| R3 | pH | 7.98 | 8.5 | 0.34 | 65.33 | 22.21 | 63.14 | Grade C Poor water quality |
| Electrical conductivity (μS/cm) | 399.71 | 500 | 0.005 | 79.74 | 0.39 | |||
| Chlorine (mg/l) | 160 | 250 | 0.011 | 64 | 0.70 | |||
| Total dissolved solids (mg/l) | 1850 | 1000 | 0.002 | 185 | 0.37 | |||
| Turbidity | 3.41 | 5 | 0.58 | 68.2 | 39.55 | |||
| Nitrate | 0 | 50 | 0.058 | 0 | 0 | |||
| R4 | pH | 7.65 | 8.5 | 0.34 | 43.3 | 14.73 | 57.70 | Grade C Poor water quality |
| Electrical conductivity (μS/cm) | 513.97 | 500 | 0.005 | 102 | 0.51 | |||
| Chlorine (mg/l) | 155 | 250 | 0.011 | 62 | 0.68 | |||
| Total dissolved solids (mg/l) | 1503.4 | 1000 | 0.002 | 150 | 0.30 | |||
| Turbidity | 3.58 | 5 | 0.58 | 71.6 | 41.52 | |||
| Nitrate | 0 | 50 | 0.058 | 0 | 0 | |||
| R5 | pH | 7.93 | 8.5 | 0.34 | 62 | 21 | 60.43 | Grade C Poor water quality |
| Electrical conductivity (μS/cm) | 579 | 500 | 0.005 | 115.8 | 0.57 | |||
| Chlorine (mg/l) | 191 | 250 | 0.011 | 76.4 | 0.84 | |||
| Total dissolved solids (mg/l) | 1600.83 | 1000 | 0.002 | 160 | 0.32 | |||
| Turbidity | 3.25 | 5 | 0.58 | 65 | 37.7 | |||
| Nitrate | 0 | 50 | 0.058 | 0 | 0 | |||
| R6 | pH | 7.65 | 8.5 | 0.34 | 43.3 | 14.7 | 52.70 | Grade C Poor water quality |
| Electrical conductivity (μS/cm) | 473.86 | 500 | 0.005 | 94.7 | 0.47 | |||
| Chlorine (mg/l) | 161.25 | 250 | 0.011 | 64.5 | 0.70 | |||
| Total dissolved solids (mg/l) | 1448 | 1000 | 0.002 | 144.8 | 0.28 | |||
| Turbidity | 3.16 | 5 | 0.58 | 63.2 | 36.6 | |||
| Nitrate | 0 | 50 | 0.058 | 0 | 0 |
A high level of TDS and low pH shows that there is the presence of other harmful pollutants in the water. For example, pollution and other toxic elements can result from high-level concentrations of TDS, EC, Cl, and pH so it is important to constantly observe and record these changes which can act as an advance cautionary sign that something is happening to the water.
The quality and suitableness of groundwater in the Mogadishu region for human intake have been assessed. As found in the result of this study, the undermentioned conclusions are made: (1) None of the samples in all the regions are acidic while very few are alkaline; (2) The EC is satisfactory but an increase in EC of the regions will occur if the increase in temperature occurs and vice versa; (3) Most of the regions according to the (WHO, 2011) permissible limit has Chlorine concentration at the limit in water and any slight increase in chlorine can be hazardous to human intake and other living organisms. It was obvious from the results that TDS was high and above the WHO acceptable limit for drinking water.Government should ensure the provision of potable water for the communities as this would go a long way to preserve the health of the people. Also, an adequate geochemical investigation should be carried out before boreholes are drilled in multi-criteria to reduce the possibility of the groundwater contamination.