Author(s): Gerald C. Hsu
In this paper, the author presents his numerical techniques of applying the first-order interpolation perturbation method to establish and predict a new postprandial plasma glucose (PPG) waveform based on the “perturbation factor” of carbs/sugar intake amount
In this paper, the author presents his numerical techniques of applying the first-order interpolation perturbation method to establish and predict a new postprandial plasma glucose (PPG) waveform based on the “perturbation factor” of carbs/sugar intake amount. This is part of his GH-Method: math-physical medicine research methodology. He also uses two previously measured PPG datasets (waveforms) of high-protein breakfasts to validate this numerical methodology.
The exact solution of many nonlinear problems encountered in the biomedical field cannot be achieved analytically for most situations. Normally, a given complex function can get certain approximated solutions via a class of simpler operations. Most of the general complex problems can be expressed by the following polynomial function of nth degree:
This nth degree polynomial function could be solved by approximating the values outside the available data table with the help of the calculating points that correspond to the approximate locations within the proximity of the available data table. This approach could be achieved via function approximation simplification and interpolation perturbation methods.
First, in many cases, this nth degree polynomial function could be further simplified via truncating off the higher order terms to achieve the following first-order polynomial function:
Y = f(X) = A0 + A1*X
Second, the above first-order polynomial function’s approximate solution could be obtained via a specific “interpolation or extrapolation” method.
Interpolation is implemented within the range covered by data of both the PPG due to high-carbs amount (“high glucose”) and PPG due to low-carbs amount (“low glucose”). The interpolation method replaces Y (glucose level) with an easily calculated function, usually a polynomial and a simple straight line. In short, the interpolation method, also known as the intermediate value, is a scientific term that could be defined as arriving at an unknown intermediate values (e.g. glucose level Y mg/dL) of a function by using known values (e.g., carbs amount X grams). For the complex problem of glucose variation study, this simplified equation can be expressed in the following format of Equation 1:
New Glucose Y mg/dL at new X carbs gram
= function of carbs amount, i.e. f(X)
= Y1 + slope * (Y2 - Y1)
slope = (new X - low carbs) / (high carbs - low carbs)
Y1 = low glucose
Y2 = high glucose
The above-described steps of the calculation (Equation 1) have utilized an applied mathematics methodology of “first-order interpolation perturbation method” which have been frequently used in quantum mechanics, fluid dynamics, and solid mechanics.
The author has selected a period of 601 days (5/5/2018 - 12/26/2019) as the time window of his segmented PPG pattern analysis associated with two separate meal groups. The first one has 240 breakfasts with either an egg or McDonald’s breakfast, including egg, sausage, hash brown or muffin occasionally, and the other has 228 breakfasts at McDonald’s restaurant exclusively
A summarized data table of breakfast PPG analysis is listed below with the format of (average carbs/sugar grams; average post-meal walking steps; average finger PPG; averaged sensor PPG):
Egg: (7.5g; 4700 steps; 114.7 mg/dL; 136.72 mg/dL) McDonald’s: (10.0g; 4616 steps; 117.7 mg/dL; 137.68 mg/dL)
The major difference between these two breakfast groups is the first perturbation factor of carbs/sugar intake amount, 7.5 grams for Egg vs. McDonald’s and 10.0 grams for McDonald’s exclusively. Post-breakfast walking steps and PPG values for both cases are comparable.
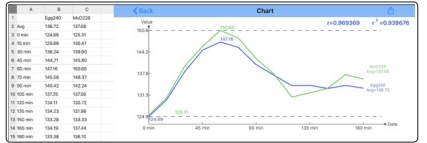
He was then able to construct two separated PPG waveforms (curves) between 0-minute and 180-minutes, for high-carbs input and low-carbs input. The data table and waveforms are shown in Figure 1.
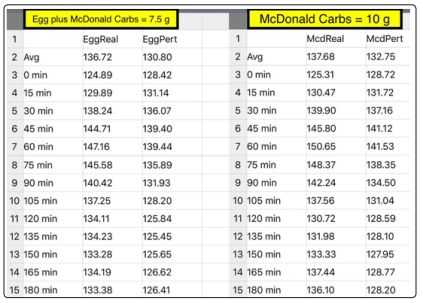
Finally, he used these two breakfast cases (7.5 g and 10g) as known values (X1, X2, Y1, Y2) to construct two new approximate waveforms associated 7.5 g and 10g, respectively using interpolation perturbation methods (Equation 1).
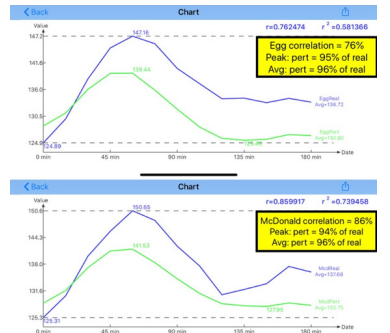
Figures 2 depicts two data tables of these two-interpolation perturbation calculated results. Figure 3 shows the comparison between measured waveform versus perturbed waveform for 7.5g case and 10g case, respectively.

Figure 1: Low-carbs PPG and High-carb glucose

Figure 2: Interpolation perturbation method to generate two datasets for both egg breakfast and McDonalds’ breakfast

Figure 3: Comparison between perturbed and measured PPG for both egg and McDonalds’ breakfasts
It is clear that the PPG waveform comparison between perturbed PPG and measured PPG offer a high correlation coefficients, i.e. high similarity of curves, of 76% and 86%. The perturbed PPG peaks are at 94% and 96% of measured PPG peaks, while the perturbed average PPG value is at 96% of measured average PPG value. Although these two perturbed breakfast PPG values are only approximated values, both of them still have ~ 95% degree of accuracy.
Glucose variance is an extremely complex biochemical and biophysical phenomenon. In addition, glucose testing using finger piercing is both troublesome and painful. Most diabetes patients do not like to measure their glucose constantly.
The authors paper numbers 153-2019 and 154-2019 describe his application of perturbation theory to develop a 3-hour approximate PPG waveform based on one single input data, the carbs/sugar intake amount, with high accuracy.
Based on this technique and his developed artificial intelligence glucometer’s estimated carbs/sugar intake amount (via optical physics), a diabetes patient can predict and control his PPG in a much easier way
After a diabetes patient measures and establishes two separate initial waveforms with low-carb meal and high-carb meal respectively, we can then apply this interpolated perturbation method to predict and plot out this patient’s 3-hour PPG waveform (curve) prior to eating. Even though these approximated PPG values sacrifice some degree of prediction accuracy, this prediction method is fast, easy, painless, and at no cost to diabetes patients to control their glucose levels [1-5].
