Author(s): Gerald C. Hsu
This article address is the author’s hypothesis on the neurocommunication model existing between the brain and liver regarding production and glucose secretion in the early morning. This is based on the observation of the difference between glucose at wake up moment in the morning for the fasting plasma glucose (FPG), and glucose at the first bite of breakfast for the glucose at 0-minute or “open glucose” of postprandial plasma glucose (PPG)
All of the eight identified glucoses of breakfast PPG are higher than the eight glucoses at time of wake up by a difference of an average of 8 mg/dL.
The value difference using Method B of CGM sensor glucoses during the COVID-19 period offers the most accurate picture and credible glucose difference of 8 mg/dL between his FPG at wake-up moment and PPG at the first bite of breakfast.
The author believes that the brain senses when a person wakes up due to different kinds of stimuli from many sources, including eye, environment, and even internal organs, which will alert the body to be in “active” mode requiring “energy” through glucose. Even though the person has not eaten anything or is not actively moving, the brain issues a marching order to the liver to produce or release glucose for the body to use in the forthcoming day. This hypothesis can currently explain why his glucose of eating his breakfast is ~8 mg/dL higher than his FPG at wakeup.
This article address the author’s hypothesis on the neurocommunication model existing between the brain and liver regarding production and glucose secretion in the early morning. This is based on the observation of the difference between glucose at wake up moment in the morning for the fasting plasma glucose (FPG), and glucose at the first bite of breakfast for the glucose at 0-minute or “open glucose” of postprandial plasma glucose (PPG).
The author started measuring his glucose since 1/1/2012 using traditional finger-piercing and test strip (Finger glucose) 4 times each day, once in early morning (FPG) when he just wakes up from his sleep, and three times at two-hours after each meal (PPG).
In addition, since 5/5/2018, he applied a continuous glucose monitoring (CGM) device on his upper arm and collect ~96 glucoses each day at a time interval of each 15 minutes. With this CGM-based sensor collected glucoses (Sensor glucose), he has defined his Sensor FPG as the average glucose of 28 values between 00:00 am (midnight) and 07:00 am (around the time of first bite of breakfast). In this particular analysis, he will not use the average FPG within 7 hours of nocturnal sleep time. In addition, he selected a 3-hour (180 minute) timespan after the first bite of meal as his standard Sensor PPG timeframe. As a result, he will only use his glucose at the first bite of breakfast, which is 0-minute of his breakfast PPG waveform, and disregard all of the other glucose data.
To learn more about the GH-Method: math-physical medicine (MPM) research methodology, readers can review his article, Biomedical research methodology based on GH-Method: mathphysical medicine (No. 310), to understand his MPM analysis method [1].
For the past 12 months, he has researched and written approximately 10 medical papers, see an example in Reference 2, regarding the specific neurocommunication model existing between the brain and some internal organs, specifically the stomach, liver, and pancreas via observing and analyzing his glucose variances from his nearly 2 million collected data [2].
For the past ~8 months during the COVID-19 quarantined period (Virus period), he has achieved better results on his glucose control and metabolism maintenance due to his non-traveling, peaceful, and regular routine lifestyle [3]. His average daily glucose was 115 mg/dL over a period of ~20 months, from 5/5/2018 through 1/18/2020 (Pre-Virus period), in comparison with an average dailyglucose of 108 mg/dL for the recent ~8 months of Virus period
Recently, during the Virus period, he noticed a specific phenomenon of glucose rapidly rising after his wake-up moment until the first bite of breakfast. Usually, he measures his FPG after he wakes up from his sleep, then measures his blood pressure and body weight to input these biomarker data into his APP software. Finally, he prepares his simple breakfast, normally containing egg and coffee. During this entire time period, usually within 30 to 45 minutes, he does not eat anything else or has any physical activity (his total walking steps is around 100 steps on average). Surprisingly, he noticed that his fast-rising glucose makes his glucose at the moment from the first bite of his meal higher than the glucose at his wake-up moment. The timespan between these two moments is within ~45 minutes without any external influences from diet and exercise; therefore, he wonders why this occurred and what is the difference in glucose over a longer period of time?
First, he chose Three Different Periods:
Virus period
(1/19/2020 - 9/6/2020)
Pre-Virus period
(5/5/2018 - 1/18/2020)
Secondly, he chose three different analytical methods described below to calculate the glucose values he desired:
(1) Method A: He uses time series analysis to calculate his average FPG value measured at wake-up moment. Please note that he used finger FPG for Pre-Virus period and CGM sensor FPG at wake-up moment for Virus period. Therefore, his glucose data comparison during Pre-Virus period has deteriorated on data accuracy due to data inconsistency between finger FPG and sensor PPG. In his previous research papers, he already identified his average sensor glucose as being higher than his average finger glucose. As a result, his glucose data comparison during the Virus period has the highest degree of data accuracy due to data consistency between sensor FPG and sensor PPG.
(2) Method B: He uses segmented pattern analysis to calculate and generate a “synthesized” PPG waveform of breakfast and then single out the breakfast PPG at 0-minute. He also applies the “Candlestick K-line” model to double check his breakfast PPG at 0-minute (i.e. “open” glucose of breakfast candlestick) to make sure these two values are identical [4]. Please note that this second step uses CGM data only since Finger glucose contains one-point data which cannot represent a curve or waveform.
(3) Method C: He uses synthesized all-day glucose waveform from 00:00 throughout 23:45 with a total of 96 glucose data-points for each day. He then summarized those 231 days’ data for Virus period, 620 days’ data for Pre-Virus period, and 851 days’ data for Total period to generate a synthesized all-day glucose waveform. He chose two glucose values at 06:00 am as his “approximate” wake up moment and 07:00 am as his “approximate” first bite moment of breakfast. Although he is a very disciplined person, he cannot wake up every morning consistently at 06:15 and eats his breakfast at 07:00 every day. Therefore, the glucose data comparison using Method C has the highest margin of error, i.e. lowest data accuracy
Figures 1, 2, and 3 show the resulting diagrams of his measured FPG at wake up moment, breakfast PPG waveform, breakfast PPG K-line, PPG at first bite of breakfast, and the glucose difference between these two different moments in the three respective periods using Method A and Method B.
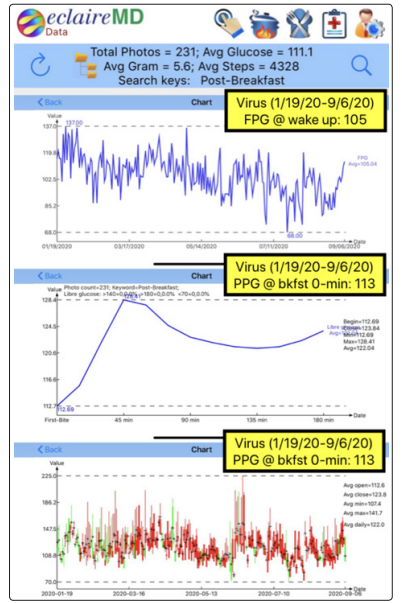
Figure 1: Virus period (Method A and Method B)
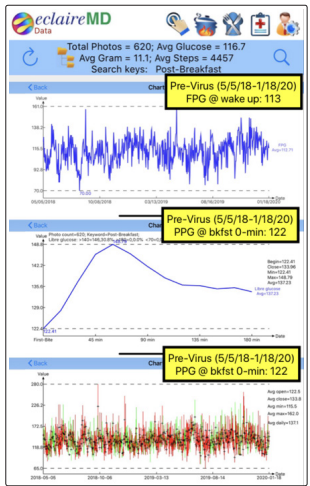
Figure 2: Pre-Virus period (Method A and Method B)
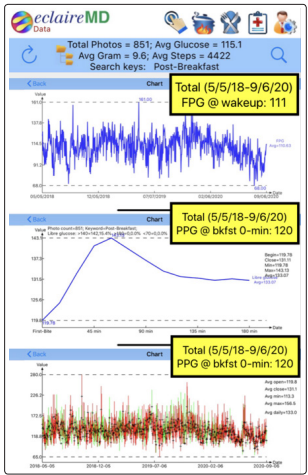
Figure 3: Total period (Method A and Method B)
Virus: 8 mg/dL (most accurate)
Pre-virus: 10 mg/dL (less accurate)
Total: 9 mg/dL (hybrid in-between)
Average: 9 mg/dL
Figures 4, 5, and 6 show the diagram results of his synthesized daily glucose curve over 24 hours with a data table containing his FPG at wake up moment and his PPG at first bite of his breakfast, and the glucose difference between these two different moments in the three respective periods using Method C. As mentioned above, this set of glucose comparison has the lowest data accuracy due to his exact wake-up time is not consistently at 06:15 am (usually between 5:30 am and 7:30 am), and the time of first bite of breakfast is not consistently at 07:00 am (about 80% at 7:00 am).
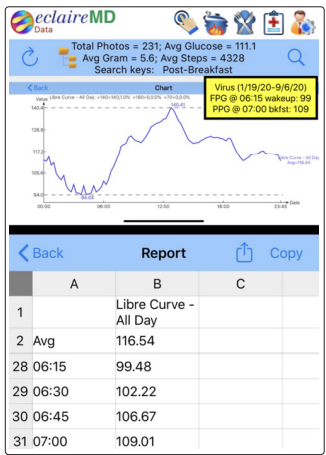
Figure 4: Virus period (Method C)
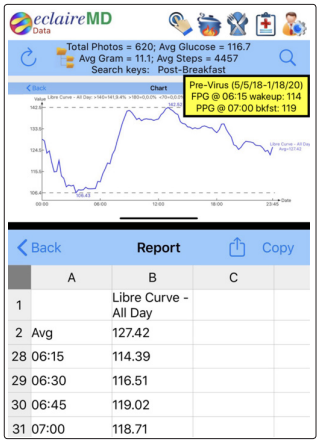
Figure 5: Pre-Virus period (Method C)
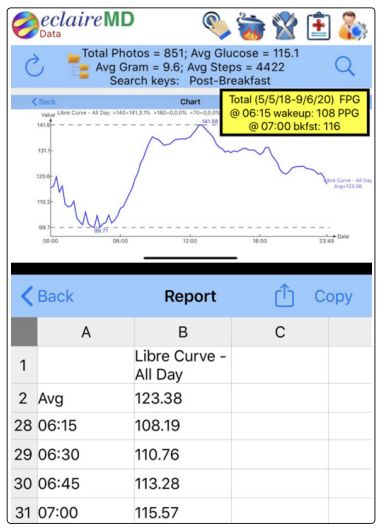
Figure 6: Total period (Method C)
Virus: 10 mg/dL (higher than A & B)
Pre-virus: 4 mg/dL (longer period)
Total: 7 mg/dL (hybrid in-between)
Average: 7 mg/dL
By analyzing the above observations of 8 glucose difference values, except the 4 mg/dL glucose difference during pre-virus period using Method C (i.e. using a synthesized daily glucose curve and two fixed time instants), all of the other 7 glucose difference values are between 7 mg/dL to 10 mg/dL. However, the result of 8 mg/dL glucose difference value using Method B of CGM sensor glucoses during virus period offers the most accurate picture and reliable glucose difference of 8 mg/dL between his FPG at wake up moment and PPG at the first bite (i.e. 0-minute) of his breakfast.
Figure 7 contains the most important and conclusive information for this article because it shows the background data table and its associated bar charts. It is obvious that all of the glucoses of breakfast PPG at first bite are higher than those glucoses at the wake-up moment, by a difference of an average amount of 8 mg/dL.
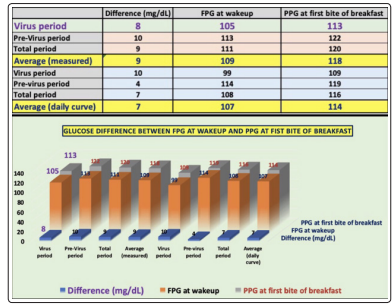
Figure 7: Data table and Bar chart of three periods (~8 mg/dL of glucose difference in early morning)
Now the question is why this phenomenon occurred.
The author believes that the brain senses when a person wakes up due to different kinds of stimuli from many sources, including eye, environment, and even internal organs, which will alert the body to be in “active” mode requiring “energy” through glucose. Even though the person has not eaten anything or is not actively moving, the brain issues a marching order to the liver to produce or release glucose for the body to use in the forthcoming day. As a result, this currently explains why his glucose of eating his breakfast is higher than his FPG at wake-up moment.
The author developed his hypothesis using a method he learned in business statistics, decision making through elimination. In order to explain his observed phenomenon of higher glucose, he collected 8 possible sources or inputs: A is diet, B is exercise, C is body weight, D is weather temperature, E is stress, F is illness, G is sleep condition, and H is un-identified source. For two glucose values occurring within ~45 minutes on the same day and in the same living environment, he could rule out possible inputs of C, D, E, F, and G. Besides, C for body weight and D for weather temperature are already identified as the two major influential factors in his predicted FPG. In addition, he does not have any influences from A for diet and B for exercise before eating his breakfast. As a result, the remaining factor is H for the un-identified source or input factor. The unknown factor is the brain through the nervous system communicating with the internal organs. This is how the author established his hypothesis via the specific evidence of glucose difference value for the early morning.
This article is slightly different from the author’s earlier research work focusing on the same subject of neuro-communication models between the brain and organs, such as the stomach, liver, and pancreas. His previous papers were based on the observation of PPG differences using the same food material and different cooking methods, resulting with food in different physical states. For this article, it has nothing to do with food but addresses the same neurological phenomenon through observation of his two glucoses in the early morning.
As he conduct more research on neuroscience, the more fascinated he gets with this particular subject. In the body, all of the organs are interconnected with the brain via the nervous system and blood system. Lifestyle affects the entire body; therefore, lifestyle is linked to metabolism which further affects the immune system to defend the body from many diseases. As a result, we must manage our lifestyle extremely well in order to maintain good health.