Author(s): Lau CS*, Loh WJ, Phua SK and Aw TC
Background: There are few contemporary evaluations of directly measured LDL (dLDL) assays. We evaluated the performance of the Roche Gen.3 dLDL assay and compared it to the Friedewald LDL (cLDL) in a large cohort, tested on the Cobas c702 analyser.
Methods: We evaluated assay precision, linearity, and limit of detection (LOD). To compare cLDL/dLDL, lipid panels (TC/TG/HDL/cLDL) from 2017-2019 (n=117,090) were tested for dLDL. Samples with TG >400mg/dL (4.5mmol/L) (n=605) and negative cLDL (n=32) were excluded. We examined the difference between cLDL/dLDL (n=116,453), the influence of increasing levels of TG/LDL on their measurements, and how cLDL/dLDL classified cardiovascular risk by LDL levels.
Results: The Roche dLDL assay has a CV of 1.0%/0.9% at 58.4/106.4mg/dL, is linear from 19.4-374mg/dL, and has a verified LOD of 4.2mg/dL. Despite close agreement between dLDL/cLDL [Pearson r=0.98 (95%CI 0.9795-0.9800)], cLDL underestimates dLDL in 98.5% (n=114,750) of subjects across all levels of LDL/TG. The underestimation increases with LDL/TG levels. cLDL classified more subjects (63.5%) as having a desirable LDL (<100mg/dL) than dLDL (46.9%).
Conclusions: The Cobas c702 dLDL assay performs well, and contemporary cLDL results underestimate dLDL across all levels of TG/LDL. cLDL classifies more patients into lower cardiovascular risk categories than dLDL.
LDL-cholesterol (LDL) is a key target in the treatment and prevention of cardiovascular disease (CVD). Guidelines advocate lower LDL targets in primary and secondary prevention of CVD, especially with the introduction of PCSK9 inhibitors. The need for accurate LDL measurements, especially at lower LDL levels, has become even more critical. Laboratories continue to use the Friedewald equation to calculate the LDL (cLDL) rather than measure it directly (dLDL) because of the additional cost of testing dLDL and the convenience of the analyser providing an automatic calculation of cLDL from its component lipids. However, dLDL testing is now inexpensive and equivalent to that of HDL-cholesterol (HDL). In fact, in a recent 2020 College of American Pathologists (CAP) external quality assessment (EQA) report, out of over 4400 laboratories that performed lipid testing, 2535 already implement dLDL testing [1-6].
dLDL assays and analysers have improved considerably over time. However, there are no recent studies comparing cLDL to dLDL, especially on the newer Roche analysers. The Roche Cobas c702 is a widely used platform and accounts for up to 22% of participants in the 2020 CAP lipid EQA program [6]. In this study, we compared dLDL with cLDL in a large cohort (n = 117,090) using contemporary dLDL reagents (Roche LDL-Cholesterol Gen.3) and a modern auto-analyser (Roche Cobas c702, Roche Diagnostics, Singapore).
Changi General Hospital (Singapore) is a 1000-bed acute care general hospital that is accredited by the Joint Commission International. Our laboratory is accredited by the CAP. We serve an average of 500-600 emergency patients and 1000-1500 outpatient attendances daily. We run an average of 100-150 lipid panels [comprising of TG, total cholesterol (TC), HDL and LDL] per day on the Cobas c702. Our performance for the Cobas c702 lipid assays including dLDL on the CAP external quality assurance program has been satisfactory.\
All lipid panel results between March 2017 to May 2019 (N = 117,090) were reviewed. dLDL was measured on all samples, and cLDL calculated using the Friedewald equation [cLDL (mg/ dL) = TC - HDL - (TG/5)]. Samples with TG >400 mg/dL (4.5 mmol/L) (N = 605) and negative cLDL (N = 32) were excluded (see Fig 1). These 116,453 lipid panel results were from 55,307 individuals [29,545 males (65,577 lipid panels) and 25,762 females (50,876 lipid panels)] with a mean age of 58.1 ± 16.8 years. This study was approved by our institutional review board (CIRB Ref. No.: 2019/2506).
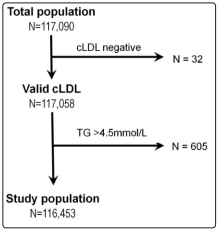
Figure 1: Flow diagram for the recruitment of study subjects (Abbreviations: cLDL: Calculated LDL, TG: Triglycerides)
Samples collected in heparinized vacutainer tubes (PST, BectonDickinson) were centrifuged at 3000g for 5 minutes and analysed on the Cobas c702 for TC, TG, dLDL and HDL within 2 hours of collection.
The Cobas TC, TG and HDL assays are enzymatic colorimetric assays. The TC assay has a measuring range of 3.9-8011 mg/dL (0.1-207 mmol/L) and an inter-assay precision (CV) of 1.6% at TC concentrations of 89.4 & 187.7 mg/dL (2.31 & 4.85 mmol/L). The TG assay has a measuring range of 8.9-4430 mg/dL (0.1-50.0 mmol/L) and CV of 2.0 & 1.6% at TG concentrations of 123 & 206 mg/dL (1.39 & 2.33 mmol/L) respectively. The HDL assay has a measuring range of 3.1-241.5 mg/dL (0.08-6.24 mmol/L) and a CV of 1.5 & 0.9% at HDL concentrations of 34.1 & 51.9 mg/dL (0.88 & 1.34 mmol/L) respectively.
The Cobas c702 dLDL assay is a homogeneous enzymatic colorimetric assay. Cholesterol esters and free cholesterol in LDL are measured using cholesterol esterase and cholesterol oxidase in the presence of surfactants which selectively solubilize LDL only. The hydrogen peroxide produced in these reactions react with 4-aminoantipyrine and N-ethyl-N-(3-methylphenyl)- N-succinlyethylenediamine. In the presence of peroxidase, a red purple dye is produced and measured photometrically at sub/ main wavelengths of 700 & 600 nm respectively. Reactions on the other non-LDL lipoproteins are inhibited by surfactants and a sugar compound. The Cobas dLDL assay has a reported measuring range of 3.9-1099 mg/dL (0.10-28.4 mmol/L) and is unaffected by elevated TG up to 2038 mg/dL (23 mmol/L).
The Cobas c702 dLDL assay has been previously compared to the LDL reference method (beta-quantification) by the manufacturer. In the method comparison study, fresh serum samples (n = 52) were analyzed with the CDC reference method (ultracentrifugation) and with the Roche LDLC3 assay on cobas c702 system using the Roche lipids calibrator. The selection of the patient samples was performed following CDC manufacturing protocol. No spiked patient samples were used in the comparison study. The reference method was performed at CDC reference laboratory. The cobas c702 dLDL assay had a good correlation with the reference method (r = 0.99), with a slope of 1.01 (see Supplementary Figure A), mean bias was 2.7%, among-run CV 2.0% and total error was 6.6% (see Supplementary Figure B) at Erasmus MC, Rotterdam, Netherlands.
Assay precision was analysed using 2 levels of Roche control materials run 5 times daily over 5 days, as per the CLSI EP15-A3 protocol [7]. Assay linearity was assessed following the Clinical and Laboratory Standards Institute (CLSI) EP-6 protocol, using unidentified patient sera run in duplicates for different levels. The limit of detection (LOD) was verified with samples of deionized water and patient serum [8].
We also compared the agreement between cLDL and dLDL values (Deming regression and Bland-Altman analysis) and examined the influence of increasing levels of TG and LDL. We also compared the distribution of cLDL and dLDL levels according to American College of Cardiology (ACC)/American Heart Association (AHA) LDL levels for CVD risk [1]. Statistical analyses were performed using MedCalc software v19.3.1 (MedCalc, Ostend, Belgium). Compliance with STARD guidelines is enclosed (see Supplementary Table A).
Supplementary Table A: STARD Guideline checklist
| Section & Topic | No | Item | Reported on page # |
| TITLE OR ABSTRACT | |||
| 1 | Identification as a study of diagnostic accuracy using at least one measure of accuracy(such as sensitivity, specificity, predictive values, or AUC) | 2 | |
| ABSTRACT | |||
| 2 | Structured summary of study design, methods, results, and conclusions (for specific guidance, see STARD for Abstracts) | 2 | |
| INTRODUCTION | |||
| 3 | Scientific and clinical background, including the intended use and clinical role of the index test | 4 | |
| 4 | Study objectives and hypotheses | 4 | |
| METHODS | |||
| Study design | 5 | Whether data collection was planned before the index test and reference standard were performed (prospective study) or after (retrospective study) | 5 |
| Participants | 6 | Eligibility criteria | 5 |
| 7 | On what basis potentially eligible participants were identified(such as symptoms, results from previous tests, inclusion in registry) | 5 | |
| 8 | Where and when potentially eligible participants were identified (setting, location and dates) | 5 | |
| 9 | Whether participants formed a consecutive, random or convenience series | 5 | |
| Test methods | 10a | Index test, in sufficient detail to allow replication | 6 |
| 10b | Reference standard, in sufficient detail to allow replication | 6 | |
| 11 | Rationale for choosing the reference standard (if alternatives exist) | 6 | |
| 12a | Definition of and rationale for test positivity cut-offs or result categories of the index test, distinguishing pre-specified from exploratory | 6 | |
| 12b | Definition of and rationale for test positivity cut-offs or result categories of the reference standard, distinguishing pre-specified from exploratory | 6 | |
| 13a | Whether clinical information and reference standard results were available to the performers/readers of the index test | 5 | |
| 13b | Whether clinical information and index test results were available to the assessors of the reference standard | 5 | |
| Analysis | 14 | Methods for estimating or comparing measures of diagnostic accuracy | 7 |
| 15 | How indeterminate index test or reference standard results were handled | 7 | |
| 16 | How missing data on the index test and reference standard were handled | 7 | |
| 17 | Any analyses of variability in diagnostic accuracy, distinguishing pre-specified from exploratory | 7 | |
| 18 | Intended sample size and how it was determined | Not applicable | |
| RESULTS | |||
| Participants | 19 | Flow of participants, using a diagram | 5 |
| 20 | Baseline demographic and clinical characteristics of participants | 5 | |
| 21a | Distribution of severity of disease in those with the target condition | Not applicable | |
| 21b | Distribution of alternative diagnoses in those without the target condition | Not applicable | |
| 22 | Time interval and any clinical interventions between index test and reference standard | Not applicable | |
| Test results | 23 | Cross tabulation of the index test results (or their distribution)by the results of the reference standard | 8, 9 |
| 24 | Estimates of diagnostic accuracy and their precision (such as 95% confidence intervals) | 8 | |
| 25 | Any adverse events from performing the index test or the reference standard | Not applicable | |
| DISCUSSION | |||
| 26 | Study limitations, including sources of potential bias, statistical uncertainty, and generalisability | 14 | |
| 27 | Implications for practice, including the intended use and clinical role of the index test | 13 | |
| OTHERINFORMATION | |||
| 28 | Registration number and name of registry | 5 | |
| 29 | Where the full study protocol can be accessed | Not applicable | |
| 30 | Sources of funding and other support; role of funders | Not applicable |
The Cobas c702 dLDL assay has a CV of 1.0% and 0.9% at dLDL levels of 58.4 & 106.4 mg/dL (1.51 & 2.75 mmol/L) respectively. The assay was linear from 19.4 to 374 mg/dL (0.50 to 9.67 mmol/L). The assay LOD was verified as 4.2 mg/dL (0.11 mmol/L).
The distribution of the lipid concentrations for all samples (N = 116,453) are shown in Table 1. No samples exceeded the upper reference limit of the Cobas dLDL assay of 1099 mg/dL (28.4 mmol/L). Of the 605 cases excluded for TG >400 mg/dL (4.5 mmol/L), 23 had TG values higher than its interference limit on the Cobas dLDL assay, which resulted in invalid dLDL results (see Supplementary Table B). In the 32 samples excluded for negative cLDL values, the dLDL was still reportable and ranged from 4.3-66.5 mg/dL (0.11- 1.72 mmol/L); TC in these samples was low and ranged from 25.9-156.0 mg/dL (0.67-4.03 mmol/L) (see Supplementary Table C).
| Biomarker | Range (mg/dL) | Median (95% CI) (mg/dL) | Inter-Quartile range (mg/dL) |
| TC (mg/dL) | 84.0 - 1176 | 215.6 (210.9 to 219.8) | 176.9, 262.4 |
| TG (mg/dL) * | 400 - 4121 | 515 (497 to 530) | 437, 701 |
| HDL (mg/dL) | 5.4 - 80.5 | 31.3 (30.6 to 32.1) | 25.9, 37.5 |
| dLDL (mg/dL) | 12.4 - 537.9 | 108.0 (101.4 to 111.1) | 74.7, 143.6 |
(dLDL/cLDL/HDL/TC: 1 mmol/L = 38.7 mg/dL. TG: 1 mmol/L = 88.6 mg/dL) * Of the cases excluded TG >400 mg/dL, 98 (16.2%) had TG >886 mg/dL (10mmol/L). 23 cases produced invalid dLDL results as they exceeded to Cobas dLDL assay TG interference limit of 2038 mg/dL (23 mmol/L). (Abbreviations: TG: Triglycerides, CI: Confidence interval, TC: Total cholesterol, dLDL: direct LDL)
| Biomarker | Range (mg/dL) | Median (95% CI) (mg/dL) | Inter-Quartile range (mg/dL) |
| TC (mg/dL) * | 25.9 to 156.0 | 75.5 (63.5 to 86.7) | 51.9, 90.2 |
| TG (mg/dL) | 31.0 to 394.3 | 274.7 (216.2 to 290.6) | 183.4, 317.2 |
| HDL (mg/dL) † | 6.6 to 81.7 | 25.5 (20.5 to 33.7) | 17.4, 35.2 |
| dLDL (mg/dL) | 4.3 to 66.5 | 21.7 (13.2 to 27.5) | 8.9, 29.0 |
| cLDL (mg/dL) | -20.1 to -0.8 | -4.3 (-6.2 to -2.7) | -8.5, -1.5 |
(dLDL/cLDL: 1 mmol/L = 38.7 mg/dL. TG: 1 mmol/L = 88.6 mg/dL) * AHA/ACC recommends an optimal TC of ≤147 mg/dL (3.8 mmol/L). 29 out of 32 cases had TC ≤147 mg/dL, correspondingly, 30 out of 32 cases had LDL <54 mg/dL. † AHA/ACC defines low HDL as <1.0 in males and <1.3 in females. 25 subjects had low HDL. (Abbreviations: cLDL: Calculated LDL, TC: Total cholesterol, TG: Triglycerides, dLDL: Direct LDL, AHA: American Heart Association, ACC: American College of Cardiology)
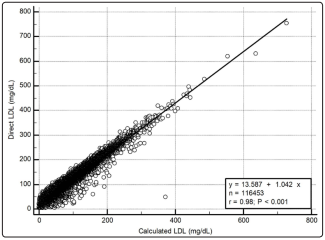
Figure 2: Bland-Altman analysis between calculated and direct LDL. Mean difference 17.5 mg/dL (0.45 mmol/L)
cLDL underestimates dLDL at all the critical decision points for cLDL (see Table 2). At each band of cLDL, the cLDL underestimated the dLDL in 97-99% of cases. The underestimation of dLDL by cLDL also increased progressively with increasing TG bands at every level of cLDL.
When the LDL was analysed by bands of dLDL instead of cLDL, cLDL still underestimates dLDL at all cLDL levels with a similar rise in the mean difference as dLDL and TG levels increased (see Supplementary Table D). Similar results were obtained when only the first lipid panel of each of the 55,307 individual cases were analysed (data not shown).
| dLDL (mg/dL) | N | mean dLDL - cLDL (mg/dL) (95% CI) | dLDL ≥ cLDL N (%) | Deming Regression CorrelationCoefficient (95% CI) | Intercept | Slope |
| <50 | 5040 | 8.5 (8.1 to 8.5) | 4458 (88) | 0.45 (0.43 to 0.47) | -1.3866 | 2.1291 |
| TG < 133 | 3803 | 8.5 (8.1 to 8.5) | 3474 (91) | |||
| TG 133-<266 | 1072 | 8.1 (7.0 to 8.9) | 858 (80) | |||
| TG 266-400 | 165 | 10.1 (6.6 to 13.5) | 126 (76) | |||
| 50 - <70 | 13920 | 13.5 (13.2 to 13.5) | 13595 (98) | 0.54 (0.53 to 0.55) | -2.6038 | 2.4296 |
| TG < 133 | 10334 | 12.0 (12.0 to 12.0) | 10140 (98) | |||
| TG 133-<266 | 3184 | 16.3 (15.9 to 16.3) | 3070 (96) | |||
| TG 266-400 | 402 | 25.5 (24.4 to 27.1) | 385 (96) | |||
| <70 | 18960 | 12.0 (12.0 to 12.0) | 18053 (95) | 0.72 (0.72 to 0.73) | -0.5366 | 1.1574 |
| TG < 133 | 14137 | 11.2 (10.8 to 11.2) | 13614 (96) | |||
| TG 133-<266 | 4256 | 13.9 (13.5 to 14.3) | 3928 (92) | |||
| TG 266-400 | 567 | 20.9 (19.7 to 22.4) | 511 (90) | |||
| 70 - <100 | 35680 | 16.3 (16.3 to 16.3) | 35358 (99) | 0.76 (0.75 to 0.76) | -1.2016 | 1.3557 |
| TG < 133 | 24114 | 14.3 (14.3 to 14.3) | 23961 (99) | |||
| TG 133-<266 | 10380 | 19.0 (18.6 to 19.0) | 10248 (99) | |||
| TG 266-400 | 1186 | 27.1 (26.3 to 27.9) | 1149 (97) | |||
| 100 - <130 | 30254 | 18.6 (18.2 to 18.6) | 30077 (99) | 0.75 (0.74 to 0.75) | -1.7342 | 1.4236 |
| TG < 133 | 19452 | 16.6 (16.3 to 16.6) | 19363 (99) | |||
| TG 133-<266 | 9512 | 20.9 (20.9 to 21.3) | 9448 (99) | |||
| TG 266-400 | 1294 | 29.0 (28.3 to 29.4) | 1266 (98) | |||
| 130 - <160 | 17458 | 20.1 (20.1 to 20.1) | 17373 (99) | 0.68 (0.67 to 0.68) | -3.1034 | 1.6962 |
| TG < 133 | 10895 | 18.2 (18.2 to 18.2) | 10863 (99) | |||
| TG 133-<266 | 5779 | 22.4 (22.1 to 22.4) | 5740 (99) | |||
| TG 266-400 | 784 | 29.8 (29.0 to 30.6) | 770 (98) | |||
| 160 - <190 | 9647 | 22.1 (22.1 to 22.1) | 9597 (99) | 0.67 (0.66 to 0.69) | -3.4411 | 1.6476 |
| TG < 133 | 5127 | 19.4 (19.4 to 19.7) | 5104 (99) | |||
| TG 133-<266 | 3940 | 24.0 (23.6 to 24.4) | 3922 (99) | |||
| TG 266-400 | 580 | 31.7 (31.0 to 32.5) | 571 (98) | |||
| ≥190 | 4447 | 24.4 (24.4 to 24.8) | 4400 (99) | 0.95 (0.95 to 0.96) | -0.7306 | 1.0172 |
| TG < 133 | 1832 | 21.3 (20.9 to 21.7) | 1814 (99) | |||
| TG 133-<266 | 2169 | 25.5 (25.2 to 25.9) | 2146 (99) | |||
| TG 266-400 | 446 | 33.3 (32.1 to 34.8) | 440 (99) |
(dLDL/cLDL: 1 mmol/L = 38.7 mg/dL. TG: 1 mmol/L = 88.6 mg/dL) (Abbreviations: dLDL: Direct LDL, cLDL: Calculated LDL, TG: Triglycerides, CI: Confidence interval)
We compared the distribution and percentage of the population that would be classified at different levels of CVD risk by LDL using cLDL or dLDL readings (see Table 2). The cLDL classified more study subjects as lower risk [LDL <100 mg/dL (2.6 mmol/L)], while dLDL classified more subjects as LDL ≥100 mg/dL. Due to the underestimation of dLDL by cLDL, cLDL classified 32.0% of the population as having a more favourable LDL <70 mg/dL (1.8 mmol/L) instead of 16.3% of the population if dLDL had been used. Conversely, cLDL classified only 15.2% of our population as having an undesirable LDL >130 mg/dL (3.4 mmol/L), while dLDL implicated 27.1%.
Our study confirms that with improved lipid measurements on a contemporary analyser, cLDL underestimates dLDL, resulting in misclassification of CVD risk, as previously reported [9, 10]. The performance of this Cobas dLDL assay against ultracentrifugation has been verified to be outstanding as part of the US Center of Disease Control and Prevention (CDC) Clinical Standardization Program (see Supplementary Figures A and B). This verification was performed at a CDC Cholesterol Reference Method Laboratory Network facility (Erasmus MC, Rotterdam, Netherlands). It is well known that cLDL underestimates the reference method. In his original study, Friedewald reported that cLDL underestimated reference values by 4.6-9.7 mg/dL (0.12-0.25 mmol/L). Recent studies continue to show that cLDL, especially at levels <70 mg/dL, underestimates the reference LDL in the presence of increasing levels of TG up to 400 mg/dL. While early dLDL assays also underestimated the reference LDL, assay technology and methods have improved over time, thanks to the efforts of manufacturers participating in the CDC’s lipid standardization program. Now there is more evidence that dLDL assays provide a closer approximation to reference LDL values than cLDL [11-18]. One study showed that the mean absolute bias of cLDL compared to ultracentrifugation was 8%, with dLDL having a much smaller bias of <1%, and cLDL had a total analytical error of 11% while dLDL only had a total analytical error of 6%. Further reviews have also stated that dLDL assays seem to be able to meet NCEP requirements for LDL testing for precision (CV <4%) and accuracy bias (bias <4%), and better classify individuals into NCEP cutpoints than cLDL [19,20]. In the last CAP EQA report which included cLDL (2018), covering 2908 laboratories, cLDL had a CV of 7.9% at 82 mg/dL (2.1mmol/L) and 26.3% at 35 mg/dL (0.9mmol/L). In the latest 2020 CAP EQA program, the Roche dLDL (n = 551) performed on the Cobas C had a CV of 3.3% and 3.5% at 97 mg/dL (2.5 mmol/L) and 125 mg/dL (3.2 mmol/L) respectively [6-21].
In our hands, cLDL underestimates dLDL in 98.5% of patients, with the underestimation rising with increasing levels of TG/LDL. This is in keeping with the findings in several studies (see Supplementary Table F), especially at triglyceride (TG) levels of ≥177 mg/dL (2 mmol/L) and at low levels of LDL <70 mg/dL (1.8 mmol/L) [4, 11, 29]. It is notable that there are a few studies that report dLDL underestimating cLDL[13, 29-32]. However, these studies were conducted with older versions of the dLDL reagents or on older analytical platforms (See Supplementary Table E). Studies specifically using more recent Roche assays and platforms agree with our findings that cLDL underestimated dLDL at all levels of TG and LDL, and that using cLDL would misclassify more patients as having a lower CVD risk [26, 27]. One obstacle preventing a standard consensus between dLDL assays is that lipid assay standardization needs improvement [33]. Results between dLDL assay studies will continue to vary, especially at higher TG levels [11, 28, 34, 35].
| Author (Study period) | N | Analytical Platforms & Assays | dLDL/cLDLCorrelation | dLDL/cLDL difference (mg/dL) |
| Mora S, et al [30](1992-2006) | 27,331 | Roche reagents; Hitachi 917 | 0.97 - 0.98 | 5.8 - 11.6 |
| Nauck M, et al [13]-1999 | 115 | Roche, Genzyme assay; Hitachi 911 analyser vs cLDL vsultracentrifuge | Not stated | Roche underestimated reference by -14.3mg/dL, cLDL by -4.3mg/ dL |
| Larsson A, et al31 (2014) | 34,981 | Abbott reagents; Architect ci8200 | Not stated | dLDL 10% lower than cLDL, |
| Karkhaneh A, et al32 (2019) | 2752 | Roche reagents; Hitachi 902 analyser | 0.93 | 5 |
| Author(Study period) | N | Analytical Platforms & Assays | dLDL/cLDLCorrelation | dLDL/cLDL difference (mg/dL) |
| Lindsey CC, et al22(2001-2002) | 20,224 | Olympus AU640 analyser; Olympus reagents, Wako dLDL | 0.94 | 7.7 - 31.0 |
| Tanno K, et al [23](2002-2005) | 21,194 | Cholestest-LDL (Daiichi Chemicals); Analyser not stated | 0.95 - 0.97 | 1.5 - 12.8 |
| Tighe DA, et al 24 (2006) | 1604 | RDI LipiDirect assay | 0.90 | 22.1 ± 17.0 |
| Vujovic A, et al 25 (2007) | 1043 | Kyowa Medex; Hitachi 911 Analyser | 0.96 | 10.4 ± 12.0 |
| Anwar et al 26-2011 | 300 | Roche assay; Hitachi 912 analyser | 0.93 | 4.6 |
| Yeoh et al 10(2011-2014) | 1958 | Roche assay; Cobas c501 | Not stated | 14.3 |
| Lekskulchai 27 (2013- 2015) | 1339 | Roche assay; Cobas c501 | 0.93-0.99 | 12.0-15.9 |
| Jialal I, et al9-2017 | 152 | Beckman Synchronanalyser, Beckmanreagents | Not stated | 13.9 |
| Sung KC, et al 28 (2017) | 147,143 | Bayer Reagents,Advia 1,650 analyser | 0.98 | 15.1 |
(dLDL/cLDL: 1 mmol/L = 38.7 mg/dL.) (Abbreviations: cLDL: Calculated LDL, dLDL: Direct LDL)
The underestimation of dLDL by cLDL creates a discordance between the CVD risk classification by LDL levels when using cLDL values instead of dLDL values (0.9-8.1%). Other studies show that the underestimation of dLDL by cLDL leads to misclassification of patients with regards to guideline recommended targets by up to 29% [36]. This produces a double jeopardy in the use of cLDL, as it both understates the proportion of undesirable LDL levels (36.5% with cLDL ≥100 mg/dL vs 53.1% with dLDL) and overstates the proportion of desirable LDL levels (63.5% with cLDL <100 mg/dL vs 46.9% with dLDL).
It is noteworthy that dLDL assays have several advantages over cLDL worth re-emphasizing. The Friedewald equation assumes a fixed ratio of triglycerides and VLDL. This is not always the case, as this ratio can range from 5.2 to 8.9 (for the mg/dL calculation), depending on dietary intake [37]. The Friedewald cLDL is also inapplicable once TG >400 mg/dL (4.5mmol/L). The benefits of this dLDL test include a wide measuring range of 3.9-1099 mg/ dL (0.10-28.4 mmol/L) and the ability to measure LDL without interference at high TG concentrations up to TG of 2038 mg/dL (23 mmol/L). In our study, all samples had dLDL levels within the assay measuring range, and only 23 samples were invalid due to interfering levels of TG >2038 mg/dL (23 mmol/L). In contrast, 605 samples had invalid cLDL due to TG >400 mg/dL. Other studies have also recommended the use of dLDL methods to assess LDL in patients with higher TG levels and low LDL concentrations [9, 20, 38, 39]. In the latest 2020 CAP EQA, TC (tested in over 4000 laboratories) had a CV of 2.5-3.3%, TG 3.7-4.1%, and HDL 9.6-17.9%. Thus, when combined to calculate cLDL, cLDL may have an imprecision that encompasses the CV of each of its individual components [6]. In fact, the CV of cLDL reported in the CAP EQA program has ranged from 7.9-26.3% [21]. In addition, the Friedewald cLDL can also generate invalid negative cLDL values, particularly when TC is low, as exemplified by 32 cases in our study [40]. In these 32 cases with a negative cLDL, the dLDL assay was still able to produce a measurable dLDL result in all of them ranging from 4.3-66.5 mg/dL (0.11-1.72 mmol/L). The Friedewald equation also assumes an absence of chylomicrons and remnant lipoproteins, which may not be true in non-fasting samples and is more likely to be affected by fluctuations in TG in the non-fasting state [27, 41]. However, fasting for dLDL testing is not required as the influence of food intake on dLDL is minimal [42-44]. Some studies show that dLDL measurements from non-fasting samples are more accurate/equivalent to fasting samples with less analytical variability [22, 28, 45]. Recent studies have proposed modifications to the Friedewald equation to derive LDL [42, 46, 47]. However, none of these equations show equal agreement with each other [46]. A recent study which compared eight of these formulae (including the Friedewald) to dLDL found that the correlation with dLDL varied widely (r = 0.678 to 0.959) [31].
this dLDL test include a wide measuring range of 3.9-1099 mg/ dL (0.10-28.4 mmol/L) and the ability to measure LDL without interference at high TG concentrations up to TG of 2038 mg/dL (23 mmol/L). In our study, all samples had dLDL levels within the assay measuring range, and only 23 samples were invalid due to interfering levels of TG >2038 mg/dL (23 mmol/L). In contrast, 605 samples had invalid cLDL due to TG >400 mg/dL. Other studies have also recommended the use of dLDL methods to assess LDL in patients with higher TG levels and low LDL concentrations [9, 20, 38, 39]. In the latest 2020 CAP EQA, TC (tested in over 4000 laboratories) had a CV of 2.5-3.3%, TG 3.7-4.1%, and HDL 9.6-17.9%. Thus, when combined to calculate cLDL, cLDL may have an imprecision that encompasses the CV of each of its individual components [6]. In fact, the CV of cLDL reported in the CAP EQA program has ranged from 7.9-26.3% [21]. In addition, the Friedewald cLDL can also generate invalid negative cLDL values, particularly when TC is low, as exemplified by 32 cases in our study [40]. In these 32 cases with a negative cLDL, the dLDL assay was still able to produce a measurable dLDL result in all of them ranging from 4.3-66.5 mg/dL (0.11-1.72 mmol/L). The Friedewald equation also assumes an absence of chylomicrons and remnant lipoproteins, which may not be true in non-fasting samples and is more likely to be affected by fluctuations in TG in the non-fasting state [27, 41]. However, fasting for dLDL testing is not required as the influence of food intake on dLDL is minimal [42-44]. Some studies show that dLDL measurements from non-fasting samples are more accurate/equivalent to fasting samples with less analytical variability [22, 28, 45]. Recent studies have proposed modifications to the Friedewald equation to derive LDL [42, 46, 47]. However, none of these equations show equal agreement with each other [46]. A recent study which compared eight of these formulae (including the Friedewald) to dLDL found that the correlation with dLDL varied widely (r = 0.678 to 0.959) [31]. Our study compares cLDL to a new generation of improved dLDL assay (Generation 3 Roche assay, available since 2016) and run on a contemporary auto-analyser (Roche Cobas c702). The strength of this report is the large sample size (N = 116,453) used for comparison. For the benefit of readers, we have also listed prior studies in this area (see Supplementary Table E and F). The cLDL results are similar to that obtained with older Roche dLDL assays performed on previous generations of Roche analyzers. The new findings in our study are as follows:
• Despite close agreement between cLDL and dLDL (r = 0.98), cLDL underestimates dLDL in 98.5% (N = 114,750) of our population. The difference between dLDL/cLDL increases with increasing cLDL, dLDL and TG.
• cLDL classified a greater proportion of subjects as lower CVD risk (LDL <100 mg/dL).
• The cLDL generated negative values in 32 patients (the dLDL was able to report the LDL in all these cases).
Our study has some limitations. As previously stated, the aim of our study was not to compare cLDL/dLDL to the reference method. While beta-quantitation is the reference method for LDL measurement, it is not widely available. It combines ultracentrifugation with chemical precipitation prior to measurement of cholesterol in the relevant fraction. As a reference method, ultracentrifugation is highly accurate and stable when performed correctly. However, this process is quite involved, time consuming, and laborious. In beta-quantitation, VLDL and chylomicrons float to the top of the tube following an overnight ultracentrifugation of serum at its native density (d = 1.006 g/mL) and are removed. Aliquots of the infranate are measured for cholesterol and HDL. LDL is then calculated as the difference between the cholesterol measured in the infranate and the HDL fraction. When using ultracentrifugation, the CDC stipulates that the TC should have a maximum imprecision of ≤3.0%, the HDL ≤4.0%, the TG ≤5.0%, and the LDL ≤4.0% [48]. The reference method has not gained wider utility because it requires specialized and expensive equipment. Although beta quantification is considered the reference method, it remains an indirect measure of LDL-C. In addition, there is also a degree of subjective visual estimation involved when discerning what makes up the infranate and supranate. Moreover, high levels of Lp(a) may not be fully removed from the infranate in ultracentrifugation, which can lead to falsely raised LDLs [49]. As we did not compare the dLDL/ cLDL to ultracentrifugation, it is possible that any differences between them may also have been caused in part by some slight overestimation of the true LDL. However, this does not detract from the limitations of cLDL and the benefits of using dLDL. As a single centre study, in a single geographic location, our study may not be generalizable. We had no access to the fasting status and existing lipid-lowering therapies in the study subjects. However, fasting has less effect on dLDL measurement, while TG and cLDL stand to be more affected. This study is confined to the Roche dLDL on a single Roche platform, the c702. We also did not have any information on subject co-morbidities such as diabetic status, renal function, or liver function. Further studies would be desirable to compare dLDL and cLDL in these patient groups.
The Roche Cobas c702 dLDL assay is highly correlated with cLDL. cLDL persistently underestimates dLDL values across all levels of TG and LDL. cLDL may misclassify patients into lower cardiovascular risk categories.
Table 1: Distribution of lipid parameters in the study population
| Biomarker | Range (mg/dL) | Median (95% CI) (mg/dL) | Inter-Quartile Range (mg/dL) |
| TC (mg/dL) * | 25.2 - 924.2 | 164.5 (164.0 to 164.9) | 136.6, 197.0 |
| TG (mg/dL) † | 16.8 - 398.7 | 109.9 (109.0 to 109.9) | 79.7, 153.3 |
| HDL (mg/dL) ‡ | 3.5 - 166.4 | 49.5 (49.5 to 49.9) | 40.2, 61.5 |
| dLDL (mg/dL) § | 3.9 - 753.1 | 103.7 (103.3 to 103.7) | 78.9, 134.3 |
(dLDL/cLDL/HDL/TC: 1 mmol/L = 38.7 mg/dL. TG: 1 mmol/L = 88.6 mg/dL) * AHA/ACC recommends an optimal TC of ≤147 mg/dL (3.8 mmol/L). 65.3% of the study population had TC >147 mg/dL (N = 76,061). † Cases with TG >400 mg/dL were excluded in this study (N = 605). ‡ AHA/ACC defines low HDL as <40 mg/dL (1.0m mol/L) in males and <50 mg/dL (1.3 mmol/L) in females. 30.5% (N = 35,427) of our total study population had low HDL [males 28.2% (N = 18,504), females 33.3% (N = 16,923)]. § European Society of Caridology/European Atherosclerosis Society guidelines recommend a target of LDL <54 mg/dL (1.4 mmol/L) for patients with very high CVD risk. 5.9% (N = 6900) of our subjects have dLDL <54 mg/dL, while 15.8% (N = 18,385) have cLDL <54 mg/dL. (Abbreviations: CI: Confidence interval, TC: Total cholesterol, TG: Triglycerides, dLDL: Direct LDL, cLDL: Calculated LDL, AHA: American Heart Association, ACC: American College of Cardiology)
Table 2: Comparison of dLDL with cLDL levels by cLDL/TG
| cLDL (mg/dL) | 0.00 - 726.8 | 85.9 (85.5 to 86.3) | 63.1, 115.3 |
| cLDL (mg/dL) | N | dLDL - cLDL (mg/dL) (95% CI) | dLDL ≥ cLDL N (%) |
| <50 | 14440 | 15.1 (14.7 to 15.1) | 14022 (97) |
| TG < 133 | 9715 | 12.4 (12.0 to 12.4) | 9460 (97) |
| TG 133-<266 | 3887 | 18.6 (18.2 to 18.6) | 3747 (96) |
| TG 266-400 | 838 | 30.2 (29.4 to 31.0) | 815 (97) |
| 50 - <70 | 22819 | 15.9 (15.9 to 15.9) | 22466 (98) |
| TG < 133 | 15467 | 13.9 (13.9 to 13.9) | 15246 (99) |
| TG 133-<266 | 6545 | 19.4 (19.4 to 19.7) | 6426 (98) |
| TG 266-400 | 807 | 29.0 (29.4 to 31.0) | 794 (98) |
| <70 | 37259 | 15.5 (15.5 to 15.5) | 36488 (98) |
| TG < 133 | 25182 | 13.2 (13.2 to 13.2) | 24706 (98) |
| TG 133-<266 | 10432 | 19.0 (18.6 to 19.0) | 10173 (98) |
| TG 266-400 | 1645 | 29.4 (29.0 to 30.2) | 1609 (98) |
| 70 - <100 | 36710 | 17.4 (17.0 to 17.4) | 36319 (99) |
| TG < 133 | 24313 | 15.5 (15.5 to 15.5) | 24138 (99) |
| TG 133-<266 | 11109 | 20.1 (19.7 to 20.1) | 10938 (98) |
| TG 266-400 | 1288 | 27.5 (26.7 to 28.3) | 1243 (97) |
| 100 - <130 | 24790 | 18.6 (18.2 to 18.6) | 24583 (99) |
| TG < 133 | 16244 | 17.0 (17.0 to 17.0) | 16148 (99) |
| TG 133-<266 | 7569 | 21.3 (21.3 to 21.7) | 7494 (99) |
| TG 266-400 | 977 | 27.9 (26.7 to 28.6) | 941 (96) |
| 130 - <160 | 11193 | 19.7 (19.7 to 20.1) | 11096 (99) |
| TG < 133 | 6645 | 17.8 (17.4 to 17.8) | 6602 (99) |
| TG 133-<266 | 4050 | 22.4 (22.0 to 22.4) | 4008 (99) |
| TG 266-400 | 498 | 29.0 (27.9 to 30.2) | 486 (98) |
| 160 - <190 | 4690 | 20.5 (20.1 to 20.9) | 4625 (99) |
| TG < 133 | 2449 | 18.1 (17.7 to 18.5) | 2422 (99) |
| TG 133-<266 | 1987 | 22.4 (22.0 to 22.8) | 1962 (99) |
| TG 266-400 | 254 | 28.3 (26.7 to 30.2) | 241 (95) |
| ≥190 | 1811 | 20.9 (20.5 to 21.7) | 1750 (97) |
| TG < 133 | 731 | 18.2 (17.4 to 19.0) | 709 (97) |
| TG 133-<266 | 882 | 21.7 (20.5 to 22.8) | 851 (96) |
| TG 266-400 | 198 | 29.0 (26.7 to 31.7) | 190 (96) |
(dLDL/cLDL: 1 mmol/L = 38.7 mg/dL. TG: 1 mmol/L = 88.6 mg/dL) (Abbreviations: dLDL: Direct LDL, cLDL: Calculated LDL, TG: Triglycerides, CI: Confidence interval)
Table 3: Influence of cLDL and dLDL on LDL categorization for CVD risk
| LDL (mg/dL) | cLDL N (%) | dLDL N (%) | Difference in % distribution |
| <50 | 14440 (12.4) | 5042 (4.3) | 8.1 |
| 50 - <70 | 22819 (19.6) | 13920 (12.0) | 7.6 |
| 70 - <100 | 36710 (31.5) | 35681 (30.6) | 0.9 |
| 100 - <130 | 24790 (21.3) | 30258 (26.0) | 4.7 |
| 130 - <160 | 11193 (9.6) | 17458 (15.0) | 5.4 |
| 160 - <190 | 4690 (4.0) | 9647 (8.3) | 4.3 |
| ≥190 | 1811 (1.6) | 4447 (3.8) | 2.2 |
(dLDL/cLDL: 1 mmol/L = 38.7 mg/dL.) (Abbreviations: cLDL: Calculated LDL, dLDL: Direct LDL, CVD: Cardiovascular risk)